REVIEW 3 major objections 5 minor 42 references
The First Detection of 13C17O in a Protoplanetary Disk: a Robust Tracer of Disk Gas Mass
T0 review · 3 major / 5 minor · reviewed 2026-08-14 · deepseek-v4-flash
Pith's one-line read The first detection of the rarest form of carbon monoxide in a planet-forming disk shows the disk holds 3.5 times more gas than previous estimates.
desk verdict A genuine first detection and a useful demonstration that 13C17O is optically thin, but the factor-3.5 disk mass increase is not robust until isotope-ratio uncertainties are propagated. read the letter →
The pith
A machine-rendered reading of the paper's core claim, the machinery that carries it, and where it could break.
The reading
What carries the argument
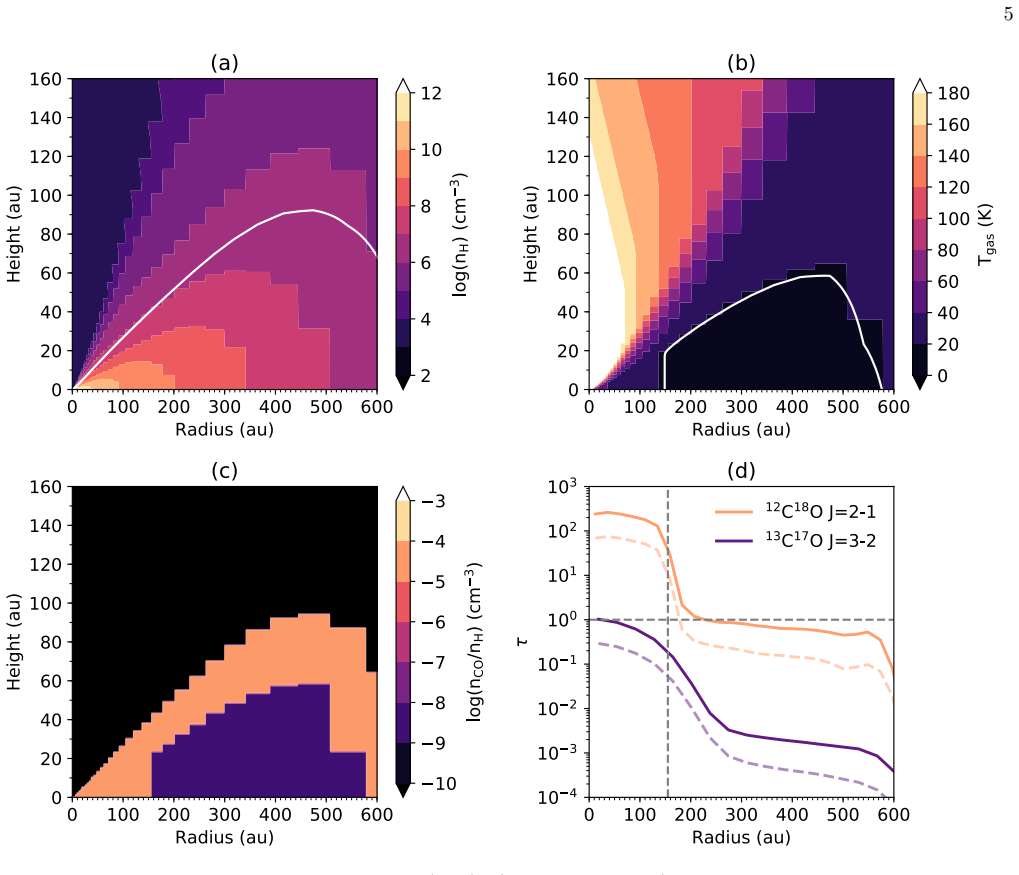
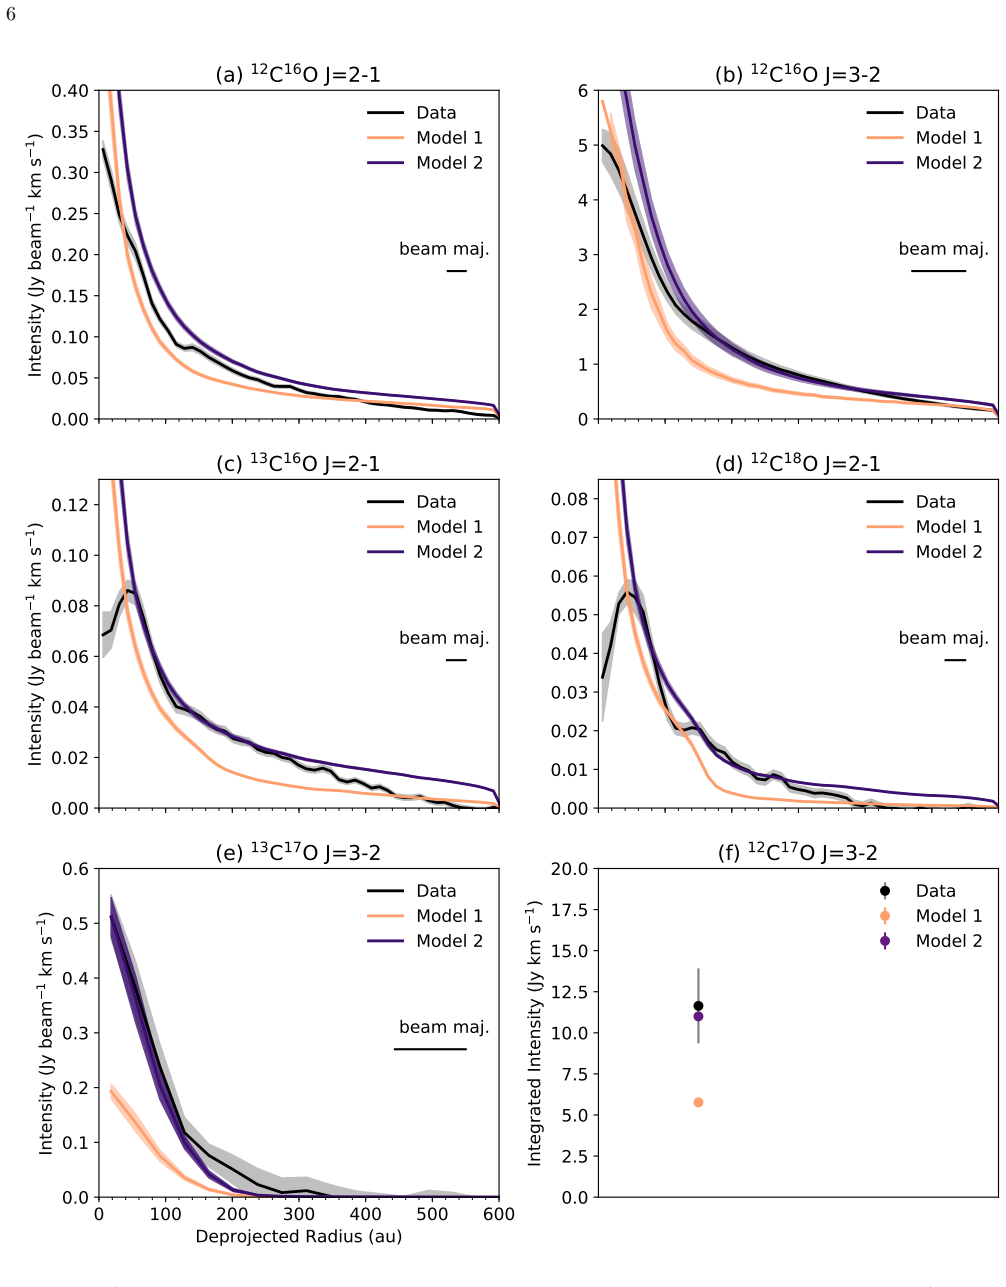
The central object is the $^{13}$C$^{17}$O $J=3$--$2$ line, the rarest stable CO isotopologue, whose low abundance guarantees optically thin emission that scales directly with CO column density. The argument is carried by a forward radiative-transfer model: the disk density and temperature structure from Qi et al. (2011), a constant $^{13}$C$^{17}$O fractional abundance of $5.39\times 10^{-10}$ relative to H$_2$, and the radiative transfer code described by Brinch & Hogerheijde (2010) to synthesize the hyperfine-blended line, which is then smoothed to the observed beam and compared with deprojected, azimuthally averaged radial profiles of five isotopologues. The key diagnostic is the optical depth: computed maps show $\tau(\mathrm{C}^{18}\mathrm{O}\,J=2$--$1)>1$ inside the 155 au snowline while $\tau({}^{13}\mathrm{C}^{17}\mathrm{O}\,J=3$--$2)<1$ everywhere, so the $^{13}$C$^{17}$O brightness requires the global CO gas mass to be increased by a factor of 3.5.
What would settle it
Measure a second $^{13}$C$^{17}$O rotational transition (for example $J=2$--$1$ or $J=4$--$3$) in HD 163296: optically thin LTE emission predicts a fixed intensity ratio set by the excitation temperature, so a measured ratio that departs from that prediction, or a line profile showing self-absorption, would mean the emission is not fully optically thin and the inferred factor-of-3.5 mass increase would need revision.
Extended reading notes
Core claim
Using ALMA Band 7 observations, the authors detect the $^{13}$C$^{17}$O $J=3$--$2$ line from the HD 163296 disk and compare its radial intensity profile with archival maps of $^{12}$CO, $^{13}$CO, C$^{18}$O, and C$^{17}$O. Adopting the disk density and temperature structure of Qi et al. (2011) and interstellar isotope ratios, which set the $^{13}$C$^{17}$O abundance to $5.39\times 10^{-10}$ relative to H$_2$, their radiative-transfer model underpredicts the observed $^{13}$C$^{17}$O integrated intensity by a factor of 2.5. Raising the total gas mass by a factor of 3.5 reproduces all the isotopologue profiles and yields a disk gas mass of $0.31\,M_\odot$ ($0.21\,M_\odot$ at the 101.5 pc Gaia distance). The paper argues that C$^{18}$O is optically thick within the CO snow line at 155 au, so it cannot trace the bulk disk gas, whereas $^{13}$C$^{17}$O stays optically thin across the disk and therefore does trace that gas.
Load-bearing premise
The 3.5-fold mass increase rests on assuming that the amount of $^{13}$C$^{17}$O per hydrogen molecule in the disk equals the interstellar value of $5.39\times 10^{-10}$ and that the adopted density and temperature structure of the disk is correct; if either assumption is wrong, the required scaling changes.
Editorial extensions
If this is right
- C$^{18}$O-based disk gas masses are lower limits wherever C$^{18}$O is optically thick; for HD 163296 the underestimate relative to $^{13}$C$^{17}$O is a factor of 2–6.
- The HD 163296 disk gas mass is $0.31\,M_\odot$ ($0.21\,M_\odot$ at 101.5 pc), with a gas-to-dust ratio near 260, placing it at the high end of previous estimates.
- With higher angular resolution and sensitivity, $^{13}$C$^{17}$O emission can directly map the midplane CO snow line, a measurement C$^{18}$O cannot provide because of its opacity.
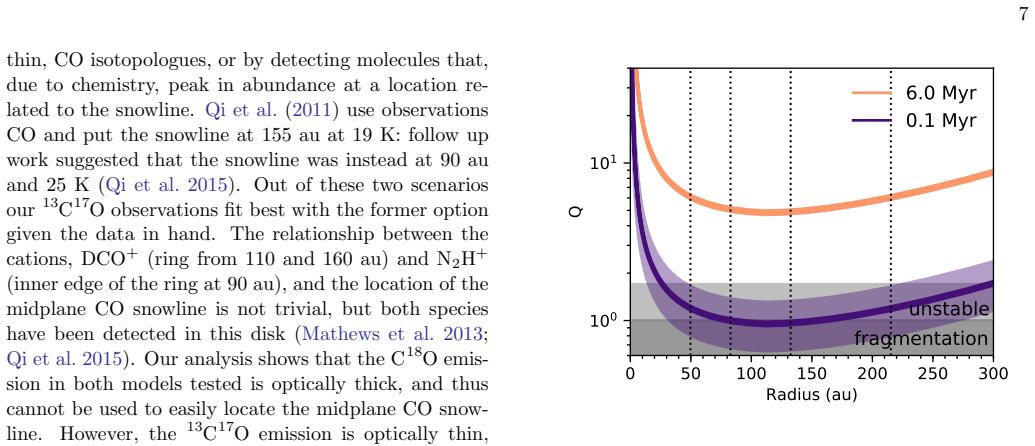
- The disk is gravitationally stable today (minimum Toomre Q near 6 at about 110 au), but extrapolated back to an age of 0.1 Myr the same mass gives Q between 1.3 and 0.7, implying early gravitational instability is plausible.
- Detecting $^{13}$C$^{17}$O in additional disks could help close the gap between measured disk masses and the masses inferred for the exoplanet population.
Reading between the lines
- If isotope-selective photodissociation lowers the $^{13}$C$^{17}$O abundance in the line-forming region below the interstellar value, the required gas mass would be even higher than the factor of 3.5 quoted here, making disk masses from CO an even stronger lower limit.
- The same measurement in the TW Hya disk, where $^{13}$C$^{18}$O has already been detected, would show whether the optical-depth bias in C$^{18}$O is universal or specific to massive, warm disks around Herbig Ae/Be stars such as HD 163296.
- A clean test of the paper's optically thin assumption is to observe two $^{13}$C$^{17}$O transitions: their line ratio should follow the LTE optically thin prediction, and any excess ratio would reveal either residual opacity or a non-thermal excitation component not in the adopted model.
Signed reviews
Editorial analysis
A structured set of objections, weighed in public.
Referee Report
Summary. The paper reports the first detection of the 13C17O J=3-2 line in a protoplanetary disk, HD 163296, using ALMA Cycle 3 data. The detection is claimed at matched-filter S/N ≈ 3.5 and integrated-intensity S/N ≈ 7. The authors compare the new line with existing 12CO, 13CO, C18O, and C17O observations, using a radiative transfer model of the disk (Qi et al. 2011) with interstellar isotopic abundances. This model underpredicts the 13C17O integrated intensity by a factor ~2.5. Scaling the disk gas mass upward by a factor 3.5 (chosen by eye) reproduces the observation, yielding a disk mass of 0.31 Msun (or 0.21 Msun at the revised Gaia distance) and a gas-to-dust ratio of ~260. The paper argues that C18O emission is optically thick inside the CO snowline while 13C17O is optically thin, and uses the new mass to evaluate the disk's gravitational stability.
Significance. If the result holds, it would be the first detection of the rarest stable CO isotopologue in a protoplanetary disk, and it would support the emerging picture that CO-based gas masses may be underestimated because the more abundant isotopologues are optically thick. The application of a single physical disk model to five CO isotopologues, including the new optically thin probe, is a valuable step. The paper also computes optical depth maps and considers an alternative snowline location. The modeling makes use of publicly available codes (LIME, VISIBLE), which aids reproducibility. However, the key quantitative claim—the factor-3.5 mass increase—is not accompanied by an uncertainty estimate and is strongly degenerate with the assumed isotopic abundances, so the significance of the central result is currently limited.
major comments (3)
- [3 (Model 2)] The factor of 3.5 mass increase is determined by an unquantified by-eye fit: the text states that the gas mass was increased from 1.5 in steps of 0.5 until the 'best by-eye fit' of 3.5 was found, with no uncertainty quoted on this factor. Since this factor is the central quantitative result of the paper, the authors should replace the by-eye procedure with a formal chi-square or likelihood analysis over the mass scaling factor (and, ideally, the model parameters) and report a confidence interval or equivalent. As it stands, the headline disk mass of 0.31 Msun has no statistical error bar.
- [3 (Model 1) and 4.2] The assumed 13C17O fractional abundance of 5.39e-10 relative to H2 is derived from the Qi et al. (2011) isotope ratios, which carry substantial uncertainties: n(12C16O)/n(12C18O) = 444±88 and n(12C18O)/n(12C17O) = 3.8±1.7. Propagating these 1-sigma errors into the 17O/16O ratio changes the required gas-mass scaling by roughly a factor of 1.5–1.8; at 2 sigma in 18O/17O the inferred mass increase can be as low as ~1.3 or vanish entirely. The paper does not propagate these errors, nor does it explore the degeneracy between gas mass and 13C17O abundance. This is load-bearing because the factor of 3.5 is the basis for all subsequent conclusions (disk mass, gas-to-dust ratio, Toomre Q analysis).
- [4.2 and Conclusions] The argument that the derived gas mass is a lower limit is one-sided. The authors consider only chemical effects (freeze-out, isotope-selective photodissociation, carbon depletion) that would lower the 13C17O abundance and hence raise the inferred mass; they do not consider that the random uncertainty in the adopted interstellar isotope ratios could make the true 13C17O abundance higher than assumed, which would lower the inferred mass. Therefore the statement in Section 5 that the work 'provides robust evidence that disks are more massive than previously assumed' is not supported until the isotope-ratio uncertainty is propagated into the mass estimate.
minor comments (5)
- [2] The phrase 'The resulting S/N ratio is ≈ 3.5' is redundant; use 'signal-to-noise ratio' or 'S/N' instead. Also, the beam size '0.87 x 0.51 (100◦)' should specify 'degrees' for the position angle to avoid ambiguity.
- [3] The term 'nH column density' is ambiguous because nH denotes the number density elsewhere in the paper; use 'column density of hydrogen nuclei, NH' instead.
- [4.1] The dust mass from Isella et al. (2007) that yields g/d ≈ 260 is not stated; including it (and its distance assumption) would allow the reader to assess the sensitivity of g/d to the revised Gaia distance.
- [4.4] The statement 'We note this does not account for any change in the stellar mass over this time period, which would decrease Q further' is ambiguous; specify whether the stellar mass is assumed constant or specify how it would evolve.
- [References] The reference entry 'Williams J. P. and Best W. M. J. 2014' should be formatted as 'Williams, J. P., & Best, W. M. J. 2014' to match the journal style.
Circularity Check
The factor-3.5 disk mass increase is the same as the by-eye scaling factor fitted to the 13C17O line, so the headline mass is a fit rather than an independent prediction.
-
fitted input called prediction
[Section 3, Model 2 (paragraph after Model 1); Abstract]
"To better fit the 13C17O observations we globally increase the gas mass of Model 1. This was done by initially multiplying nH by a factor of 1.5 and then increasing this factor in steps of 0.5 until the best by-eye fit of 3.5 was found."
The factor 3.5 reported in the Abstract as 'Reconciliation ... requires a global increase in CO gas mass by a factor of 3.5' is exactly this manually chosen multiplier. Model 2's mass (0.31 Msun) is just Model 1's mass (0.089 Msun) times 3.5. Because the 13C17O integrated intensity is the quantity used to set the scaling, using the resulting model to claim that 13C17O is a 'robust tracer of disk gas mass' or that C18O is optically thick is not an independent test of the mass; those conclusions are properties of the fitted model. The consistency check that Model 2 'provides a better fit to all of the lines' gives some independent support, but the headline mass increase itself reduces by construction to the fitted parameter.
full rationale
The paper's core quantitative claim—a global CO gas mass increase by a factor of 3.5—is the value of a fitted scaling parameter, not an independently predicted quantity. The 13C17O observation is a new and real detection, and the Qi et al. (2011) model is external (though one author is a coauthor), so the circularity is not a self-citation chain or a uniqueness argument. However, the central mass estimate is calibrated to the very line that is then declared a 'robust tracer' of disk gas mass, and the derived mass is directly proportional to the assumed 13C17O abundance. The paper does not propagate the uncertainty in that abundance into the mass, so the 3.5 factor is presented without acknowledging the degeneracy between mass and isotope ratio. This makes the claimed mass increase partially circular: it is a fit presented as a requirement, rather than a prediction validated against independent data.
Assumptions & free parameters
free parameters (3)
- Global gas mass scaling factor =
3.5
- CO snowline location =
155 au (primary), 90 au (alternative)
- 13C17O fractional abundance =
5.39e-10 relative to H2
assumptions (4)
- domain assumption The Qi et al. (2011) disk density and temperature structure applies to HD 163296.
- domain assumption CO abundance is 6.0e-5 relative to H2 in the molecular layer, reduced by 1e-4 below 19 K and by 1e-8 above a vertical column threshold.
- domain assumption Interstellar carbon and oxygen isotope ratios apply in the disk, with no significant isotope-selective photodissociation for 13C17O.
- domain assumption The 13C17O J=3-2 line is optically thin, justifying the LTE column density and the linear scaling of mass with intensity.
Cite this review
Pith. "Pith review of The First Detection of 13C17O in a Protoplanetary Disk: a Robust Tracer of Disk Gas Mass." pith.science (2026). https://pith.science/paper/JHXKSPJ4
@misc{pith2026190805045,
  author       = {Pith},
  title        = {Pith review of: The First Detection of 13C17O in a Protoplanetary Disk: a Robust Tracer of Disk Gas Mass},
  year         = {2026},
  howpublished = {\url{https://pith.science/paper/JHXKSPJ4}},
  note         = {Machine review of arXiv:1908.05045}
}
read the original abstract
Measurements of the gas mass are necessary to determine the planet formation potential of protoplanetary disks. Observations of rare CO isotopologues are typically used to determine disk gas masses; however, if the line emission is optically thick this will result in an underestimated disk mass. With ALMA we have detected the rarest stable CO isotopologue, 13C17O, in a protoplanetary disk for the first time. We compare our observations with the existing detections of 12CO, 13CO, C18O and C17O in the HD163296 disk. Radiative transfer modelling using a previously benchmarked model, and assuming interstellar isotopic abundances, significantly underestimates the integrated intensity of the 13C17O J=3-2 line. Reconciliation between the observations and the model requires a global increase in CO gas mass by a factor of 3.5. This is a factor of 2-6 larger than previous gas mass estimates using C18O. We find that C18O emission is optically thick within the CO snow line, while the 13C17O emission is optically thin and is thus a robust tracer of the bulk disk CO gas mass.
Figures

Figures from the paper (1 more)
Reference graph
Works this paper leans on
-
[1]
P., van der Marel, N., et al
Ansdell, M., Williams, J. P., van der Marel, N., et al. 2016, ApJ, 828, 46
2016
-
[2]
Bergin, E. A., & Williams, J. P. 2017, in Astrophysics and Space Science Library, Vol. 445, Astrophysics and Space Science Library, ed. M. Pessah & O. Gressel, 1
work page 2017
-
[3]
Bergin, E. A., Cleeves, L. I., Gorti, U., et al. 2013, Nature, 493, 644
work page 2013
-
[4]
Boneberg, D. M., Pani´ c, O., Haworth, T. J., Clarke, C. J., & Min, M. 2016, MNRAS, 461, 385
work page 2016
-
[5]
D., Walsh, C., & van Dishoeck, E
Bosman, A. D., Walsh, C., & van Dishoeck, E. F. 2018, A&A, 618, A182
2018
-
[6]
Boss, A. P. 2011, ApJ, 731, 74
2011
-
[7]
Brinch, C., & Hogerheijde, M. R. 2010, A&A, 523, A25
work page 2010
-
[8]
T., Fedele, D., Hogerheijde, M
Carney, M. T., Fedele, D., Hogerheijde, M. R., et al. 2018, A&A, 614, A106 4 We note this does not account for any change in the stellar mass over this time period, which would decrease Q further
work page 2018
Show all 42 references
-
[9]
T., Hogerheijde, M
Carney, M. T., Hogerheijde, M. R., Guzm´ an, V. V., et al. 2019, A&A, 623, A124
2019
-
[10]
H., Boss, A
Durisen, R. H., Boss, A. P., Mayer, L., et al. 2007, Protostars and Planets V, 607
2007
-
[11]
G., Ilee, J
Evans, M. G., Ilee, J. D., Boley, A. C., et al. 2015, MNRAS, 453, 1147 Gaia Collaboration, Brown, A. G. A., Vallenari, A., et al. 2018, A&A, 616, A1
2015
-
[12]
E., Langer, W
Graedel, T. E., Langer, W. D., & Frerking, M. A. 1982, ApJS, 48, 321
1982
-
[13]
2016, ARA&A, 54, 135
Hartmann, L., Herczeg, G., & Calvet, N. 2016, ARA&A, 54, 135
2016
-
[14]
2007, A&A, 469, 213
Isella, A., Testi, L., Natta, A., et al. 2007, A&A, 469, 213
2007
-
[15]
2016, Physical Review Letters, 117, 251101
Isella, A., Guidi, G., Testi, L., et al. 2016, Physical Review Letters, 117, 251101
2016
-
[16]
M., et al
Isella, A., Huang, J., Andrews, S. M., et al. 2018, ApJL, 869, L49
2018
-
[17]
F., et al
Kama, M., Bruderer, S., van Dishoeck, E. F., et al. 2016, A&A, 592, A83 9
2016
-
[18]
2003, The Astrophysical Journal, 582, 262
Klapper, G., Surin, L., Lewen, F., et al. 2003, The Astrophysical Journal, 582, 262
2003
-
[19]
2018, ApJ, 857, 87
Liu, S.-F., Jin, S., Li, S., Isella, A., & Li, H. 2018, ApJ, 857, 87
2018
-
[20]
J., Pascucci, I., et al
Long, F., Herczeg, G. J., Pascucci, I., et al. 2017, ApJ, 844, 99
2017
-
[21]
A., ¨Oberg, K
Loomis, R. A., ¨Oberg, K. I., Andrews, S. M., et al. 2018, AJ, 155, 182
2018
-
[22]
F., Morbidelli, A., & Guillot, T
Manara, C. F., Morbidelli, A., & Guillot, T. 2018, A&A, 618, L3
2018
-
[23]
S., Klaassen, P
Mathews, G. S., Klaassen, P. D., Juh´ asz, A., et al. 2013, A&A, 557, A132
2013
-
[24]
K., Bergin, E
McClure, M. K., Bergin, E. A., Cleeves, L. I., et al. 2016, ApJ, 831, 167 Mendigut´ ıa, I., Brittain, S., Eiroa, C., et al. 2013, ApJ, 776, 44
2016
-
[25]
Miotello, A., Bruderer, S., & van Dishoeck, E. F. 2014, A&A, 572, A96
2014
-
[26]
2017, ApJ, 849, 130 M¨ uller, H
Molyarova, T., Akimkin, V., Semenov, D., et al. 2017, ApJ, 849, 130 M¨ uller, H. S. P., Schl¨ oder, F., Stutzki, J., & Winnewisser, G. 2005, JMoSt, 742, 215
2017
-
[27]
2019, ApJ, 875, 96
Notsu, S., Akiyama, E., Booth, A., et al. 2019, ApJ, 875, 96
2019
-
[28]
J., M´ enard, F., et al
Pinte, C., Price, D. J., M´ enard, F., et al. 2018, ApJL, 860, L13
2018
-
[29]
M., Schlichting, H
Powell, D., Murray-Clay, R., P´ erez, L. M., Schlichting, H. E., & Rosenthal, M. 2019, ApJ, 878, 116
2019
-
[30]
I., et al
Qi, C., D’Alessio, P., ¨Oberg, K. I., et al. 2011, ApJ, 740, 84
2011
-
[31]
I., Andrews, S
Qi, C., ¨Oberg, K. I., Andrews, S. M., et al. 2015, ApJ, 813, 128
2015
-
[32]
Rice, W. K. M., Lodato, G., Pringle, J. E., Armitage, P. J., & Bonnell, I. A. 2004, MNRAS, 355, 543
2004
-
[33]
2018, ApJL, 860, L12
Foreman-Mackey, D. 2018, ApJL, 860, L12
2018
-
[34]
2012, A&A, 538, A20
Tilling, I., Woitke, P., Meeus, G., et al. 2012, A&A, 538, A20
2012
-
[35]
1964, ApJ, 139, 1217 van den Ancker, M
Toomre, A. 1964, ApJ, 139, 1217 van den Ancker, M. E., de Winter, D., & Tjin A Djie, H. R. E. 1998, A&A, 330, 145
1964
-
[36]
2014, A&A, 570, A82
Venuti, L., Bouvier, J., Flaccomio, E., et al. 2014, A&A, 570, A82
2014
-
[37]
J., & Nomura, H
Walsh, C., Millar, T. J., & Nomura, H. 2010, ApJ, 722, 1607
2010
-
[38]
P., & McPartland, C
Williams, J. P., & McPartland, C. 2016, ApJ, 830, 32 Williams J. P. and Best W. M. J. 2014, ApJ, 788, 59
2016
-
[39]
Wilson, T. L. 1999, Reports on Progress in Physics, 62, 143
1999
-
[40]
2019, PASP, 131, 064301
Woitke, P., Kamp, I., Antonellini, S., et al. 2019, PASP, 131, 064301
2019
-
[41]
Schwarz, K. R. 2017, Nature Astronomy, 1, 0130
2017
-
[42]
2019, ApJL, 877, L18
Zhu, Z., Zhang, S., Jiang, Y.-F., et al. 2019, ApJL, 877, L18
2019
Reviewed August 14, 2026 · model on record in the stance chip above.
Discussion (0). Continue with ORCID to comment.