REVIEW 4 major objections 8 minor 34 references
Polarization fraction measurement in ZZ scattering using deep learning
T0 review · 4 major / 8 minor · reviewed 2026-08-14 · deepseek-v4-flash
Pith's one-line read A particle-based deep neural network that preprocesses inputs with a power transformation and decorrelates its outputs with PCA raises the expected significance for measuring the longitudinal ZZ polarization fraction at the HL-LHC to 1.74…
desk verdict A clean fast-simulation study showing a modest but real gain for longitudinal ZZ extraction via a particle-based DNN with PCA, yet the HL-LHC projection rests on a no-pileup assumption that could easily erase the improvement. read the letter →
The pith
A machine-rendered reading of the paper's core claim, the machinery that carries it, and where it could break.
The reading
What carries the argument
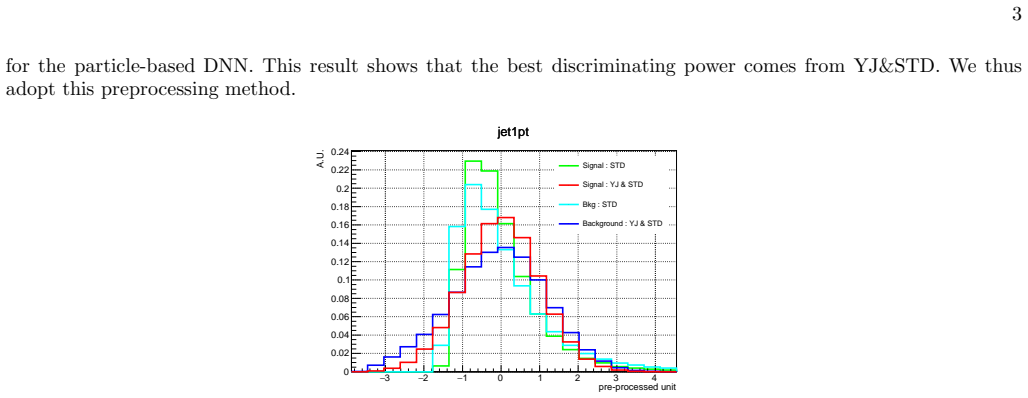
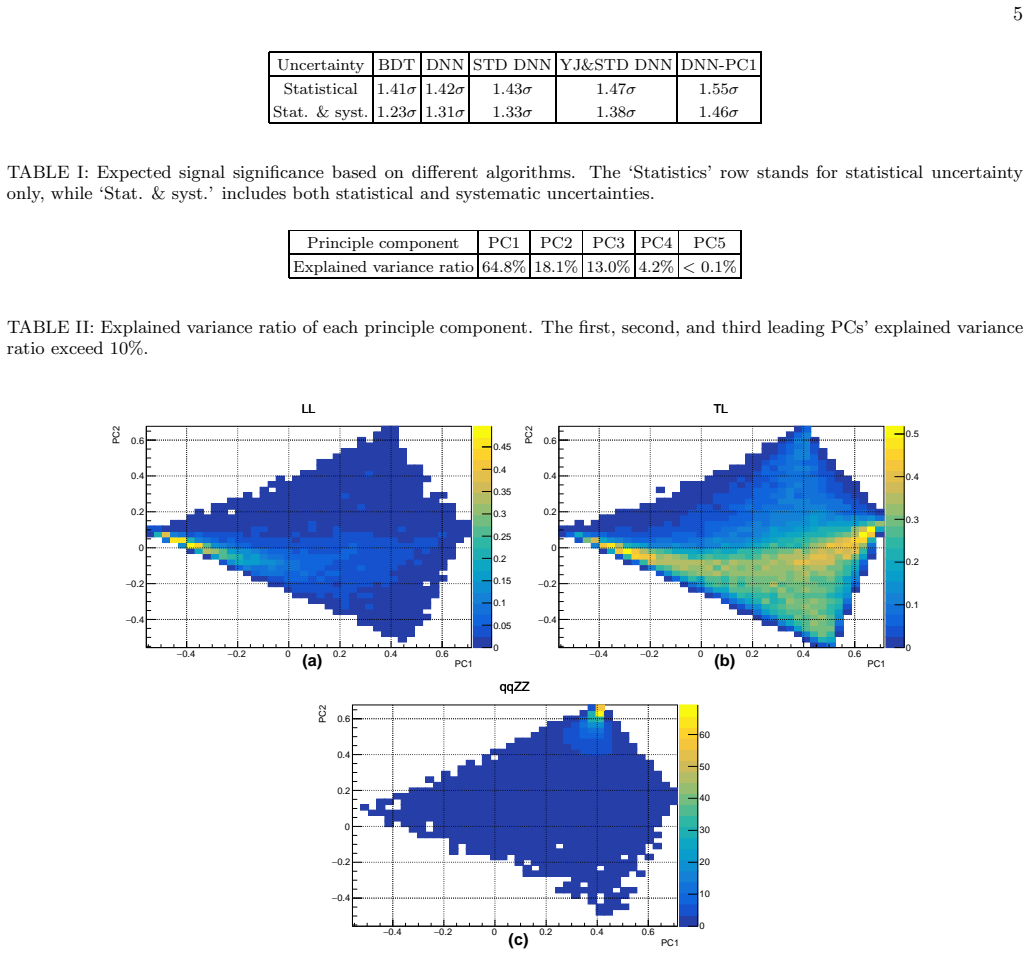
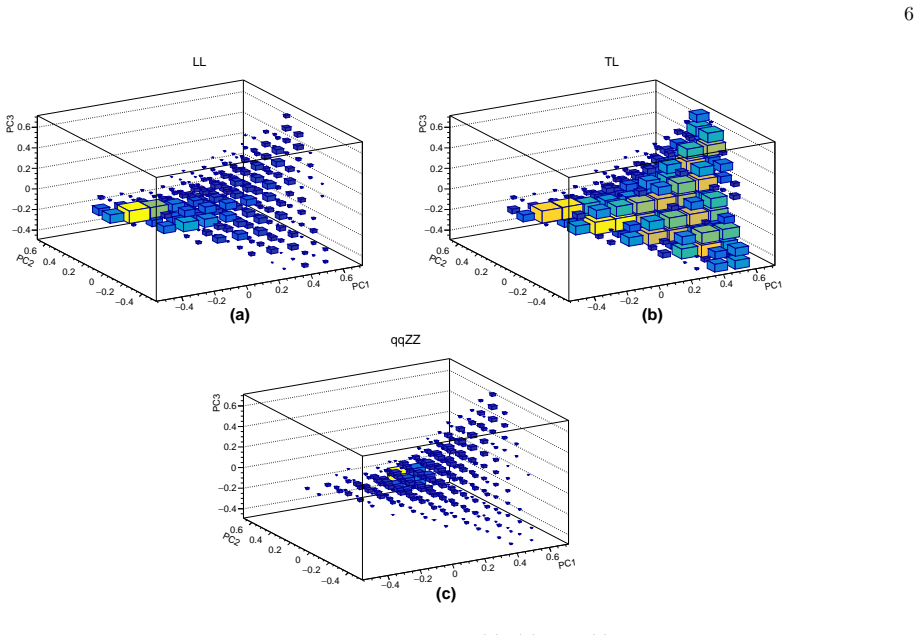
The central object is a particle-based deep neural network: each lepton and jet enters as its own small input block built from its four-momentum, the blocks are merged hierarchically, and the network ends in five output nodes scoring the classes LL, TL, TT, qqZZ, and ggZZ. Two preprocessing steps carry much of the gain: the Yeo-Johnson power transformation, which makes skewed input distributions nearly Gaussian and handles negative values, followed by standardization computed on the LL training sample. The final mechanism is PCA on the five output scores; the leading three principal components, which together explain about 96% of the variance, are fitted simultaneously in three dimensions. This multidimensional fit extracts more signal than a cut on any single discriminant because the five class scores carry correlated shape information that PCA concentrates into a few decorrelated axes.
What would settle it
Re-run the same Monte Carlo analysis with pileup included at 140 to 200 collisions per bunch crossing and compare the DNN-PCA significance with the BDT baseline; if the DNN-PCA significance drops to the BDT's 1.41 sigma or below, the claimed improvement is an artifact of the pileup-free simulation, while staying above about 1.6 sigma would confirm the central claim.
Extended reading notes
Core claim
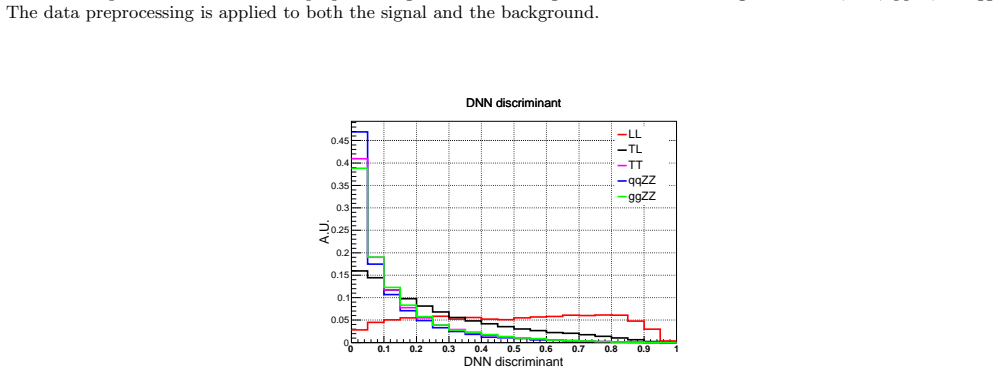
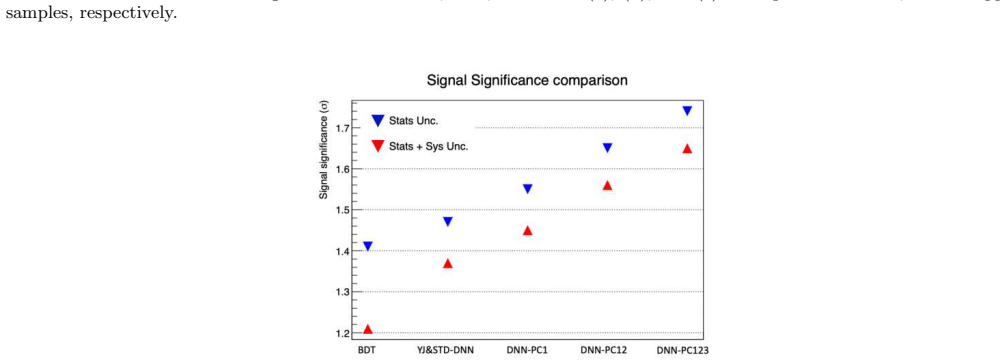
The paper's central claim is that in the fully leptonic ZZ channel, the expected significance for the LL polarization fraction at 3000 inverse femtobarns can be raised from 1.41 sigma with a two-step boosted decision tree to 1.74 sigma with a particle-based DNN whose five class outputs are decorrelated by PCA and fitted in three dimensions; including a flat 10% systematic uncertainty on signal and background, the DNN-PCA still gives 1.66 sigma. The paper compares several discriminants and finds that the particle-based DNN with a power transformation plus standardization has the best single-classifier separation. It then shows that treating the five output scores as a vector, rotating them with PCA, and fitting the leading three principal components yields more significance than either a single discriminant or a two-step DNN. The paper presents this as evidence that this machine-learning pipeline makes the longitudinal VBS measurement feasible at the HL-LHC and transferable to other helicity-fraction measurements.
Load-bearing premise
The projection relies on neglecting pileup—the detector simulation is configured for the HL-LHC but with the extra proton-proton collisions per bunch crossing turned off—so if pileup degrades lepton isolation or jet properties enough to reduce the network's separation power, the quoted 1.74-sigma significance would be optimistic.
Editorial extensions
If this is right
- At 3000 inverse femtobarns the longitudinal ZZ fraction could be extracted with an expected significance near 1.7 sigma, better than the 1.41-sigma BDT baseline.
- Combining the measurements of the two HL-LHC experiments would push the expected significance above 2 sigma, moving from sensitivity toward evidence for the longitudinal component.
- Because the pipeline uses only per-particle four-momenta and multiclass scores, the same recipe can be applied to helicity-fraction measurements in other vector-boson-scattering channels.
- Since the LL component grows strongly at high mass when Higgs or gauge couplings deviate from the standard model, the same DNN-PCA analysis could serve as a model-independent probe of Higgs couplings and anomalous gauge couplings.
Reading between the lines
- The PCA-on-outputs step suggests a general recipe for multiclass classifiers in high-energy physics: instead of thresholding one output score, keep the full score vector, decorrelate it, and fit the leading components; this can be tested on any multiclass tagger already in use.
- If pileup at the HL-LHC degrades performance, the preprocessing is the first place to re-adapt: the power transformation is fit to the LL training sample, so a pileup-contaminated sample would shift both the transformation and the PCA axes.
- A significance of 1.74 sigma still falls short of discovery; the method's real payoff may come from combining the ZZ channel with WW and WZ scattering, where the same longitudinal-fraction question has higher rates, or from using the PC distributions as inputs to a broader Higgs-coupling fit.
Signed reviews
Editorial analysis
A structured set of objections, weighed in public.
Referee Report
Summary. This paper studies the extraction of the longitudinal (LL) polarization fraction in vector-boson-scattering ZZ -> 4l events at the HL-LHC using fast simulation. The authors generate LL, TL, TT, qqZZ, and ggZZ samples with MadGraph/Pythia/Delphes, apply a VBS-like event selection, and compare a BDT, a dense DNN, and a particle-based DNN with preprocessing by standardization and Yeo-Johnson transformation, followed by principal-component analysis of the DNN outputs. They report expected significances from the Asimov formula, with the best result being 1.74 sigma (1.66 sigma with a flat 10% systematic uncertainty) at 3000 fb^-1 using a three-dimensional fit to PC1-PC3, compared with 1.41 sigma for their BDT baseline. The paper concludes that the method improves the LL sensitivity and is applicable to other helicity-fraction measurements.
Significance. If the projection is robust, the paper offers a useful, relatively simple improvement over the previous CMS BDT projection of about 1.4 sigma for a challenging measurement, and the comparison across preprocessing and model variants is informative. Its strengths are that all significance values are listed in Table I and Fig. 8, the Asimov significance procedure is standard, and the BDT baseline is explicitly validated against the CMS result. The main weaknesses are that the simulation neglects pileup, which directly affects the inputs on which the event selection and the DNN rely, and that the systematic uncertainty is an unvalidated flat 10% assumption; both make the quantitative HL-LHC projection, rather than the qualitative methodological conclusion, uncertain.
major comments (4)
- [Simulation and event selection paragraph] The simulation paragraph explicitly states that 'pileup' has been neglected as in ref. [24]. This is load-bearing for the central claim because the event selection requires at least two jets with pT > 25 GeV, |eta| < 4.7, mjj > 400 GeV, |Delta eta_jj| > 2.4, no b-tagged jets, and four isolated leptons, and the DNN consumes exactly these lepton and jet four-momenta. At the HL-LHC with 140-200 pileup interactions per bunch crossing, pileup can add jets, alter the selected jet pair, break the b-veto, and degrade lepton isolation, shifting the DNN scores and the PC templates used in the 1.74 sigma fit. Because the improvement over the BDT baseline (1.41 sigma to 1.74 sigma) is modest, even a moderate pileup-induced degradation could erase the claimed gain. Please rerun with pileup overlay, or at least with a robustness test against isolation and jet-threshold variations, or clearly restate the result as a no-pileup feasibility projection.
- [Table I and preceding text] The 'Stat. & syst.' row applies a flat 10% uncertainty to both signal and background yields, but the paper gives no derivation or validation for this value. The quoted significance with systematics is therefore not a measured property of the method but an input assumption; different correlations or uncertainties for qqZZ, ggZZ, and signal would materially change the 1.66 sigma number. The authors should justify the 10% value, test its variation (for example 5% and 20%), or present the result as statistical-only with the systematic treated as an illustrative prescription.
- [PC fit paragraph and Fig. 7] The paper reports 1.65 sigma for a PC1-PC2 fit and 1.74 sigma for a PC1-PC3 fit but does not define the test statistic, binning, or likelihood used for the Asimov calculation on multidimensional histograms. Without this information, a reader cannot reproduce the central number or assess whether the gain over using PC1 alone (1.55 sigma) is meaningful. Please specify the exact fit procedure (for example, binned Poisson likelihood, number of bins per dimension, and nuisance parametrization) and, if feasible, show the sensitivity of the significance to the binning choice.
- [Table I and Fig. 8] The final significance is selected as the maximum over several preprocessing schemes, DNN variants, and fit dimensionalities. The paper reports all variants, which is commendable, but it does not account for this post-hoc selection in the significance statement. At minimum, state that the 1.74 sigma is a post-hoc optimum and discuss the look-elsewhere effect, or pre-specify the PC3 fit as the analysis plan.
minor comments (8)
- [Title] The title contains 'd eep learning' with a spurious space; it should read 'deep learning'.
- [Abstract and throughout] The phrase 'principle component analysis' is used repeatedly; the correct statistical term is 'principal component analysis'.
- [Fig. 7] The labels in Fig. 7 are garbled: the LL panel appears twice with '(a)' and the TL panel is also labeled '(b)' twice; the intended labels should be (a) LL, (b) TL, and (c) qqZZ.
- [Fig. 1] The legend entry 'DNN ( article-based)' should be 'DNN (particle-based)'.
- [General text] There are several typos: 'Prbing' should be 'Probing', 'gaugue boson' should be 'gauge boson', and 'Comparision' should be 'Comparison'.
- [PACS line] The PACS line lists keywords ('HL-LHC, vector boson scatter, electroweak') rather than PACS codes; either provide actual PACS codes or remove the line.
- [Reference [29]] Reference [29] is a Wikipedia article; a standard textbook or review reference for principal component analysis would be more appropriate.
- [Reproducibility] The paper does not state whether the code or trained models will be made available. A data-availability statement would improve reproducibility.
Circularity Check
No significant circularity: the DNN-PCA significance is derived from independent simulated templates and an Asimov fit, with only a non-load-bearing self-citation.
full rationale
The central claim, an expected 1.74 sigma significance for the longitudinal ZZ fraction using DNN-PCA at 3000 fb^-1, is computed from Monte Carlo samples generated with MadGraph/Pythia/Delphes and an Asimov likelihood fit to principal-component templates. No target quantity is defined in terms of a fitted parameter: the LL fraction is extracted from template shapes, and the DNN itself is trained on generator-level labels and retested on held-out events, with the paper reporting that 'the loss values are comparable for the training and test samples'. The BDT baseline is reproduced internally (1.41 sigma) and matches the external CMS projection of about 1.4 sigma from ref. [15], so the comparison is anchored outside the paper's own fitted values. The particle-based DNN architecture is taken from ref. [14] by the same authors, but for this ZZ study the network is retrained, preprocessed with standardization and Yeo-Johnson transformation, and evaluated on a different final state; the prior paper is a method reference, not a logical premise of the new significance. The explicit statement that 'pileup has been neglected as in ref. [24]' is a modeling limitation that could bias the absolute projection, but it is not a circular step because the claimed significance is not defined in terms of that assumption. No equation or fitted parameter reduces by construction to an input, so no circularity is present.
Assumptions & free parameters
free parameters (3)
- Flat 10% systematic uncertainty on signal and background yields =
10%
- DNN hyperparameters and architecture =
Learning rate 0.001, Adam, ReLU, layer sizes as listed in text
- Number of principal components used in the final fit =
3
assumptions (5)
- domain assumption The MadGraph/Pythia/Delphes simulation chain correctly models ZZ vector boson scattering, its polarization decomposition, and the qqZZ and ggZZ backgrounds.
- domain assumption Delphes fast simulation is a sufficient proxy for the CMS HL-LHC detector response for the discriminants studied.
- domain assumption Neglecting pileup does not materially change the ranking or significance of the discriminants.
- domain assumption The Asimov significance with a flat 10% yield uncertainty estimates the expected measurement sensitivity.
- domain assumption The Monte Carlo samples are large enough that statistical fluctuations in training do not affect the quoted significance.
Cite this review
Pith. "Pith review of Polarization fraction measurement in ZZ scattering using deep learning." pith.science (2026). https://pith.science/paper/ADAOT3QP
@misc{pith2026190805196,
  author       = {Pith},
  title        = {Pith review of: Polarization fraction measurement in ZZ scattering using deep learning},
  year         = {2026},
  howpublished = {\url{https://pith.science/paper/ADAOT3QP}},
  note         = {Machine review of arXiv:1908.05196}
}
read the original abstract
Measuring longitudinally polarized vector boson scattering in the ZZ channel is a promising way to investigate unitarity restoration with the Higgs mechanism and to search for possible new physics. We investigated several deep neural network structures and compared their ability to improve the measurement of the longitudinal fraction Z_L Z_L. Using fast simulation with the Delphes framework, a clear improvement is found using a previously investigated 'particle-based' deep neural network on a preprocessed dataset and applying principle component analysis to the outputs.A significance of around 1.7 standard deviations can be achieved with the integrated luminosity of 3000 fb-1 that will be recorded at the High-Luminosity LHC.
Figures

Figures from the paper (5 more)


Reference graph
Works this paper leans on
-
[24]
J. Alwall et al. , JHEP 1407, 079 (2014) doi:10.1007/JHEP07(2014)079 [arXiv:1405.03 01 [hep-ph]]
-
[1]
VBS (BDT1) and then cla ssifies between LL and all backgrounds (BDT2)
The two-step BDT first classifies QCD vs. VBS (BDT1) and then cla ssifies between LL and all backgrounds (BDT2). BDT2 was trained on the events left after a selection on th e output of BDT1, which maximizes S/ √ B. We obtain a significance of 1.41 σ when only statistical uncertainties are considered, and a significan ce of 1.23 σ when a 10% uncertainty is appl...
-
[2]
Similarly to the two-step BDT, in the two-step DNN the second DNN is applied on the output of the first DNN. The first DNN structure is the previously described particle-b ased DNN, while a shallow dense NN is used as second DNN. Since there are only five output nodes on the first DNN , which represents LL, TL, TT, qqZZ, and ggZZ score, the second DNN is shal...
-
[3]
The DNN-PCA has only one particle-based DNN, the same particle- based model as was used in the first part of the two-step DNN, but with principle component analysis (PCA) implement ed on its output. The PCA algorithm rotates the original axis of the features into a new axis containing decorrela ted features. More specifically, given n-dimension target-data ...
-
[4]
A. M. Sirunyan et al. [CMS Collaboration], Phys. Rev. Lett. 120, no. 8, 081801 (2018) doi:10.1103/PhysRevLett.120.08180 1 [arXiv:1709.05822 [hep-ex]]
arXiv 2018
- [5]
-
[6]
A. M. Sirunyan et al. [CMS Collaboration], Phys. Lett. B 795, 281 (2019) doi:10.1016/j.physletb.2019.05.042 [arXiv:1901.04060 [hep-ex]]
arXiv 2019
-
[7]
The ATLAS collaboration [ATLAS Collaboration], ATLAS- CONF-2018-033
work page 2018
Show all 34 references
-
[8]
Khachatryan et al
V. Khachatryan et al. [CMS Collaboration], Phys. Lett. B 770, 380 (2017) doi:10.1016/j.physletb.2017.04.071 [arXiv:1702.03025 [hep-ex]]
2017 arXiv
-
[9]
CMS Collaboration [CMS Collaboration], CMS-PAS-SMP-1 8-007
-
[10]
ATLAS Collaboration [ATLAS Collaboration], ATLAS-CON F-2019-033
2019
-
[11]
A. M. Sirunyan et al. [CMS Collaboration], Phys. Lett. B 774, 682 (2017) doi:10.1016/j.physletb.2017.10.020 [arXiv:1708.02812 [hep-ex]]
2017 arXiv
-
[12]
Chang, K
J. Chang, K. Cheung, C. T. Lu and T. C. Yuan, Phys. Rev. D 87, 093005 (2013) doi:10.1103/PhysRevD.87.093005 [arXiv:1303.6335 [hep-ph]]
2013 arXiv
-
[13]
S. J. Lee, M. Park and Z. Qian, Phys. Rev. D 100, no. 1, 011702 (2019) doi:10.1103/PhysRevD.100.011702 [arXiv:1812.02679 [hep-ph]]
2019 arXiv
-
[14]
Quigg, Rev
C. Quigg, Rev. Accel. Sci. Tech. 10 (2019) no.01, 3 doi:10.1142/9789811209604 0002, 10.1142/S1793626819300020 [arXiv:1808.06036 [hep-ph]]
2019 arXiv
- [15]
-
[16]
CMS Collaboration [CMS Collaboration], CMS-PAS-FTR- 18-005
-
[17]
J. Lee, N. Chanon, A. Levin, J. Li, M. Lu, Q. Li and Y. Mao, P hys. Rev. D 99, no. 3, 033004 (2019) doi:10.1103/PhysRevD.99.033004 [arXiv:1812.07591 [hep -ph]]
2019 arXiv
-
[18]
CMS Collaboration [CMS Collaboration], CMS-PAS-FTR- 18-014
-
[19]
B. P. Roe, H. J. Yang, J. Zhu, Y. Liu, I. Stancu and G. McGre gor, Nucl. Instrum. Meth. A 543, no. 2-3, 577 (2005) doi:10.1016/j.nima.2004.12.018 [physics/0408124]
2005 arXiv
-
[20]
Hocker, A. et al. TMV A - Toolkit for Multivariate Data An alysis. PoS ACAT, 040 (2007)
2007
-
[21]
Chollet et al., https://github.com/fchollet/kera s
F. Chollet et al., https://github.com/fchollet/kera s
-
[22]
Software available from tensorflow.org
Mart ˜An Abadi et al., TensorFlow: Large-scale machine learning o n heterogeneous systems, 2015. Software available from tensorflow.org
2015
-
[23]
I. Yeo, R. A. Johnson, Biometrika 87, no. 4, 954-959 (2000) doi:10.1093/biomet/87.4.954
2000 doi
-
[25]
Sjostrand, L
T. Sjostrand, L. Lonnblad, S. Mrenna and P. Z. Skands, he p-ph/0308153
-
[26]
de Favereau et al
J. de Favereau et al. [DELPHES 3 Collaboration], JHEP 1402, 057 (2014) [arXiv:1307.6346 [hep-ex]]
2014 arXiv
-
[27]
Searcy, L
J. Searcy, L. Huang, M. A. Pleier and J. Zhu, Phys. Rev. D 93, no. 9, 094033 (2016) doi:10.1103/PhysRevD.93.094033 [arXiv:1510.01691 [hep-ph]]
2016 arXiv
-
[28]
K. He, X. Zhang, S. Ren and J. Sun CoRR abs/1502.01852 (2015) [arXiv:1502.01852 [cs]]
2015 arXiv
-
[29]
Kingma, D.P., and Ba, J.: 2014, arXiv e-prints , arXiv:1412.6980
2014 arXiv
-
[30]
G. E. P. Box and D. R. Cox, Journal of the Royal Statistica l Society. Series B (Methodological) 26, no. 2, 211-252 (1964)
1964
-
[31]
Cowan, The European Physical Journal C 71, no
G. Cowan, The European Physical Journal C 71, no. 2, 1554 (2011) doi:10.1140/epjc/s10052-011-1554-0
2011 doi
-
[32]
Wikipedia contributors, Principal component analysi s — Wikipedia, The Free Encyclopedia (2019) ”https://en.wikipedia.org/w/index.php?title=Principal_component_analysis&oldid=910232284”,
2019
-
[33]
Brehmer, K
J. Brehmer, K. Cranmer, G. Louppe and J. Pavez, Phys. Rev . D 98 (2018) no.5, 052004 doi:10.1103/PhysRevD.98.052004 [arXiv:1805.00020 [hep-ph]]
2018 arXiv
-
[34]
Brehmer, K
J. Brehmer, K. Cranmer, G. Louppe and J. Pavez, Phys. Rev . Lett. 121 (2018) no.11, 111801 doi:10.1103/PhysRevLett.121.111801 [arXiv:1805.00013 [hep-ph]]
2018 arXiv
Reviewed August 14, 2026 · model on record in the stance chip above.
Discussion (0). Continue with ORCID to comment.