REVIEW 3 major objections 6 minor 16 references
Sequential Computer Experimental Design for Estimating an Extreme Probability or Quantile
T0 review · 3 major / 6 minor · reviewed 2026-08-14 · deepseek-v4-flash
Pith's one-line read This paper argues that for estimating extreme tail probabilities and quantiles with a Gaussian process surrogate, the discrepancy criterion converges much faster than expected improvement and should be the preferred sequential search rule.
desk verdict A useful empirical comparison of two search criteria for extreme tail estimation that deserves refereeing, but the headline EI-vs-discrepancy claim is only as strong as the unreported EI tuning constant and a one-function comparison. read the letter →
The pith
A machine-rendered reading of the paper's core claim, the machinery that carries it, and where it could break.
The reading
What carries the argument
The load-bearing mechanism is the discrepancy criterion, which selects the next evaluation by minimizing $(\hat m_\psi(x)-y_f)^2/v_{\psi,\sigma^2}(x)$, equivalently maximizing $\Pr(Z<-|\hat m_\psi(x)-y_f|/\sqrt{v_{\psi,\sigma^2}(x)})$ with $Z\sim N(0,1)$. Unlike the expected improvement criterion, this form requires no tuning constant $\alpha$ and balances local search near the target contour with global search in regions of high predictive variance. The sequential algorithm wraps this criterion around a Bayesian Gaussian process emulator, whose predictive mean and variance are averaged over Markov chain Monte Carlo samples of the correlation parameters; quantile estimation is handled by treating the current estimated quantile as the target contour at each step.
What would settle it
Run the short column experiment with the expected-improvement criterion across a grid of alpha values covering the range suggested by Ranjan et al. (2008), report the convergence curves and final RMSE for each alpha, and check whether any alpha lets expected improvement match the discrepancy criterion's convergence within ten added runs; if so, the paper's blanket recommendation would fail.
Extended reading notes
Core claim
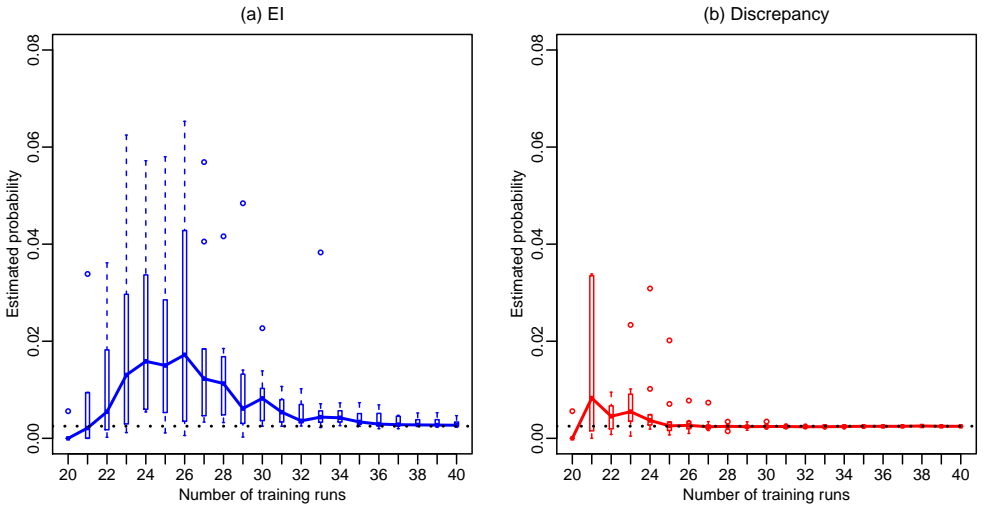
On the paper's own terms, the central discovery is that the hypothesis-testing-based discrepancy criterion is the more reliable search rule for sequential estimation of extreme tail probabilities and quantiles. For the short column function, estimates built from the discrepancy criterion effectively converge to the true failure probability of 0.0025 within roughly 11 added runs and stay there across all 10 repeated experiments, whereas expected improvement estimates still wander and require about 30 added runs to converge. The same pattern holds for quantile estimation and for a realistic eight-input floor deflection model. The paper also shows that a uniform initial design, which oversamples the tails of the input distributions, improves accuracy over a random initial design, and that stratifying the Monte Carlo and candidate sets makes the computation more efficient while preserving tail accuracy.
Load-bearing premise
The comparison between the two search criteria assumes that the expected-improvement implementation used a representative value of its tuning constant alpha; the paper never reports the alpha used in the Section 5 experiments, so if that value was atypical the discrepancy criterion's advantage could disappear.
Editorial extensions
If this is right
- Practitioners estimating extreme tail probabilities or quantiles from expensive simulations should prefer the discrepancy criterion over expected improvement, since it converged in roughly ten added runs where expected improvement needed about thirty.
- A uniform initial design that oversamples the tails of the input distribution is preferable to a purely random initial design, especially for expected improvement, because it places training points closer to the failure region.
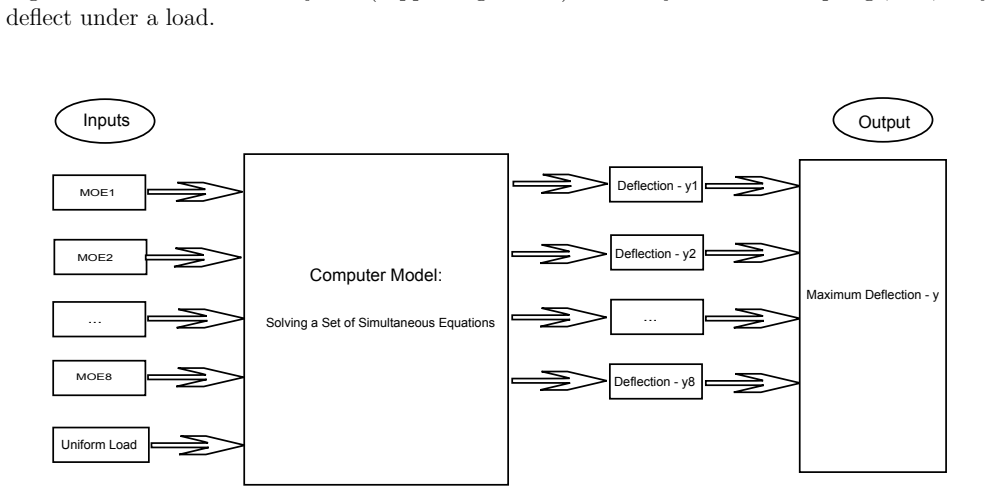
- Using a stratified Monte Carlo set with weighted stratum estimates can reduce the number of simulation points needed to resolve a tail probability or quantile, as demonstrated in the eight-input floor system example.
- Diagnostic plots of the standardized discrepancy across the Monte Carlo set can indicate whether the sequential search has converged, giving practitioners a stopping rule when the true probability or quantile is unknown.
- Bayesian estimation of Gaussian process parameters is recommended for these searches because the criteria rely on realistic predictive variances that fully account for parameter uncertainty.
Reading between the lines
- Going beyond the paper's comparisons, the reported advantage of the discrepancy criterion could depend on the value of the tuning constant $\alpha$ used in the expected improvement implementation, and the paper does not report that value; sweeping $\alpha$ over the range suggested by the contour-estimation literature would test whether the conclusion is robust.
- The discrepancy criterion could be compared against other contour-adaptive rules, such as entropy-based or integrated-risk criteria, on higher-dimensional test functions to see whether its fast convergence generalizes beyond the two examples studied here.
- The diagnostic boxplots the paper proposes could be turned into an automatic stopping rule: stop adding runs when the quantiles of the standardized discrepancy distribution stop decreasing by more than a small threshold.
- A natural extension would be to apply the same sequential recipe to estimate simultaneous tail probabilities for multiple failure modes or to optimize a design parameter while estimating the tail probability, since the discrepancy criterion naturally targets the relevant contour at each step.
Signed reviews
Editorial analysis
A structured set of objections, weighed in public.
Referee Report
Summary. The paper proposes and evaluates sequential experimental design strategies for estimating extreme tail probabilities and quantiles of a computer model output using a Gaussian process (GP) surrogate. It compares two existing search criteria, expected improvement (EI) and the hypothesis-testing-based discrepancy criterion, and uses two applications: a short-column limit-state function and an eight-dimensional floor-system computer model. The paper also addresses practical questions: choice of initial design, modeling of the input distribution, stratified construction of Monte Carlo and candidate sets, and a stopping diagnostic. The main empirical findings are that the discrepancy criterion converges much faster than EI, that uniform initial designs that over-sample input-distribution tails are preferable, and that a stratified weighting scheme based on a mixture of empirical lower-tail and upper-tail distributions works well for the floor system.
Significance. If the empirical conclusions hold, the paper provides a useful practical recommendation: the discrepancy criterion in Eq. (16) has no tuning constant, is simpler to implement than EI, and appears to reach accurate estimates with about 10 added runs where EI has not converged after 20. The study is strengthened by external verification against 10 million Monte Carlo draws for the short column and direct computer-model runs for the floor system, by the use of Bayesian uncertainty quantification for GP parameters, and by clear algorithmic descriptions. The main limitations are that the central EI-versus-discrepancy comparison rests on a single test function with only 10 repeats, and that the EI tuning parameter alpha is not reported, making the headline comparison difficult to reproduce or assess.
major comments (3)
- [Section 4.2, Eq. (12)-(13); Section 5.1] The value of the tuning constant alpha used in the EI implementation is never stated anywhere in the paper, even though Eq. (12)-(13) show that alpha directly controls the width of the improvement region and hence the balance between local search near the contour and global search driven by predictive variance. Because the headline recommendation that the discrepancy criterion converges faster than EI is based entirely on the experiments in Section 5, the comparison is not reproducible and could be an artifact of an unrepresentative alpha. The authors should report the alpha used for Figures 3-7 and Tables 1-2, and ideally include a sensitivity analysis over a range of alpha values to show that the conclusion is robust.
- [Section 5 and Section 8] The central claim that the discrepancy criterion is preferable to EI is supported by only one test function, the short-column function, with 10 repeats; the floor-system application in Section 6 applies only the discrepancy criterion, so it provides no independent replication of the comparison. Section 8 states the recommendation in general terms ('Use the discrepancy criterion'), and although the text adds 'in our study', the evidence base is narrow for a general methodological recommendation. Adding a second test problem that runs both criteria, or substantially tempering the scope of the recommendation, would make the central claim load-bearing rather than illustrative.
- [Section 7] The proposed stopping diagnostic plots, for all MC points, the standardized discrepancy -|m_hat(x)-y_f|/sqrt(v_hat(x)), which is exactly the quantity that the discrepancy search criterion optimizes when choosing the next point. A declining trend in these boxplots may therefore be a self-confirming property of the search rule rather than independent evidence that the probability or quantile estimate has converged. The paper should validate the diagnostic against the actual estimation error in a setting with a known truth, or at least explicitly acknowledge this possible circularity.
minor comments (6)
- [Section 5, Tables 1 and 2] The RMSE values in Tables 1 and 2 are based on only 10 repeats but are reported without standard errors or any other measure of variability; adding per-repeat errors or bootstrap intervals would help the reader assess whether the large reported differences are statistically stable.
- [Section 5.1] The sentence 'Further calculations, not reported here for brevity, show that the EI method requires about 30 extra points after the 20-point initial design, to converge' is not verifiable; it should either be removed or supported by a figure or table.
- [Section 6.2] The statement that the fitted 2-parameter and 3-parameter Weibull distributions are 'virtually identical' is qualitative; a numerical comparison of fitted parameters or a distance measure would be more informative.
- [Section 6.4] The 'true' 0.999 quantile for the floor system is itself an estimate with a reported standard error of 0.00701; treating 3.88 as the exact truth in Figure 10 is acceptable for plotting, but the uncertainty in this reference value should be acknowledged in the text.
- [Section 4.3] The definition of the discrepancy criterion states epsilon > 0, but the text then says 'as we work with epsilon = 0'; this should be clarified, for example by noting that the formula is extended to the boundary case epsilon = 0.
- [Figures 6 and 7] The captions describe the dotted line as 'the true quantile, 0', but the context is the lower 0.0025 quantile of a limit-state function; the caption could be more explicit about this being the lower quantile.
Circularity Check
No significant circularity: the paper's central comparison is validated against external Monte Carlo benchmarks and direct computer-model simulation, not against its own inputs.
full rationale
The paper's central claim is that the discrepancy criterion converges faster than EI for extreme probability and quantile estimation. This claim rests on empirical comparisons in Section 5 using the short column function, where the target values are established independently: the failure probability 0.0025 is obtained from 10 million Monte Carlo draws, and the quantile target is the known limit-state value 0. Section 6 similarly establishes the floor-system truth by running the computer model on ten MC sets and averaging. Neither target is defined by the search criteria being compared, so the comparison is not forced by construction. The EI and discrepancy criteria themselves are taken from the literature (Ranjan et al., 2008; Roy and Notz, 2014), and the paper explicitly contrasts them rather than equating one to the other. The self-citations to Chen et al. (2016, 2017) concern Bayesian GP parameter estimation and are methodological choices, not load-bearing definitions of the predicted quantities; moreover, the Bayesian uncertainty estimates are applied symmetrically to both criteria. The Section 7 diagnostic uses a standardized discrepancy statistic to visualize convergence, but this diagnostic is not used to define the target probability or quantile, and the convergence claims are checked against the externally established truths. The absence of a reported EI tuning parameter alpha is a reproducibility or experimental-comparison concern, not a circularity, because alpha does not appear in the definition of the target estimate. Accordingly, no step reduces by definition to its own inputs, and no fitted parameter is renamed as a prediction. The paper is self-contained relative to external benchmarks, so the circularity score is 0.
Assumptions & free parameters
free parameters (3)
- alpha (EI improvement width) =
not stated
- epsilon (discrepancy criterion constant) =
0
- stratum weights p1 and p2 in sampling distribution H(x) =
0.5, 0.5
assumptions (7)
- domain assumption The deterministic computer output y(x) is modeled as a realization of a stationary Gaussian process with power-exponential correlation (Eqs. (2)-(3)).
- domain assumption A constant mean GP is sufficient for prediction (citing Chen et al. 2016).
- domain assumption Correlation parameters are integrated over their posterior using MCMC with priors from Chen et al. (2017).
- standard math The true failure probability 0.0025 for the short column is obtained by 10 million Monte Carlo samples and treated as exact.
- domain assumption The 'true' 0.999 quantile for the floor system is estimated from 10 MC sets and treated as ground truth.
- domain assumption For the floor system, the input distribution is the empirical distribution of 580 MOE measurements, with lower-tail over-sampling corrected by stratified weights.
- domain assumption The EI and discrepancy criteria are derived assuming a normal predictive distribution with known variance, but the implementation uses Bayesian t distributions and averaged variances.
Cite this review
Pith. "Pith review of Sequential Computer Experimental Design for Estimating an Extreme Probability or Quantile." pith.science (2026). https://pith.science/paper/YH3EIYYU
@misc{pith2026190805357,
  author       = {Pith},
  title        = {Pith review of: Sequential Computer Experimental Design for Estimating an Extreme Probability or Quantile},
  year         = {2026},
  howpublished = {\url{https://pith.science/paper/YH3EIYYU}},
  note         = {Machine review of arXiv:1908.05357}
}
read the original abstract
A computer code can simulate a system's propagation of variation from random inputs to output measures of quality. Our aim here is to estimate a critical output tail probability or quantile without a large Monte Carlo experiment. Instead, we build a statistical surrogate for the input-output relationship with a modest number of evaluations and then sequentially add further runs, guided by a criterion to improve the estimate. We compare two criteria in the literature. Moreover, we investigate two practical questions: how to design the initial code runs and how to model the input distribution. Hence, we close the gap between the theory of sequential design and its application.
Figures


Figures from the paper (8 more)


Reference graph
Works this paper leans on
-
[1]
Reliability-Based Design Op- timization using Efficient Global Reliability Analysis,
Bichon, B. B., Mahadevan, S., and Eldred, M. S. (2009), “Reliability-Based Design Op- timization using Efficient Global Reliability Analysis,” Palm Springs, California, 50th AIAA/ASME/ASCE/AHS/ASC Structures, Structural Dynamics, and Materials Conference, pp. 1–12
work page 2009
-
[2]
Sulla determinazione empirica delle leggi di probabilita,
Cantelli, F. P. (1933), “Sulla determinazione empirica delle leggi di probabilita,” Giorn. Ist. Ital. Attuari, 4, 221–424
work page 1933
-
[3]
Analysis Methods for Computer Experiments: How to Assess and What Counts?
Chen, H., Loeppky, J. L., Sacks, J., Welch, W. J., et al. (2016), “Analysis Methods for Computer Experiments: How to Assess and What Counts?” Statistical Science, 31, 40–60
work page 2016
-
[4]
Chen, H., Loeppky, J. L., and Welch, W. J. (2017), “Flexible Correlation Structure for Accu- rate Prediction and Uncertainty Quantification in Bayesian Gaussian Process Emulation of a Computer Model,” SIAM/ASA Journal on Uncertainty Quantification , 5, 598–620
work page 2017
-
[5]
Sulla determinazione empirica della legge di probabilita,
Glivenko, V. (1933), “Sulla determinazione empirica della legge di probabilita,” Giorn. Ist. Ital. Attuari, 4, 92–99
work page 1933
-
[6]
A Bayesian Analysis of Kriging,
Handcock, M. S. and Stein, M. L. (1993), “A Bayesian Analysis of Kriging,” Technometrics, 35, 403–410
work page 1993
-
[7]
Efficient global optimization of expensive black-box functions,
Jones, D. R., Schonlau, M., and Welch, W. J. (1998), “Efficient global optimization of expensive black-box functions,” Journal of Global optimization , 13, 455–492
work page 1998
-
[8]
Two Basic Problems in Reliability-Based Structural Opti- mization,
Kuschel, N. and Rackwitz, R. (1997), “Two Basic Problems in Reliability-Based Structural Opti- mization,” Mathematical Methods of Operation Research, 46, 309–333
work page 1997
Show all 16 references
-
[9]
Using Artificial Censoring to Improve Extreme Tail Quantile Estimates,
Liu, Y., Salib´ an-Barrera, M., Zamar, R. H., and Zidek, J. V. (2018), “Using Artificial Censoring to Improve Extreme Tail Quantile Estimates,” Applied Statistics, 67, 791–812
2018
-
[10]
Deflections of Uniformly Loaded Floors: A Beam-Spring Analog,
McCutcheon, W. J. (1984), “Deflections of Uniformly Loaded Floors: A Beam-Spring Analog,” Tech. Rep. Research Paper FPL449, United States Department of Agriculture, Madison, WI
1984
-
[11]
A Comparison of Three Methods for Selecting Values of Input Variables in the Analysis of Output from a Computer Code,
McKay, M., Beckman, R., and Conover, W. (1979),“A Comparison of Three Methods for Selecting Values of Input Variables in the Analysis of Output from a Computer Code,” Technometrics, 21, 239–245
1979
-
[12]
Sequential Experimental Design for Contour Estimation from Complex Computer Codes,
Ranjan, P., Bingham, D., and Michailidis, G. (2008),“Sequential Experimental Design for Contour Estimation from Complex Computer Codes,” Technometrics, 50, 527–541. 27
2008
-
[13]
Estimating percentiles in computer experiments: A comparison of sequential-adaptive designs and fixed designs,
Roy, S. and Notz, W. I. (2014), “Estimating percentiles in computer experiments: A comparison of sequential-adaptive designs and fixed designs,” Journal of Statistical Theory and Practice , 8, 12–29
2014
-
[14]
Design and Analysis of Computer Experiments,
Sacks, J., Welch, W., Mitchell, T., and Wynn, H. (1989), “Design and Analysis of Computer Experiments,” Statistical Science, 4, 409–435
1989
-
[15]
(2003), The Design and Analysis of Computer Experi- ments, Springer Series in Statistics, Springer Press
Santner, T., Williams, B., and Notz, W. (2003), The Design and Analysis of Computer Experi- ments, Springer Series in Statistics, Springer Press
2003
-
[16]
Screening the Input Variables to a Computer Model Via Analysis of Variance and Visualization,
Schonlau, M. and Welch, W. J. (2006), “Screening the Input Variables to a Computer Model Via Analysis of Variance and Visualization,” in Screening: Methods for Experimentation in
2006
Reviewed August 14, 2026 · model on record in the stance chip above.
Discussion (0). Continue with ORCID to comment.