REVIEW 3 major objections 5 minor 24 references
Maximum Relevance and Minimum Redundancy Feature Selection Methods for a Marketing Machine Learning Platform
T0 review · 3 major / 5 minor · reviewed 2026-08-14 · deepseek-v4-flash
Pith's one-line read This paper shows that a simple mRMR variant, FCQ, is the most practical feature-selection method for marketing classification, and that model-based variants win only when the downstream model is Random Forest.
desk verdict Useful industrial case study of mRMR feature selection; the FCQ robustness claim is plausible but under-supported by the real-data results without error bars. read the letter →
The pith
A machine-rendered reading of the paper's core claim, the machinery that carries it, and where it could break.
The reading
What carries the argument
The machinery is the mRMR scoring step: at each greedy selection round, a candidate feature $X_i$ is scored by relevance to the label $Y$ minus or divided by its average redundancy with the already-selected set $S$. The production-recommended form is FCQ, $$f_{FCQ}(X_i)=\frac{F(Y,X_i)}{\frac{1}{|S|}\sum_{X_s\in S}\rho(X_s,X_i)},$$ where $F$ is the one-way ANOVA F-statistic and $\rho$ is Pearson correlation. Two extensions change the inputs: FRQ replaces $\rho$ with the randomized dependence coefficient (RDC), a copula-based nonlinear association measure; RFCQ and RFRQ replace $F$ with Random-Forest Gini importance, either keeping Pearson correlation (RFCQ) or RDC (RFRQ). The quotient form is load-bearing because relevance and redundancy have different units and scales, so a difference form either lets one term dominate or requires careful normalization. The entire method is a greedy filter: independent of the downstream classifier, so it can be computed once and reused, and its per-step statistics are cheap enough to implement at production scale.
What would settle it
A concrete test: take a marketing dataset in which the useful features are connected to the label mainly through nonlinear transformations while redundancy among features is also nonlinear. If a method like FRQ or RFRQ, which uses the RDC nonlinear dependence measure, consistently beats FCQ by a large AUC margin across several such datasets, the paper's claim that FCQ is the robust production default would fail to generalize. A second check is to rerun the reported online experiment with two additional arms—models built from RFCQ-selected features and from all features—and compare incremental adoption; the current experiment lacks those arms.
Extended reading notes
Core claim
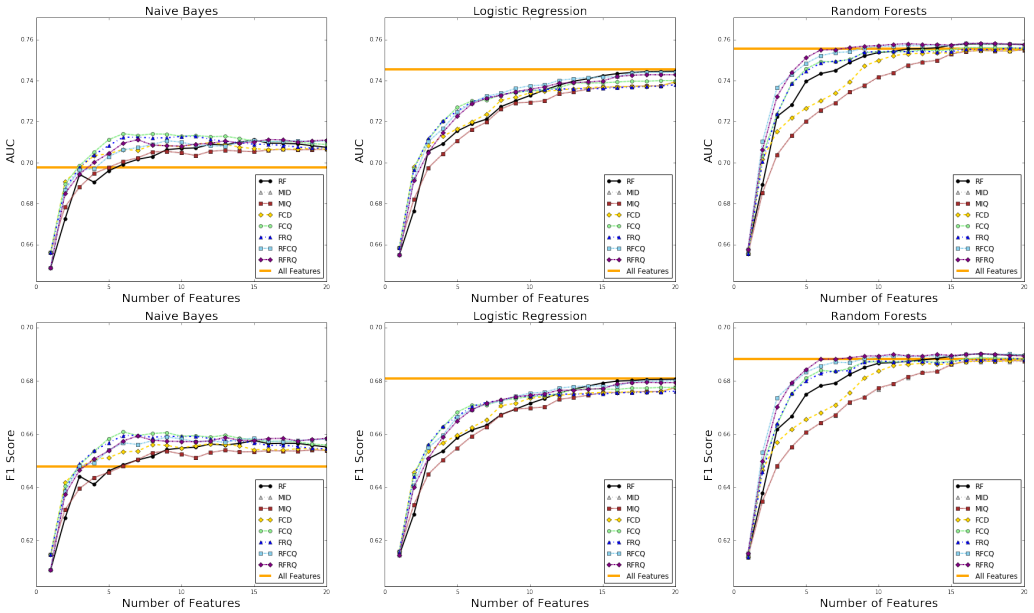
The paper's discovery is that, for marketing classification problems with many redundant features, the balance between relevance and redundancy matters more than the sophistication of either measure. In head-to-head comparison, mutual-information-based mRMR variants (MID, MIQ) perform poorly because of the difficulty of estimating feature distributions, and the difference-scheme FCD suffers from mismatched scales between its F-statistic and correlation terms. The quotient scheme in FCQ—relevance divided by average redundancy—avoids the scale problem, and its reliance on univariate F-statistics and Pearson correlations makes it fast enough for production. The model-based extensions are the right tool when the final classifier is a Random Forest: RFCQ and RFRQ reach good AUC with fewer selected features than plain Random-Forest importance ranking, because they remove redundant features the tree would otherwise double-count. The paper claims these conclusions hold across its synthetic data and the three real marketing datasets, and that the production implementation with FCQ delivers the expected accuracy, scaling, and interpretation benefits.
Load-bearing premise
The load-bearing assumption is that the three real marketing datasets used for offline comparison—cross-sell, up-sell, and app cross-sell—represent the full range of classification problems the automated platform serves, so the observed ranking of feature selectors will carry over to future campaigns; the single online experiment does not compare FCQ against alternative feature-selection methods.
Editorial extensions
If this is right
- Automated marketing platforms can safely default to a univariate F-statistic plus average-correlation score for feature selection, avoiding expensive mutual-information estimation.
- When the downstream model is a tree ensemble, using tree importance in the mRMR quotient (RFCQ or RFRQ) yields the best accuracy and the smallest feature sets, at the cost of extra computation.
- Feature selection improves model quality mainly through redundancy removal and overfitting prevention, visible when Naive Bayes or Logistic Regression with all features underperforms the same model on 10 to 30 selected features.
- The selected feature sets are less correlated with each other, which improves model interpretability and diagnosis compared with plain importance ranking.
Reading between the lines
- Editorial inference: because FCQ depends only on univariate F-statistics and pairwise Pearson correlations, it can be computed in a single distributed pass over the data; this makes it an attractive baseline in any large-scale automated machine-learning pipeline, not just marketing.
- Editorial inference: the RFCQ result suggests a self-reinforcing loop—train a quick Random Forest to obtain importances, select features, retrain—which should be compared against end-to-end embedded selection such as L1-regularized logistic regression; the paper does not include that baseline.
- Editorial inference: the extension recipe is modular, so one could plug in gradient-boosting importances or other nonlinear dependence measures without changing the greedy selection; the authors point toward this but do not test it.
Signed reviews
Editorial analysis
A structured set of objections, weighed in public.
Referee Report
Summary. The paper studies feature selection for classification problems in Uber's marketing machine learning platform. It proposes two extensions to the minimum Redundancy Maximum Relevance (mRMR) framework: using the randomized dependence coefficient (RDC) as a nonlinear redundancy measure, giving the FRQ method (Eq. 8), and using random-forest feature importance as the relevance measure, giving the RFCQ and RFRQ methods (Eqs. 9-10). The paper then evaluates seven mRMR variants plus RF importance and an all-features baseline on one synthetic dataset and three real Uber marketing datasets, using Naive Bayes, logistic regression, and random forests as downstream classifiers and reporting AUC, F1 (for synthetic data), and computation time. Based on the evaluation, FCQ is selected for production implementation in a Scala/Spark pipeline, and an online experiment for a cross-sell model is described.
Significance. The paper's applied contribution is valuable: the proposed variants are defined explicitly in Eqs. (8)-(10), the synthetic study includes a 100-trial comparison relative to RF-based selection, and the production implementation in Section V gives unusual detail about how feature selection is embedded in an AutoML pipeline. If the performance claims are supported, FCQ would be a practical default choice for marketing classification models. The main weakness is empirical: the real-data evidence for the central conclusion of FCQ's robustness lacks uncertainty quantification. The paper does not ship proofs or reproducible code, but its explicit method definitions and the breadth of the evaluation make it a useful case study for practitioners, provided the claims are tightened.
major comments (3)
- [Section IV.A (Step 5) and Table V] The real-data results are reported only as AUC values averaged over the four cross-validation folds, with no standard deviations, confidence intervals, or paired comparisons. Several discriminating comparisons are extremely small; for example, in Dataset 3 with Logistic Regression at 30 features, FCQ reaches 0.812 but at least four other methods also reach 0.812, and in Dataset 1 with Random Forest at 30 features, FCQ is 0.715 while RFCQ and RF are 0.725 and 0.727, respectively. With only four folds, the standard error of an averaged AUC is typically on the order of 10^-3 or larger, so the observed ordering of methods within a column can be fold-dependent. The conclusion in Section VI that FCQ shows "robust performance for different classification models" is therefore not empirically pinned down by the real-data evidence; please add measures of uncertainty and paired tests, or substantially weaken the claim.
- [Section V.D] The online experiment demonstrates that a model trained with FCQ-selected features identifies high-propensity users and generates incremental adoption relative to an untargeted baseline, but it does not compare FCQ with any alternative feature selection method. As presented, this experiment is evidence of business impact for the deployed model, not evidence that FCQ is superior to other selectors; the text should say so explicitly.
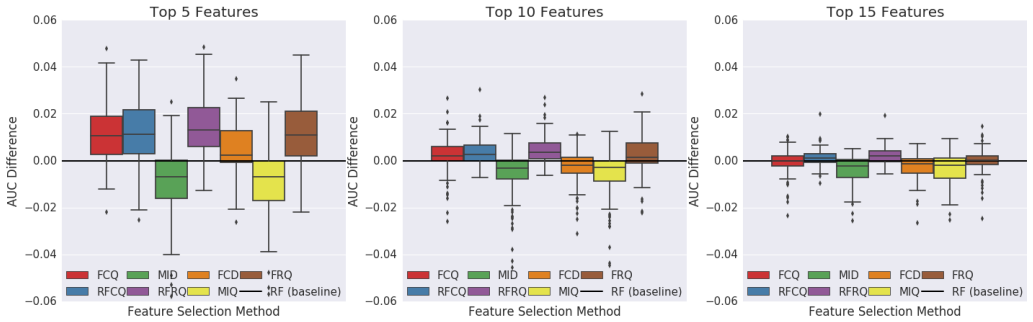
- [Figure 4 and Section IV.A] The only repeated-trial statistical comparison, the 100-trial synthetic study, uses the Random Forest classifier exclusively. Since the central robustness claim concerns multiple downstream model families, the repeated-trial evidence should either include Naive Bayes and Logistic Regression, or the conclusion should be restricted to tree-based models.
minor comments (5)
- [Eq. (11)] The displayed formula appears to have an unmatched parenthesis; the expression for the logistic probability is missing a closing parenthesis.
- [Table IV] The "Number of Users" column appears to render "105" and "106" where superscripts 10^5 and 10^6 are intended; please use proper superscript formatting.
- [Section IV.C] The text states that F1-score patterns for the real data are consistent with AUC patterns, but no real-data F1 results are shown; including a summary or plot would make this statement checkable.
- [Section II.A / Eq. (8)] The RDC implementation is not fully specified: the number of random projections, the choice of nonlinear features, and any regularization parameters would be needed to reproduce the FRQ and RFRQ results.
- [Table III] The computation-time results are reported as single numbers without stating whether they are one-off measurements or averages, and without specifying the compute environment; a brief methodology sentence would help.
Circularity Check
No circularity: mRMR variants are defined by explicit formulas and evaluated on held-out test folds; the RF-relevance/RF-classifier overlap is disclosed and is not a load-bearing reduction.
full rationale
The paper makes no attempt to derive a prediction from fitted inputs. Every proposed method is defined by an explicit equation (Eqs. 4-10), and the evaluation uses standard held-out procedures: for real data, 4-fold cross-validation is used and feature selection is rerun inside each training fold (Section IV.A, Steps 1-5); performance is reported as test-set AUC/F1 of downstream classifiers. FCQ, the method selected for production, is model-free: its relevance term is the F-statistic and its redundancy term is Pearson correlation (Eq. 7), neither of which is fitted to the evaluation metric or to the downstream classifier. The only overlap is that RFCQ/RFRQ use random-forest feature importance while random forest is one of the three downstream classifiers; the paper explicitly acknowledges this as a 'natural advantage of the RF feature selection method' (Section IV.B) and still evaluates FCQ's performance outside that setting. That is a disclosed experimental bias, not a circular derivation. There are no load-bearing self-citations, no imported uniqueness theorems, and no renamed known result presented as a new derivation. The online experiment (Section V.D) demonstrates business impact of the deployed model but does not compare FCQ against alternative selectors; this limits generalization but is a completeness/evidence issue, not circularity.
Assumptions & free parameters
assumptions (3)
- domain assumption The synthetic data generation, using a logistic model on 10 latent covariates transformed by random splines, approximates real marketing conversion data.
- domain assumption The three downstream classifiers (Naive Bayes, Logistic Regression, Random Forest) cover the model families used in the Uber marketing platform.
- domain assumption The implementations of mutual information and the randomized dependence coefficient (RDC) are numerically accurate enough to support the reported rankings.
Cite this review
Pith. "Pith review of Maximum Relevance and Minimum Redundancy Feature Selection Methods for a Marketing Machine Learning Platform." pith.science (2026). https://pith.science/paper/ZZDL2QSS
@misc{pith2026190805376,
  author       = {Pith},
  title        = {Pith review of: Maximum Relevance and Minimum Redundancy Feature Selection Methods for a Marketing Machine Learning Platform},
  year         = {2026},
  howpublished = {\url{https://pith.science/paper/ZZDL2QSS}},
  note         = {Machine review of arXiv:1908.05376}
}
read the original abstract
In machine learning applications for online product offerings and marketing strategies, there are often hundreds or thousands of features available to build such models. Feature selection is one essential method in such applications for multiple objectives: improving the prediction accuracy by eliminating irrelevant features, accelerating the model training and prediction speed, reducing the monitoring and maintenance workload for feature data pipeline, and providing better model interpretation and diagnosis capability. However, selecting an optimal feature subset from a large feature space is considered as an NP-complete problem. The mRMR (Minimum Redundancy and Maximum Relevance) feature selection framework solves this problem by selecting the relevant features while controlling for the redundancy within the selected features. This paper describes the approach to extend, evaluate, and implement the mRMR feature selection methods for classification problem in a marketing machine learning platform at Uber that automates creation and deployment of targeting and personalization models at scale. This study first extends the existing mRMR methods by introducing a non-linear feature redundancy measure and a model-based feature relevance measure. Then an extensive empirical evaluation is performed for eight different feature selection methods, using one synthetic dataset and three real-world marketing datasets at Uber to cover different use cases. Based on the empirical results, the selected mRMR method is implemented in production for the marketing machine learning platform. A description of the production implementation is provided and an online experiment deployed through the platform is discussed.
Figures


Figures from the paper (3 more)


Reference graph
Works this paper leans on
-
[1]
Katsov, Introduction to Algorithmic Marketing: Artificial Intelligence for Marketing Operations
I. Katsov, Introduction to Algorithmic Marketing: Artificial Intelligence for Marketing Operations . Ilia Katcov, 2017
work page 2017
-
[2]
A review of feature selection methods on synthetic data,
V . Bol ´on-Canedo, N. S ´anchez-Maro˜no, and A. Alonso-Betanzos, “A review of feature selection methods on synthetic data,” Knowledge and information systems, vol. 34, no. 3, pp. 483–519, 2013
work page 2013
-
[3]
A survey on feature selection methods,
G. Chandrashekar and F. Sahin, “A survey on feature selection methods,” Computers & Electrical Engineering , vol. 40, no. 1, pp. 16–28, 2014
2014
-
[4]
Feature selection for classification: A review,
J. Tang, S. Alelyani, and H. Liu, “Feature selection for classification: A review,”Data classification: algorithms and applications , p. 37, 2014
work page 2014
-
[5]
The best two independent measurements are not the two best,
T. M. Cover, “The best two independent measurements are not the two best,” IEEE Transactions on Systems, Man, and Cybernetics , no. 1, pp. 116–117, 1974
work page 1974
-
[6]
H. Peng, F. Long, and C. Ding, “Feature selection based on mu- tual information: criteria of max-dependency, max-relevance, and min- redundancy,” IEEE Transactions on Pattern Analysis & Machine Intel- ligence, no. 8, pp. 1226–1238, 2005
work page 2005
-
[7]
Normalized mutual information feature selection,
P. A. Est ´evez, M. Tesmer, C. A. Perez, and J. M. Zurada, “Normalized mutual information feature selection,” IEEE Transactions on Neural Networks, vol. 20, no. 2, pp. 189–201, 2009
work page 2009
-
[8]
N. D. Thang, Y .-K. Lee et al. , “An improved maximum relevance and minimum redundancy feature selection algorithm based on normalized mutual information,” in 2010 10th IEEE/IPSJ International Symposium on Applications and the Internet . IEEE, 2010, pp. 395–398
work page 2010
Show all 24 references
-
[9]
Conditional likelihood maximisation: a unifying framework for information theoretic feature selection,
G. Brown, A. Pocock, M.-J. Zhao, and M. Luj ´an, “Conditional likelihood maximisation: a unifying framework for information theoretic feature selection,” Journal of machine learning research , vol. 13, no. Jan, pp. 27–66, 2012
2012
-
[10]
Fast-mrmr: Fast minimum redundancy maximum relevance algorithm for high- dimensional big data,
S. Ram ´ırez-Gallego, I. Lastra, D. Mart ´ınez-Rego, V . Bol´on-Canedo, J. M. Ben ´ıtez, F. Herrera, and A. Alonso-Betanzos, “Fast-mrmr: Fast minimum redundancy maximum relevance algorithm for high- dimensional big data,” International Journal of Intelligent Systems , vol. 32,...
2017
-
[11]
Minimum redundancy feature selection from microarray gene expression data,
C. Ding and H. Peng, “Minimum redundancy feature selection from microarray gene expression data,” Journal of bioinformatics and com- putational biology, vol. 3, no. 02, pp. 185–205, 2005
2005
-
[12]
A new maximum relevance- minimum multicollinearity (mrmmc) method for feature selection and ranking,
A. Senawi, H.-L. Wei, and S. A. Billings, “A new maximum relevance- minimum multicollinearity (mrmmc) method for feature selection and ranking,” Pattern Recognition, vol. 67, pp. 47–61, 2017
2017
-
[13]
Random forests,
L. Breiman, “Random forests,” Machine learning , vol. 45, no. 1, pp. 5–32, 2001
2001
-
[14]
Churn prediction in telecom using random forest and pso based data balancing in combination with vari- ous feature selection strategies,
A. Idris, M. Rizwan, and A. Khan, “Churn prediction in telecom using random forest and pso based data balancing in combination with vari- ous feature selection strategies,” Computers & Electrical Engineering , vol. 38, no. 6, pp. 1808–1819, 2012
2012
-
[15]
The randomized de- pendence coefficient,
D. Lopez-Paz, P. Hennig, and B. Sch ¨olkopf, “The randomized de- pendence coefficient,” in Advances in neural information processing systems, 2013, pp. 1–9
2013
-
[16]
Stochastic gradient boosting,
J. H. Friedman, “Stochastic gradient boosting,” Computational statistics & data analysis , vol. 38, no. 4, pp. 367–378, 2002
2002
-
[17]
Xgboost: A scalable tree boosting system,
T. Chen and C. Guestrin, “Xgboost: A scalable tree boosting system,” in Proceedings of the 22nd acm sigkdd international conference on knowledge discovery and data mining . ACM, 2016, pp. 785–794
2016
-
[18]
A comparison of random forest and its gini importance with standard chemometric methods for the fea- ture selection and classification of spectral data,
B. H. Menze, B. M. Kelm, R. Masuch, U. Himmelreich, P. Bachert, W. Petrich, and F. A. Hamprecht, “A comparison of random forest and its gini importance with standard chemometric methods for the fea- ture selection and classification of spectral data,” BMC bioinformatics , vol. ...
2009
-
[19]
Evaluation: from precision, recall and f-measure to roc, informedness, markedness and correlation,
D. M. Powers, “Evaluation: from precision, recall and f-measure to roc, informedness, markedness and correlation,” 2011
2011
-
[20]
An empirical study of the naive bayes classifier,
I. Rish et al., “An empirical study of the naive bayes classifier,” in IJCAI 2001 workshop on empirical methods in artificial intelligence , vol. 3, no. 22, 2001, pp. 41–46
2001
-
[21]
D. W. Hosmer Jr, S. Lemeshow, and R. X. Sturdivant, Applied logistic regression. John Wiley & Sons, 2013, vol. 398
2013
-
[22]
A study of cross-validation and bootstrap for accuracy estimation and model selection,
R. Kohavi et al., “A study of cross-validation and bootstrap for accuracy estimation and model selection,” in Ijcai, vol. 14, no. 2. Montreal, Canada, 1995, pp. 1137–1145
1995
-
[23]
Smoothing by spline functions,
C. H. Reinsch, “Smoothing by spline functions,” Numerische mathe- matik, vol. 10, no. 3, pp. 177–183, 1967
1967
-
[24]
Scikit-learn: Machine learning in Python,
F. Pedregosa, G. Varoquaux, A. Gramfort, V . Michel, B. Thirion, O. Grisel, M. Blondel, P. Prettenhofer, R. Weiss, V . Dubourg, J. Vander- plas, A. Passos, D. Cournapeau, M. Brucher, M. Perrot, and E. Duch- esnay, “Scikit-learn: Machine learning in Python,” Journal of Machine ...
2011
Reviewed August 14, 2026 · model on record in the stance chip above.
Discussion (0). Continue with ORCID to comment.