REVIEW 4 major objections 5 minor 40 references
Are Quantitative Features of Lung Nodules Reproducible at Different CT Acquisition and Reconstruction Parameters?
T0 review · 4 major / 5 minor · reviewed 2026-08-14 · deepseek-v4-flash
Pith's one-line read Slice thickness splits CT feature reproducibility: thin slices preserve volume, thick slices stabilize texture, so no single protocol maximizes both.
desk verdict A labor-intensive CT reconstruction grid produces a plausible thickness trade-off, but the paper's signature percentages rest on p>0.05-as-equivalence and 65 million uncorrected tests. read the letter →
The pith
A machine-rendered reading of the paper's core claim, the machinery that carries it, and where it could break.
The reading
What carries the argument
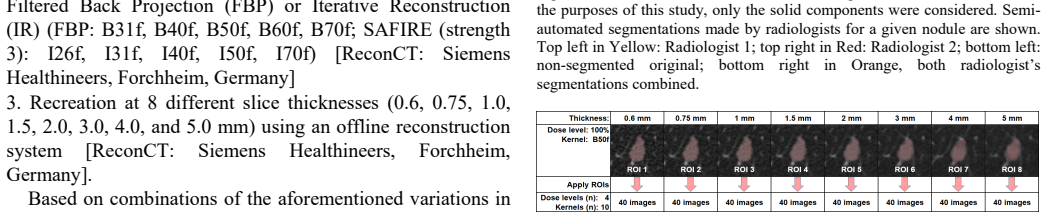
The analysis is carried by a compatibility map. Raw CT data from each nodule were re-reconstructed into 320 conditions (4 doses × 10 kernels × 8 thicknesses); reference regions of interest were segmented once on 100%-dose B50f images at each thickness and then applied to the other 40 dose–kernel combinations at that same thickness. For every pair of reconstruction conditions, a two-tailed $t$-test compared each of 28 image features (histogram, GLCM, RLM, NGLDM, and NGTDM families), and a pair was called compatible when the test gave $t<1.96$ ($p<0.05$). A compatibility ratio (Equation 3) then aggregated these pairwise labels over the 28 features and 23 patients, producing the maps and tables from which the opposing thickness trends are read.
What would settle it
Recompute the compatibility ratios on the same reconstructed images using a paired comparison that accounts for the repeated measurement of the same 23 nodules and that adjusts for the enormous number of tests being run. If texture features no longer show higher compatibility at thick slices, or if volumetric reproducibility no longer falls as thickness increases, the central trade-off claim fails. A physical phantom with known dimensions and densities, reconstructed through the same 320-condition grid, would separate true measurement error from segmentation variability.
Extended reading notes
Core claim
The paper's central claim is that slice thickness is the dominant driver of quantitative-feature reproducibility in chest CT, and that it moves volume and texture reproducibility in opposite directions. Across 320 acquisition/reconstruction combinations (4 dose levels × 10 kernels × 8 thicknesses) applied to 23 nodules, volumetric reproducibility was best at 2 mm and degraded as slices thickened; 5-mm slices gave the lowest volumes, on average about 4% below the nodule's average volume. Histogram- and texture-based features, by contrast, became more reproducible at thicker slices: the highest average compatibility (24.47% of feature-patient pairs) occurred at 5 mm with the smoothest kernel at 100% dose, and the lowest (2.65%) at 0.6 mm with the sharpest kernel at 12.5% dose. The authors conclude that no universal parameter set keeps both volume and texture reproducible, so multi-study comparability requires balanced standardization of acquisition parameters.
Load-bearing premise
The whole argument depends on equating 'no statistically significant difference at the $p<0.05$ level in a two-tailed $t$-test' with 'reproducible,' even though the study performs tens of millions of such tests on measurements taken from the same 23 nodules; if that standard is too permissive, the compatibility percentages and the opposing thickness trends they produce are not a calibrated measure of real reproducibility.
Editorial extensions
If this is right
- Serial measurements of the same nodule should keep slice thickness constant, because changing thickness is the strongest single disruptor of histogram- and texture-based feature compatibility.
- If a protocol change is unavoidable, change only one parameter—dose, kernel, or thickness—and keep the change minimal; multiple simultaneous parameter changes produce the lowest compatibility.
- For volumetric endpoints, thickness near 2 mm is the most reproducible setting, while increasing thickness biases volumes downward (5-mm slices averaged about 4% below the average volume).
- A multi-site radiomics study needs a priori protocol harmonization rather than post hoc correction, because compatibility is very limited even across reconstructions of the same raw data.
Reading between the lines
- If the trade-off generalizes to other scanner families and nodule types, radiomics models trained on heterogeneous clinical CT data carry a hidden confound: site-to-site differences in feature behavior may reflect slice-thickness-dependent reproducibility rather than tumor biology, so slice thickness should be a stratification or adjustment variable.
- The paper's 'change only one parameter' advice predicts a directly testable pattern: pairs of reconstruction conditions that differ in exactly one parameter should show systematically higher compatibility ratios than pairs that differ in two or three parameters; that comparison can be quantified from the compatibility map.
- A phantom-based rerun of the same 320-condition grid would separate scanner-physics effects from segmentation effects, since the reference ROIs themselves were defined at one dose–kernel setting and may carry some of the observed variability.
Signed reviews
Editorial analysis
A structured set of objections, weighed in public.
Referee Report
Summary. The manuscript reports a retrospective study of 23 lung nodules whose raw CT data were reconstructed under 320 combinations of radiation dose (4 levels), reconstruction kernel (10), and slice thickness (8). Volumes were measured from 100%-dose/B50f reference segmentations, and 28 histogram- and texture-based features were computed for each of the 320 reconstructions. The authors define two reconstruction conditions as 'compatible' for a feature if an unpaired two-tailed t-test fails to reject equality at the p<0.05 level, and they summarize compatibility averaged over 28 features and 23 patients. Their main claims are that volumetric reproducibility decreases with increasing slice thickness, while radiomic feature reproducibility improves with increasing thickness, and that no single universal CT protocol can simultaneously maximize volumetric and radiomic reproducibility. The paper therefore recommends balanced standardization of acquisition parameters.
Significance. If the quantitative claims are valid, the paper would provide a practically useful map of how common CT protocol variations affect lung-nodule volumetry and radiomics, with direct implications for multi-site study design. The main strengths are the carefully controlled reconstruction grid applied to the same 23 lesions and the direct presentation of raw volume trends in Fig. 5. The paper ships no code or machine-checked proofs, and the statistical framework used to quantify 'compatibility' is not reliable. The qualitative direction of the thickness effect is plausible, but the headline percentages and compatibility maps, which carry the central conclusion, are not currently supported.
major comments (4)
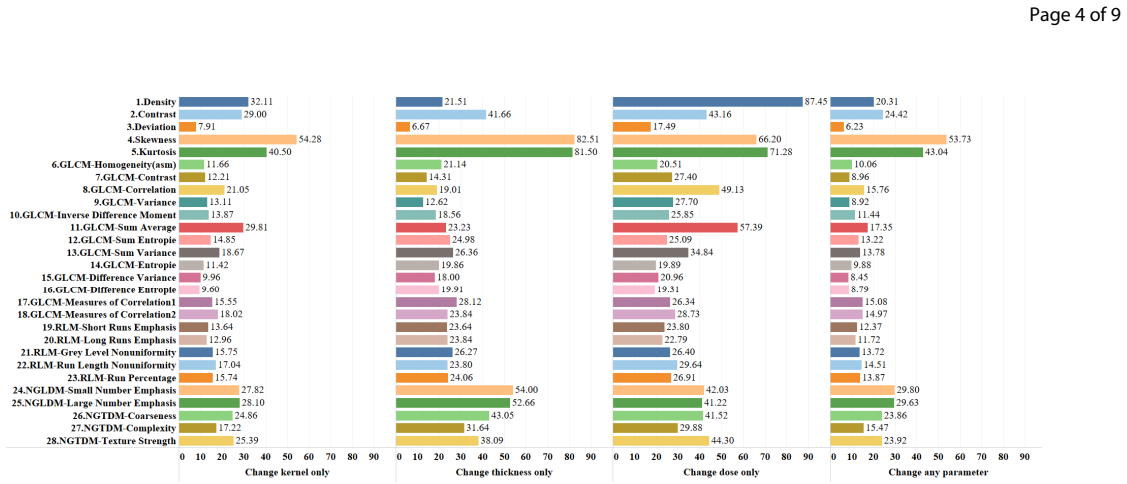
- [II.E, Eq. (3)] The compatibility ratio is defined using the t-test criterion from Eq. (2), but failing to reject equality (p>0.05) is not evidence of reproducibility. With n=23, the test has low power, so a large but highly variable shift can be labeled compatible while a small consistent shift can be labeled incompatible. The reported percentages (e.g., 24.47% best average, 87.45% density under dose changes, 2.65% worst average) are therefore uncalibrated as measures of reproducibility. The analysis should be replaced with an equivalence test using a pre-specified margin (e.g., TOST), or with per-feature effect sizes and confidence intervals.
- [II.C and II.E, Eq. (2)] The t-test is applied as an unpaired two-sample test to measurements taken on the same 23 nodules. Because all reconstruction conditions are applied to the same lesions, the data are paired; ignoring this structure changes the standard errors and p-values. This affects the volumetric compatibility matrix in Fig. 6 and every radiomic compatibility result in Figs. 4, 7, 8, 9, and 10. A paired test or a mixed-effects model is needed for valid inference.
- [III.B] The manuscript reports 65,945,600 (320×320×28×23) hypothesis tests at an uncorrected alpha of 0.05, with no multiple-comparison correction and with highly correlated feature families. Even if the individual tests were valid, the expected number of false positives is enormous, and the reported compatibility percentages are not interpretable as probabilities of reproducibility. The authors should either correct for multiplicity or reframe the analysis as an estimation problem with effect-size summaries rather than significance thresholds.
- [Abstract and Discussion] The central claim that 'as thickness increases, volumetric reproducibility decreases, while reproducibility of histogram- and texture-based features ... improves' is quantitatively supported only by the flawed compatibility percentages. The volumetric direction is additionally supported by the raw means and standard deviations in Fig. 5, but the radiomic direction has no such independent support. A reanalysis with equivalence margins may confirm the qualitative direction, but the specific numbers in the abstract and Results should be revised to reflect the corrected analysis.
minor comments (5)
- [II.C and II.E] The text states 'If t<1.96 (P<0.05)' but the intended condition is |t|<1.96, which corresponds to p>0.05, i.e., failure to reject equality. Please correct the wording and use p-values consistently.
- [II.C, Eq. (2)] Equation (2) is missing from the rendered manuscript; only the variables m1, m2, s1, s2, n1, n2 are defined. Equation (3) is also garbled by the rendering and should be rewritten with an explicit denominator (presumably 28×23).
- [II.D and Table I] Section II.D says NGTDM has 3 features, while the abstract says 2 and Table I lists 3 (Coarseness, Complexity, Texture Strength). Please reconcile the counts.
- [Fig. 4] The compatibility map is difficult to read because the color legend and axis ordering are not fully labeled in the figure as reproduced. Please provide an explicit legend and clarify that the diagonal reflects the average over 28 features and 23 patients.
- [Discussion] The recommendations in the Discussion are derived by data-mining the same 23 cases without external validation. The authors should explicitly label these as exploratory hypotheses rather than validated guidelines.
Circularity Check
No circularity: conclusions are empirical summaries of measured compatibility ratios, not predictions forced by construction or self-citation.
full rationale
This paper is an empirical measurement study, not a derivation of predictions from theoretical assumptions. The authors reconstruct 320 acquisition/reconstruction conditions from raw CT data, segment nodules, extract volume and radiomic features, and then summarize reproducibility through t-test-based compatibility ratios. There is no fitted parameter that is later relabeled as a prediction, no self-citation used as load-bearing support (the references are external prior studies), and no uniqueness theorem or ansatz imported from the authors' own prior work. The only definitional step is the operationalization of 'compatible' as t < 1.96, which is a statistical criterion for claiming no significant difference; this is a measurement definition, not a circular reduction. The central claim that slice thickness is the main factor and that volumetric and radiomic reproducibility trade off is a direct empirical summary of the computed compatibility percentages across the 23 nodules. Concerns about the absence of an equivalence margin, the unpaired t-test on paired data, the lack of multiple-comparison correction, and the small single-vendor sample are validity and generalizability limitations, not circularity. The paper also acknowledges these limitations explicitly. Therefore the derivation chain is self-contained and no circularity is present.
Assumptions & free parameters
assumptions (5)
- domain assumption Simulated dose reductions (12.5%, 25%, 50% of protocol dose) accurately represent true low-dose acquisitions.
- domain assumption Reference ROIs segmented on 100%-dose/B50f thickness-specific stacks can be applied unchanged to all other dose and kernel combinations at the same thickness.
- ad hoc to paper The t-test with threshold t<1.96 defines 'compatibility' without correction for 65,945,600 comparisons and without using paired-sample structure.
- domain assumption Texture features as implemented in MeVisLab (Table I) are appropriate and comparable across reconstructions without explicit preprocessing or binning standardization.
- domain assumption Findings from 23 nodules on Siemens scanners generalize to other patient populations and scanner vendors.
Cite this review
Pith. "Pith review of Are Quantitative Features of Lung Nodules Reproducible at Different CT Acquisition and Reconstruction Parameters?." pith.science (2026). https://pith.science/paper/WTTBJK2K
@misc{pith2026190805667,
  author       = {Pith},
  title        = {Pith review of: Are Quantitative Features of Lung Nodules Reproducible at Different CT Acquisition and Reconstruction Parameters?},
  year         = {2026},
  howpublished = {\url{https://pith.science/paper/WTTBJK2K}},
  note         = {Machine review of arXiv:1908.05667}
}
read the original abstract
Consistency and duplicability in Computed Tomography (CT) output is essential to quantitative imaging for lung cancer detection and monitoring. This study of CT-detected lung nodules investigated the reproducibility of volume-, density-, and texture-based features (outcome variables) over routine ranges of radiation-dose, reconstruction kernel, and slice thickness. CT raw data of 23 nodules were reconstructed using 320 acquisition/reconstruction conditions (combinations of 4 doses, 10 kernels, and 8 thicknesses). Scans at 12.5%, 25%, and 50% of protocol dose were simulated; reduced-dose and full-dose data were reconstructed using conventional filtered back-projection and iterative-reconstruction kernels at a range of thicknesses (0.6-5.0 mm). Full-dose/B50f kernel reconstructions underwent expert segmentation for reference Region-Of-Interest (ROI) and nodule volume per thickness; each ROI was applied to 40 corresponding images (combinations of 4 doses and 10 kernels). Typical texture analysis metrics (including 5 histogram features, 13 Gray Level Co-occurrence Matrix, 5 Run Length Matrix, 2 Neighboring Gray-Level Dependence Matrix, and 2 Neighborhood Gray-Tone Difference Matrix) were computed per ROI. Reconstruction conditions resulting in no significant change in volume, density, or texture metrics were identified as "compatible pairs" for a given outcome variable. Our results indicate that as thickness increases, volumetric reproducibility decreases, while reproducibility of histogram- and texture-based features across different acquisition and reconstruction parameters improves. In order to achieve concomitant reproducibility of volumetric and radiomic results across studies, balanced standardization of the imaging acquisition parameters is required.
Figures


Figures from the paper (7 more)




Reference graph
Works this paper leans on
-
[1]
Recommendations for measuring pulmonary nodules at CT: A statement from the Fleischner Society,
A. A. Bankier, H. MacMahon, J. M. Goo, G. D. Rubin, C. M. Schaefer-Prokop, and D. P. Naidich, “Recommendations for measuring pulmonary nodules at CT: A statement from the Fleischner Society,” Radiology, vol. 285, no. 2, pp. 584–600, 2017
work page 2017
-
[2]
M. A. Heuvelmans, J. E. Walter, R. Vliegenthart, P. M. A. van Ooijen, G. H. De Bock, H. J. De Koning et al., “Disagreement of diameter and volume measurements for pulmonary nodule size estimation in CT lung cancer screening,” Thorax, vol. 73, no. 8, pp. 779–781, 2018
work page 2018
-
[3]
Decoding tumour phenotype by noninvasive imaging using a quantitative radiomics approach,
H. J. W. L. Aerts, E. R. Ve lazquez, R. T. H. Leijenaar, C. Parmar, P. Grossmann, S. Carvalho et al., “Decoding tumour phenotype by noninvasive imaging using a quantitative radiomics approach,” Nat. Commun., vol. 5, p. 4006, 2014
work page 2014
-
[4]
Radiomics: Images are more than pictures, they are data,
R. J. Gillies, P. E. K inahan, and H. Hricak, “Radiomics: Images are more than pictures, they are data,” Radiology, vol. 278, no. 2, pp. 563–577, 2015
work page 2015
-
[5]
Reproducibility of radiomics for deciphering tumor phenotype with imaging,
B. Zhao, Y. Tan, W.-Y. Tsai, J. Qi, C. Xie, L. Lu et al., “Reproducibility of radiomics for deciphering tumor phenotype with imaging,” Sci. Rep., vol. 6, p. 23428, 2016
work page 2016
-
[6]
K. Buch, B. Li, M. M. Qureshi, H. Kuno, S. W. Anderson, and O. Sakai, “Quantitative assessment of variation in CT parameters on texture features: Pilot study using a nonanatomic phantom,” Am. J. Neuroradiol., vol. 38, no. 5, pp. 981–985, 2017
work page 2017
-
[7]
P. Lo, S. Young, H. J. Kim, M. S. Brown, and M. F. McNitt-Gray, “Variability in CT lung-nodule quantification: Effects of dose reduction and reconstruction methods on density and texture based features,” Med. Phys., vol. 43, no. 8Part1, pp. 4854– 4865, 2016
work page 2016
-
[8]
Evaluating iterative reconstruction performance in computed tomography,
B. Chen, J. C. Ramirez Gi raldo, J. Solomon, and E. Samei, “Evaluating iterative reconstruction performance in computed tomography,” Med. Phys., vol. 41, no. 12, p. 121913, 2014
work page 2014
Show all 40 references
-
[9]
Using texture analysis to determine human papillomavirus status of oropharyngeal squamous cell carcinomas on CT,
K. Buch, A. Fujita, B . Li, Y. Kawashima, M. M. Qureshi, and O. Sakai, “Using texture analysis to determine human papillomavirus status of oropharyngeal squamous cell carcinomas on CT,” Am. J. Neuroradiol., vol. 36, no. 7, pp. 1343–1348, 2015
2015
-
[10]
Preliminary investigation into sources of uncertainty in quantitative imaging features,
X. Fave, M. Cook, A. Frederick, L. Zhang, J. Yang, D. Fried et al., “Preliminary investigation into sources of uncertainty in quantitative imaging features,” Comput. Med. Imaging Graph., vol. 44, pp. 54–61, 2015
2015
-
[11]
Prognostic value and reproducibility of pretreatment CT texture features in stage III non-small cell lung cancer,
D. V Fried, S. L. Tucker, S. Zhou, Z. Liao, O. Mawlawi, G. Ibbott et al., “Prognostic value and reproducibility of pretreatment CT texture features in stage III non-small cell lung cancer,” Int. J. Radiat. Oncol. Biol. Phys., vol. 90, no. 4, pp. 834–842, 2014
2014
-
[12]
Quantifying tumour heterogeneity with CT,
B. Ganeshan and K. A. Miles, “Quantifying tumour heterogeneity with CT,” Cancer Imaging, vol. 13, no. 1, pp. 140–149, 2013. [13] K. A. Miles, B. Ganeshan , M. R. Griffiths, R. C. D. Young, and C. R. Chatwin, “Colorectal cancer: Texture analysis of portal phase hepatic CT image...
2013
-
[14]
Lung nodule and cancer detection in computed tomography screening,
G. D. Rubin, “Lung nodule and cancer detection in computed tomography screening,” J. Thorac. Imaging, vol. 30, no. 2, pp. 130–138, 2015
2015
-
[15]
Detection of pulmonary nodules by multislice computed tomography: Improved detection rate with reduced slice thickness,
F. Fischbach, F. Knollmann, V. Griesshaber, T. Freund, E. Akkol, and R. Felix, “Detection of pulmonary nodules by multislice computed tomography: Improved detection rate with reduced slice thickness,” Eur. Radiol., vol. 13, no. 10, pp. 2378–2383, 2003
2003
-
[16]
Influence of slice thickness on diagnoses of pulmonary nodules using low-dose CT: Potential dependence of detection and diagnostic agreement on features and location of nodule,
M. Sinsuat, S. Saita, Y. Kawata, N. Niki, H. Ohmatsu, T. Tsuchida et al., “Influence of slice thickness on diagnoses of pulmonary nodules using low-dose CT: Potential dependence of detection and diagnostic agreement on features and location of nodule,” Acad. Radiol., vol. 18, ...
2011
-
[17]
ACR-STR practice parameter for the performance and reporting of lung cancer screening thoracic computed Page 7 of 9 tomography (CT): 2014 (Resolution 4),
E. A. Kazerooni, J. H. Austin, W . C. Black, D. S. Dyer, T. R. Hazelton, A. N. Leung et al., “ACR-STR practice parameter for the performance and reporting of lung cancer screening thoracic computed Page 7 of 9 tomography (CT): 2014 (Resolution 4),” J. Thorac. Imaging, vol. 29,...
2014
-
[18]
The national lung screening trial: Overview and study design,
C. A. Gatsonis, D. R. Aberle, C. D. Berg, W. C. Black, T. R. Church, R. M. Fagerstrom et al., “The national lung screening trial: Overview and study design,” Radiology, vol. 258, no. 1, pp. 243–253, 2011
2011
-
[19]
The Lung Image Database Consortium (LIDC): A comparison of different size metrics for pulmonary nodule measurements,
A. P. Reeves, A. M. Bian cardi, T. V Apanasovich, C. R. Meyer, H. MacMahon, E. J. R. van Beek et al., “The Lung Image Database Consortium (LIDC): A comparison of different size metrics for pulmonary nodule measurements,” Acad. Radiol., vol. 14, no. 12, pp. 1475–1485, 2007
2007
-
[20]
Variability in CT lung-nodule volumetry: Effects of dose reduction and reconstruction methods,
S. Young, H. J. G. Kim, M. M. Ko, W. W. Ko, C. Flores, and M. F. McNitt-Gray, “Variability in CT lung-nodule volumetry: Effects of dose reduction and reconstruction methods,” Med. Phys., vol. 42, no. 5, pp. 2679–2689, 2015
2015
-
[21]
New guidelines to evaluate the response to treatment in solid tumors,
P. Therasse, S. G. Arbuck, E. A. Eisenhauer, J. Wanders, R. S. Kaplan, L. Rubinstein et al., “New guidelines to evaluate the response to treatment in solid tumors,” J. Natl. Cancer Inst., vol. 92, no. 3, pp. 205–216, 2000
2000
-
[22]
Comparison of 1D, 2D, and 3D nodule sizing methods by radiologists for spherical and complex nodules on thoracic CT phantom images,
N. Petrick, H. J. G. Kim , D. Clunie, K. Borradaile, R. Ford, R. Zeng et al., “Comparison of 1D, 2D, and 3D nodule sizing methods by radiologists for spherical and complex nodules on thoracic CT phantom images,” Acad. Radiol., vol. 21, no. 1, pp. 30–40, 2014
2014
-
[23]
Fast automated segmentation and reproducible volumetry of pulmonary metastases in CT-scans for therapy monitoring,
J.-M. Kuhnigk, V. Dicken, L. Bornemann, D. Wormanns, S. Krass, and H.-O. Peitgen, “Fast automated segmentation and reproducible volumetry of pulmonary metastases in CT-scans for therapy monitoring,” in International Conference on Medical Image Computing and Computer-Assisted I...
2004
-
[24]
Inherent variability of CT lung nodule measurements in vivo using semiautomated volumetric measurements,
L. R. Goodman, M. Gulsun, L. Washington, P. G. Nagy, and K. L. Piacsek, “Inherent variability of CT lung nodule measurements in vivo using semiautomated volumetric measurements,” Am. J. Roentgenol., vol. 186, no. 4, pp. 989–994, 2006
2006
-
[25]
Software volumetric evaluation of doubling times for differentiating benign versus malignant pulmonary nodules,
M.-P. Revel, A. Merlin, S. Peyrard, R. Triki, S. Couchon, G. Chatellier et al., “Software volumetric evaluation of doubling times for differentiating benign versus malignant pulmonary nodules,” Am. J. Roentgenol., vol. 187, no. 1, pp. 135–142, 2006
2006
-
[26]
On measuring the change in size of pulmonary nodules,
A. P. Reeves, A. B. Chan, D. F. Yankelevitz, C. I. Henschke, B. Kressler, and W. J. Kostis, “On measuring the change in size of pulmonary nodules,” IEEE Trans. Med. Imaging, vol. 25, no. 4, pp. 435– 450, 2006
2006
-
[27]
Exploring intra-and inter-reader variability in uni-dimensional, bi-dimensional, and volumetric measurements of solid tumors on CT scans reconstructed at different slice intervals,
B. Zhao, Y. Tan, D. J. Bell, S. E. Marley, P. Guo, H. Mann et al., “Exploring intra-and inter-reader variability in uni-dimensional, bi-dimensional, and volumetric measurements of solid tumors on CT scans reconstructed at different slice intervals,” Eur. J. Radiol., vol. 82, n...
2013
-
[28]
Noncalcified lung nodules: Volumetric assessment with thoracic CT,
M. A. Gavrielides, L. M. Kinnard, K. J. Myers, and N. Petrick, “Noncalcified lung nodules: Volumetric assessment with thoracic CT,” Ra diology, vol. 251, no. 1, pp. 26–37, 2009
2009
-
[29]
Precision of iodine quantification in hepatic CT: Effects of iterative reconstruction with various imaging parameters,
B. Chen, D. Marin, S. Richard, D. Husarik, R. Nelson, and E. Samei, “Precision of iodine quantification in hepatic CT: Effects of iterative reconstruction with various imaging parameters,” Am. J. Roentgenol., vol. 200, no. 5, pp. W475–W482, 2013
2013
-
[30]
Assessment of volumetric noise and resolution performance for linear and nonlinear CT reconstruction methods,
B. Chen, O. Christianson, J. M. Wilson, and E. Samei, “Assessment of volumetric noise and resolution performance for linear and nonlinear CT reconstruction methods,” Med. Phys., vol. 41, no. 7, p. 71909, 2014
2014
-
[31]
Volumetric quantification of lung nodules in CT with iterative reconstruction (ASiR and MBIR),
B. Chen, H. Barnhart, S. Richard, M. Robins, J. Colsher, and E. Samei, “Volumetric quantification of lung nodules in CT with iterative reconstruction (ASiR and MBIR),” Med. Phys., vol. 40, no. 11, p. 111902, 2013
2013
-
[32]
High quality machine-robust image features: Identification in nonsmall cell lung cancer computed tomography images,
L. A. Hunter, S. Krafft, F. Stingo, H. Choi, M. K. Martel, S. F. Kry et al., “High quality machine-robust image features: Identification in nonsmall cell lung cancer computed tomography images,” Med. Phys., Page 8 of 9 vol. 40, no. 12, p. 121916, 2013
2013
-
[33]
Measuring computed tomography scanner variability of radiomics features,
D. Mackin, X. Fave, L. Zhang, D. Fried, J. Yang, B. Taylor et al., “Measuring computed tomography scanner variability of radiomics features,” Invest. Radiol., vol. 50, no. 11, pp. 757–765, 2015
2015
-
[34]
Can radiomics features be reproducibly measured from CBCT images for patients with non- small cell lung cancer?,
X. Fave, D. Mackin, J. Yang, J. Zhang, D. Fried, P. Balter et al., “Can radiomics features be reproducibly measured from CBCT images for patients with non- small cell lung cancer?,” Med. Phys., vol. 42, no. 12, pp. 6784–6797, 2015
2015
-
[35]
Quantitative radiomics: Impact of stochastic effects on textural feature analysis implies the need for standards,
M. J. Nyflot, F. Yang, D. Byrd, S. R. Bowen, G. A. Sandison, and P. E. Kinahan, “Quantitative radiomics: Impact of stochastic effects on textural feature analysis implies the need for standards,” J. Med. Imaging, vol. 2, no. 4, p. 41002, 2015
2015
-
[36]
Iterative reconstruction methods in X-ray CT,
M. Beister, D. Kolditz, and W. A. Kalender, “Iterative reconstruction methods in X-ray CT,” Phys. Medica, vol. 28, no. 2, pp. 94–108, 2012
2012
-
[37]
A three-dimensional statistical approach to improved image quality for multislice helical CT,
J.-B. Thibault, K. D. Sauer, C. A. Bouman, and J. Hsieh, “A three-dimensional statistical approach to improved image quality for multislice helical CT,” Med. Phys., vol. 34, no. 11, pp. 4526–4544, 2007
2007
-
[38]
Solomon, A
J. Solomon, A. Mileto, J . C. Ramirez-Giraldo, and E. Samei, “Diagnostic performance of an advanced modeled iterative reconstruction algorithm for low- contrast detectability with a third-generation dual- source multidetector CT scanner: Potential for radiation dose reduction ...
2015
-
[39]
Abdominal CT with model-based iterative reconstruction (MBIR): Initial results of a prospective trial comparing ultralow-dose with standard-dose imaging,
P. J. Pickhardt, M. G. Lu bner, D. H. Kim, J. Tang, J. A. Ruma, A. M. del Rio et al., “Abdominal CT with model-based iterative reconstruction (MBIR): Initial results of a prospective trial comparing ultralow-dose with standard-dose imaging,” Am. J. Roentgenol., vol. 199, no. 6...
2012
-
[40]
Performance of iterative image reconstruction in CT of the paranasal sinuses: A phantom study,
B. Schulz, M. Beeres, B . Bodelle, R. Bauer, F. Al- Butmeh, A. Thalhammer et al., “Performance of iterative image reconstruction in CT of the paranasal sinuses: A phantom study,” Am. J. Neuroradiol., vol. 34, no. 5, pp. 1072–1076, 2013
2013
-
[41]
Exploring variability in CT characterization of tumors: A preliminary phantom study,
B. Zhao, Y. Tan, W. Y. Tsa i, L. H. Schwartz, and L. Lu, “Exploring variability in CT characterization of tumors: A preliminary phantom study,” Transl. Oncol., vol. 7, no. 1, pp. 88–93, 2014. Page 9 of 9
2014
Reviewed August 14, 2026 · model on record in the stance chip above.
Discussion (0). Continue with ORCID to comment.