REVIEW 4 major objections 5 minor 41 references
Optimizing phonon scattering by tuning surface-interdiffusion-driven intermixing to break the random-alloy limit of thermal conductivity
T0 review · 4 major / 5 minor · reviewed 2026-08-14 · deepseek-v4-flash
Pith's one-line read Partial intermixing at superlattice interfaces can lower thermal conductivity below both the abrupt-interface value and the random-alloy limit, with an optimal roughness for thick spacers.
desk verdict Solid NEMD study with a genuinely new qualitative prediction—optimal interface roughness that beats the random-alloy limit—but the admitted use of a non-converged cross-section weakens the quantitative claims. read the letter →
The pith
A machine-rendered reading of the paper's core claim, the machinery that carries it, and where it could break.
The reading
What carries the argument
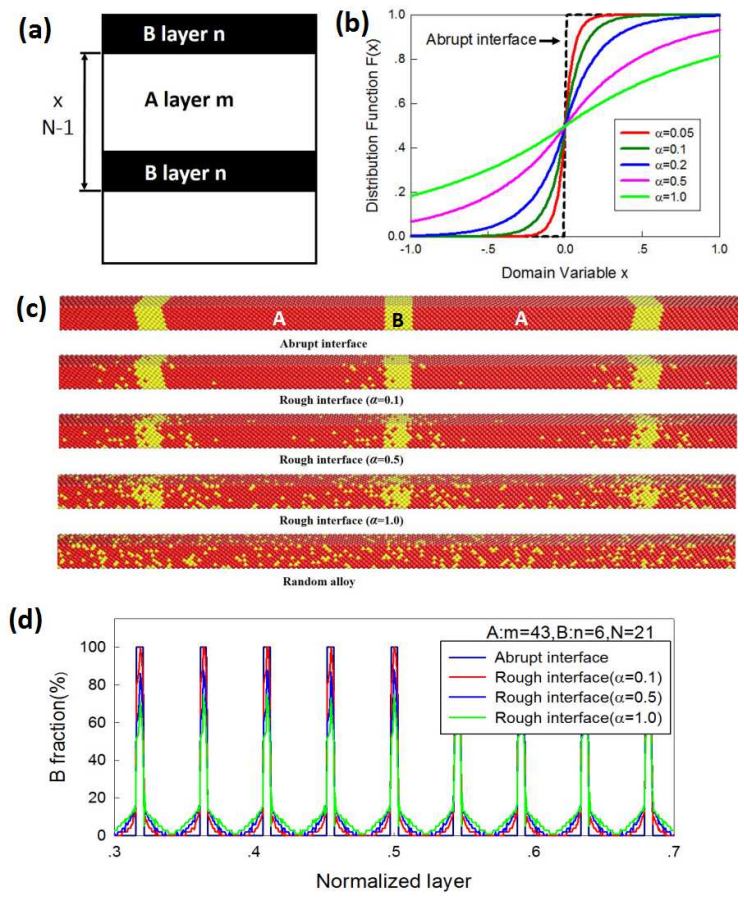
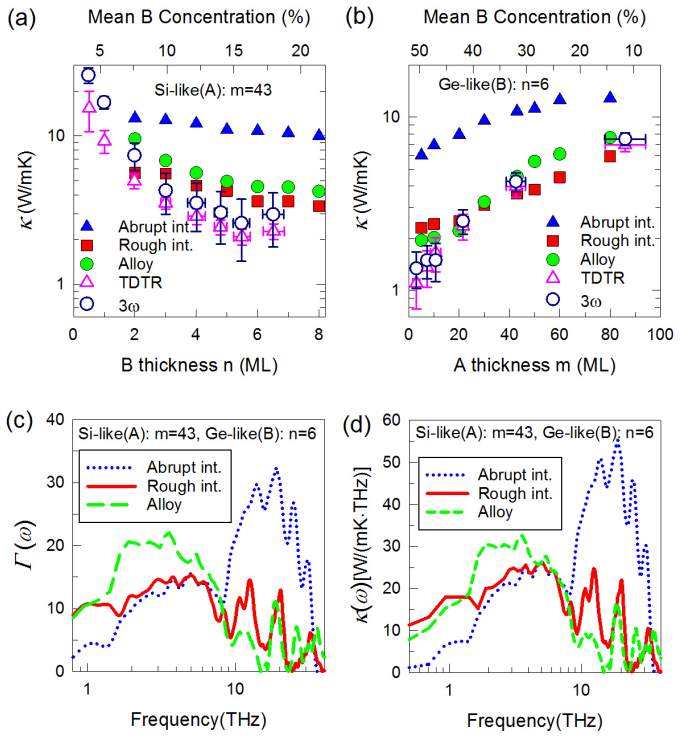
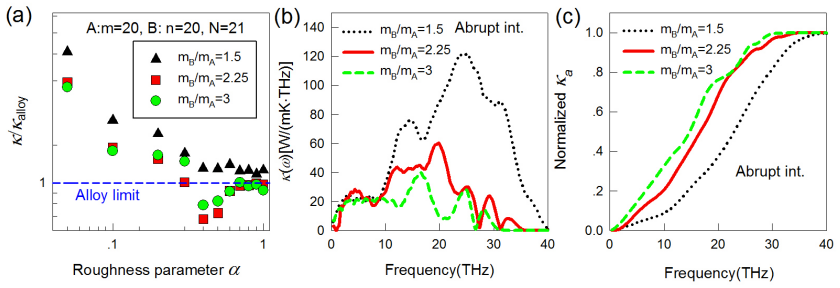
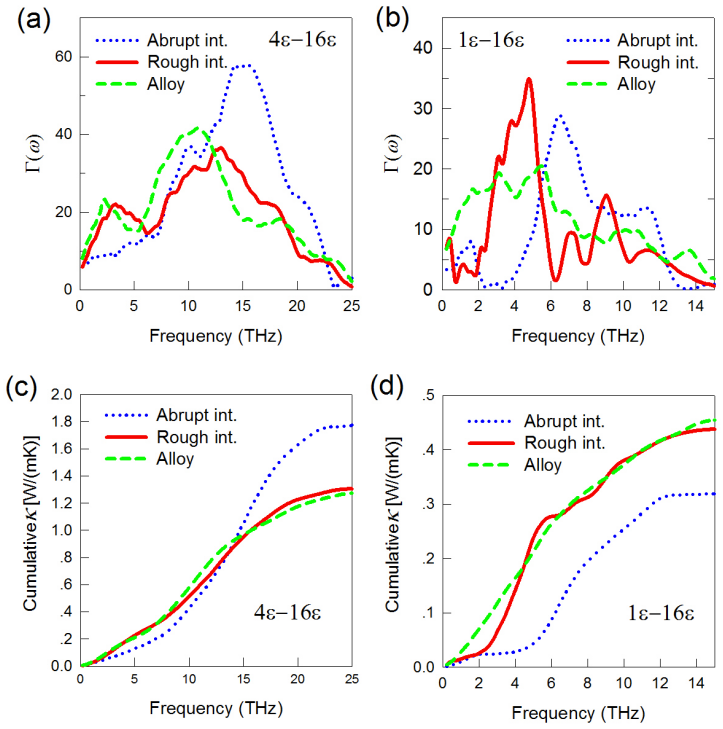
The load-bearing machinery is a tunable model of an intermixed interface: a Laplace (double-exponential) concentration profile with scale parameter alpha, which continuously interpolates a superlattice from perfectly abrupt interfaces (alpha approaching 0) through rough interfaces to a totally intermixed random alloy. Atomic species are assigned randomly according to this profile in a binary Lennard-Jones crystal, with mass and bond-strength ratios spanning realistic material pairs. Spectral heat currents computed from non-equilibrium molecular dynamics resolve which phonon frequencies each scattering mechanism removes: interface scattering suppresses low-to-mid frequency transmission, alloy scattering suppresses high-frequency transmission, and the crossover between the two regimes explains why an optimal roughness exists for long-period samples.
What would settle it
Measure the cross-plane thermal conductivity of annealed SiGe superlattices with thick Si spacers as a function of annealing-driven intermixing: the central claim would be falsified if kappa decreases monotonically with intermixing and never drops below the alloy limit, or if no optimal intermediate roughness appears.
Extended reading notes
Core claim
On its own terms, the central claim is that surface-interdiffusion-driven intermixing can make superlattice thermal conductivity lower than the corresponding random-alloy limit, provided the light-material spacer layer is thick enough (roughly 30 unit cells in the model). For large-period superlattices, the conductivity as a function of interface roughness is non-monotonic, with an optimal intermediate roughness that minimizes kappa; for short periods, kappa decreases monotonically and approaches the alloy limit from above. The same simulations show that intermixing is most effective below the alloy limit for large mass mismatch, while for large bond-strength (lattice) mismatch, an ideally abrupt interface can already give kappa well below the alloy limit. These are stated as general trends for Lennard-Jones model systems that mimic Si/Ge, AlAs/GaAs, and Bi2Te3/Sb2Te3.
Load-bearing premise
The load-bearing premise is that a single Lennard-Jones potential with solid-argon parameters, differing only in atomic mass and bond strength, captures the phonon physics that governs real superlattices such as Si/Ge well enough for the qualitative trends to transfer.
Editorial extensions
If this is right
- For large-period superlattices, controlling interdiffusion to an intermediate amount gives the lowest thermal conductivity; both sharper and more intermixed interfaces conduct more heat.
- Intermixing is a more powerful lever for materials with large mass mismatch, where high-frequency phonons already carry little heat and interface scattering dominates.
- For large lattice mismatch, perfectly abrupt interfaces may already beat the alloy limit, so growth optimization should target sharpness rather than intermixing.
- The dominance of harmonic, temperature-independent scattering in the model implies the low-thermal-conductivity effect should persist over a broad temperature range, not just at cryogenic temperatures.
Reading between the lines
- A clear testable consequence the authors leave implicit: in annealed SiGe superlattices, kappa should first fall and then rise as annealing time increases for thick spacers, tracing the predicted optimal-roughness minimum.
- The same two-channel scattering picture suggests a design rule for other nanostructures: pair a strong low-frequency scatterer (interfaces) with a strong high-frequency scatterer (alloy disorder) to cover the phonon spectrum.
- Because the quantitative results rest on a single Lennard-Jones potential, quantitative transfer to real materials would require checking whether strain, anharmonicity, or three-phonon processes shift the optimal roughness; the qualitative non-monotonicity may survive but the optimum value likely will not.
- The Laplace-profile model could be extended to graded or asymmetric intermixing, where the optimal profile may be non-symmetric and further lower kappa.
Signed reviews
Editorial analysis
A structured set of objections, weighed in public.
Referee Report
Summary. The paper uses non-equilibrium molecular dynamics (NEMD) combined with spectral heat current calculations to study the cross-plane thermal conductivity of binary Lennard-Jones superlattices as the interface roughness, modeled by a Laplace distribution of species mixing, increases from perfectly abrupt to completely intermixed. The authors compare these conductivities with those of random alloys of the same composition and report that rough superlattices can fall below the alloy limit when the light-mass 'spacer' layer is thick enough, that a non-monotonic dependence with an optimal roughness appears for large-period superlattices, and that the effect is stronger with larger mass mismatch and specific bond-strength ratios. They interpret the results through spectral transmission functions and cumulative conductivity, and they compare selected results with experimental Si/Ge superlattice data at 300 K.
Significance. If the reported trends are robust, the paper identifies a practical tuning knob—surface interdiffusion—that could combine interface and alloy scattering to suppress thermal conductivity below both abrupt-interface and random-alloy values, with direct implications for thermoelectric materials. The study is systematic in its parametrization of interface roughness, uses spectral decomposition to assign frequency ranges to the underlying scattering mechanisms, and does not fit any parameter to the target results; the alloy limit is computed from independent random-alloy simulations. These are genuine strengths. However, the significance is limited by two issues: all production runs use a cross-section that the authors themselves show is not converged, and the model is a generic Lennard-Jones system whose claimed transferability to Si/Ge, AlAs/GaAs, and Bi2Te3/Sb2Te3 is not demonstrated beyond one argon-parameter potential. The 30 K to 300 K comparison used for experimental validation is also not properly justified. The central ideas are plausible and falsifiable, but the current evidence is not sufficient for the strength of the conclusions.
major comments (4)
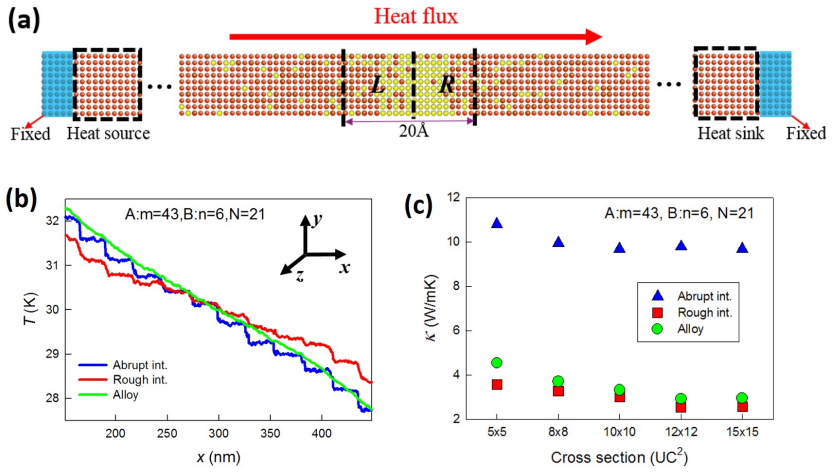
- [Section II, Non-equilibrium molecular dynamics, Fig. 2(c)] The convergence test in Fig. 2(c) shows that the thermal conductivity decreases with cross-sectional area and only converges at A = 10 UC × 10 UC, yet all production runs use A = 6 UC × 6 UC 'considering the limitation of the computational cost.' This is directly load-bearing because the paper's central claims are relative comparisons: the rough-SL-versus-alloy ordering in Fig. 4(b) has a margin of about 19% (5.7709 vs 7.0962 W/mK), and the κ/κ_alloy curves in Figs. 6-8, including the existence and location of the optimal-roughness minimum, could change if the finite-size error differs between a mass-disordered alloy and a layered superlattice. A finite cross-section also discretizes transverse phonon wavevectors, which may affect coherent interface scattering and alloy scattering differently. The authors should rerun the key simulations at 10 × 10 UC, or at least demonstrate that the ordering and the non-monotonic features are unchanged.
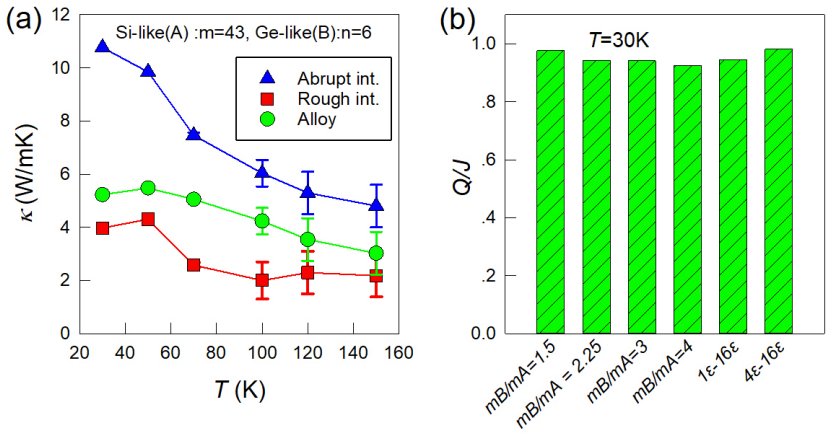
- [Section II, Model system; Section III, Fig. 3(b) and Fig. 5(a)] The model is a single Lennard-Jones potential with solid-argon parameters, with only atomic masses and the ε ratio varied, and the paper itself states that this potential 'cannot provide an adequate quantitative description of real materials.' Nevertheless, Fig. 3(b) directly compares 30 K simulation results with 300 K experimental data for Si/Ge superlattices, and the text claims that the rough-interface conductivity being nearly temperature independent 'explains why κ calculated at 30K can afford the experimental results measured at 300K.' This is not a valid justification: classical MD cannot capture quantum phonon occupation, the simulation temperature range ends at 150 K, and the agreement with experiment in Fig. 3(b) may be fortuitous given the generic model. The authors should either test one real material with a validated interatomic potential to show that the qualitative trends survive, or substantially soften the claims of experimental agreement and material-specific guidance.
- [Section II, Interfacial species mixing; Section III, Figs. 3-4] The 'alloy limit' is the reference quantity for the paper's main claim, but the manuscript never specifies how the random alloy structures are generated, how many independent disorder realizations are used, or whether the alloy has the exact same dimensions, composition, and lattice sites as the intermixed superlattice. If the alloy limit is computed from a single random configuration, the statistical uncertainty could be comparable to the 19% margin in Fig. 4(b). The authors should report the number of realizations, the averaging procedure, and the relationship between the α→∞ limit of the Laplace distribution and the random-alloy structures used as the reference.
- [Section III, Figs. 6-9] The existence of an optimal interface roughness that minimizes κ is a central conclusion, and Fig. 6(b,c) and Fig. 7(a) show non-monotonic κ/κ_alloy curves without any reported statistical uncertainty. Error bars appear only in Fig. 8. Without an estimate of run-to-run variability, the reader cannot judge whether the minimum in Fig. 6(b,c) is statistically significant or an artifact of a single trajectory. The authors should provide error bars for all reported κ and κ/κ_alloy values, or explicitly state the number of independent simulations and the standard deviation.
minor comments (5)
- [Abstract and throughout] The text contains several typos: 'in same cases' should be 'in some cases'; 'have a clear implications' should be 'have clear implications'; 'different extend' should be 'different extent'; and 'low the thermal conductivity' should be 'lower the thermal conductivity'.
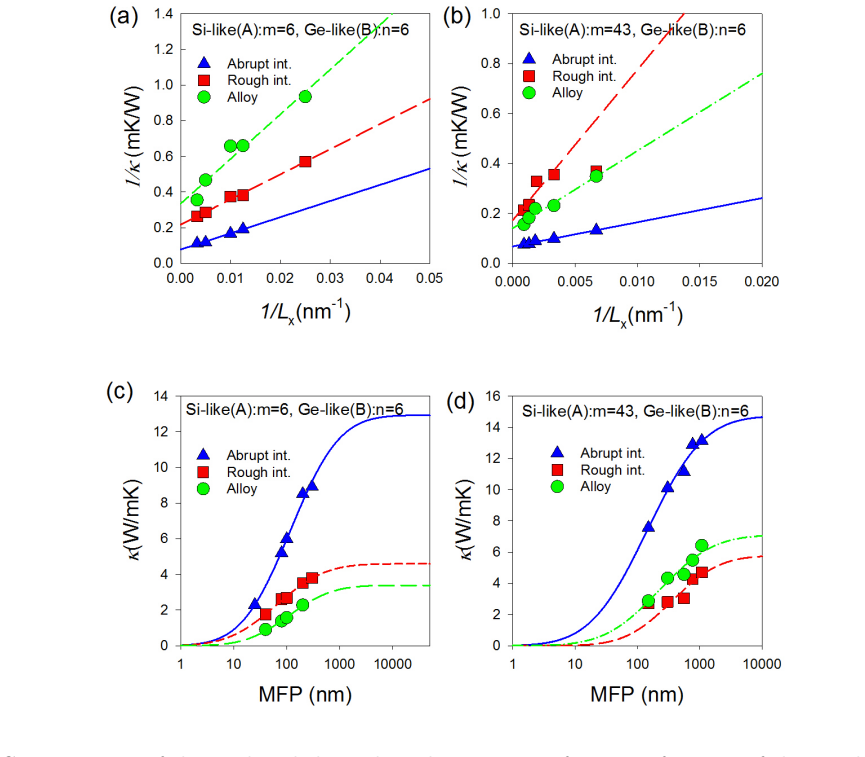
- [Section III, Fig. 4 discussion] In the paragraph reporting the mean free paths, the text says 'for the sample with short period length ((A)43/(B)6)' after giving the long-period results; the parenthetical should read 'long period length' for the second set of MFP values.
- [Equation (4)] The notation 'va_i(b)*' in the spectral heat current expression is unclear; please define the velocity components and the harmonic force constant tensor K_{ij} explicitly, or provide the exact equation numbers from Refs. [36,38] so that the expression is unambiguous.
- [Captions and text] Figure and caption language should be polished: 'SLs materials' should be 'SL materials', and the inconsistent use of 'KB' versus 'k_B' in Eq. (7) should be unified.
- [References] References [4] and [6] appear to cite the same Zebarjadi et al. paper with different years (2012 vs 2011); please check and correct.
Circularity Check
No circularity: rough-SL and alloy-limit conductivities are independent simulation outputs, with the roughness parameter alpha as an independent control rather than a fitted input.
full rationale
The paper's derivation chain is self-contained in the sense relevant to circularity: the thermal conductivities of abrupt-interface superlattices, rough-interface superlattices, and random alloys are all obtained from the same NEMD procedure, and no parameter is fitted to the target conductivity values. The interface roughness parameter α in Eq. (2) is an independent structural control, and the random-alloy limit is a separately simulated reference structure, not defined in terms of the rough-SL result. The central comparisons—e.g., κ∞(rough SL) = 5.7709 W/mK versus κ∞(alloy) = 7.0962 W/mK for (A)43/(B)6 in Fig. 4(b), and the κ/κalloy versus α curves in Figs. 6–8—are therefore not equal by construction. The spectral heat current analysis is also post-hoc: the harmonic spectral current Q is checked against the fully anharmonic NEMD heat flux J (within 6%, Fig. 5(b)), and the transmission functions are used to interpret, not to define, the computed conductivities. The paper cites prior work coauthored by W. Li (Refs. 10 and 20) to motivate the problem and to provide experimental comparison, but the new predictions stand on independent simulations rather than on those citations; no uniqueness theorem or ansatz is imported from the authors' prior work to force the conclusion. The admitted non-convergence of the 6×6 UC cross-section in Fig. 2(c) is a methodological correctness concern, not a circularity concern, because it does not amount to reusing the target result as an input. Overall, no step in the paper's derivation reduces to its own inputs by definition, by fitted parameter, or by a load-bearing self-citation chain.
Assumptions & free parameters
free parameters (4)
- LJ energy parameter ε =
0.1664 eV (argon)
- Atomic masses (mA, mB) =
40 and 90 g/mol (base case), 40/60 and 40/120 for mass-mismatch cases
- Bond-strength ratio (εB/εA) =
16:1 and 4:1 for bond-mismatch systems
- Interface roughness α =
swept (e.g., 0, 0.5, ...; values in Figs 6-8)
assumptions (5)
- domain assumption The Lennard-Jones potential with a single σ and ε for all pairs, but varying atomic masses and ε ratios, captures the qualitative phonon transport physics of real superlattices such as Si/Ge, AlAs/GaAs, and Bi2Te3/Sb2Te3.
- domain assumption Harmonic (elastic) phonon scattering dominates the interface thermal transport, so the spectral heat current from the harmonic approximation (Eq. 4) is sufficient; anharmonic corrections are negligible.
- domain assumption The thermal conductivity of the rough SLs is insensitive to temperature, so κ computed at 30K is representative of 300K behavior.
- domain assumption The Laplace distribution (Eq. 2) is an appropriate statistical model for surface-interdiffusion-driven intermixing at SL interfaces.
- standard math The Schelling extrapolation 1/κ = 1/κ∞(1+λ/Lx) gives the correct infinite-length limit of NEMD conductivity.
Cite this review
Pith. "Pith review of Optimizing phonon scattering by tuning surface-interdiffusion-driven intermixing to break the random-alloy limit of thermal conductivity." pith.science (2026). https://pith.science/paper/ANSWDSIA
@misc{pith2026190805830,
  author       = {Pith},
  title        = {Pith review of: Optimizing phonon scattering by tuning surface-interdiffusion-driven intermixing to break the random-alloy limit of thermal conductivity},
  year         = {2026},
  howpublished = {\url{https://pith.science/paper/ANSWDSIA}},
  note         = {Machine review of arXiv:1908.05830}
}
abstract
We investigate the evolution of the cross-plane thermal conductivity $\kappa$ of superlattices (SLs) as interfaces change from perfectly abrupt to totally intermixed, by using non-equilibrium molecular dynamics simulations in combination with the spectral heat current calculations. We highlight the role of surface-interdiffusion-driven intermixing by calculating the $\kappa$ of SLs with changing interface roughness, whose tuning allows for the $\kappa$ values much lower than the "alloy limit" and the abrupt interface limit in same cases. The interplay between alloy and interface scattering in different frequency ranges provides a physical basis to predict a minimum of thermal conductivity. More specifically, we also explore how the interface roughness affects the thermal conductivities for SLs materials with a broad span of atomic mass and bond strength. In particular, we find that (i) only when the "spacer" thickness of SLs increases up to a critical value the $\kappa$ of rough SLs can break the corresponding "alloy limit". (ii) Whether the $\kappa$ changes monotonically as interface roughness strongly depends on the period length and intrinsic behavior of phonon transport for SLs materials. Especially, for the SL with large period length, there exists an optimal interface roughness which can minimize the thermal conductivity. (iii) Surface-interdiffusion-driven intermixing is more effective in achieving the low $\kappa$ below the alloy limit for SL materials with large mass mismatch than with small one. (iv) It's possible for SLs materials with large lattice mismatch (i.e., bond strength) to design an ideally abrupt interface structure with $\kappa$ much below the "alloy limit". These results have a clear implications for optimization of thermal transport for heat management and for the development of thermoelectric materials.
Figures
Figures from the paper (6 more)


Reference graph
Works this paper leans on
-
[1]
I. Chowdhury, R. Prasher, K. Lofgreen, G. Chrysler, S. Narasimhan, R. Mahajan, D. Koester, R. Alley, and R. Venkatasubramanian, Nat. Nanotech. 4, 235 (2009)
work page 2009
-
[2]
D. G. Cahill, P. V. Braun, G. Chen, D. R. Clarke, S. Fan, K. E. Goodson, P. Keblinski, W. P. King, G. D. Mahan, and A. Majumdar, Appl. Phys. Rev. 1, 251 (2014)
work page 2014
-
[3]
K. Nielsch, J. Bachmann, J. Kimling, and H. Bottner, Adv. Energy Mater. 1, 713 (2011), ISSN 1614-6840
work page 2011
-
[4]
M. Zebarjadi, K. Esfarjani, M. S. Dresselhaus, Z. F. Ren, and G. Chen, Energy Environ. Sci. 5, 5147 (2012)
work page 2012
-
[5]
W. Liu, X. Yan, G. Chen, and Z. Ren, Nano Energy 1, 42 (2011)
work page 2011
-
[6]
M. Zebarjadi, K. Esfarjani, M. S. Dresselhaus, Z. F. Ren, and G. Chen, Energy Environ. Sci. 5, 5147 (2011)
work page 2011
-
[7]
Z. Chen, G. Han, L. Yang, L. Cheng, and J. Zou, Prog. Nat. Sci. :Mater. Inter. 22, 535 (2012)
work page 2012
-
[8]
Z. Tian, K. Esfarjani, and G. Chen, Phys. Rev. B 86, 235304 (2012). 14
work page 2012
Show all 41 references
-
[9]
Stoltz, N
G. Stoltz, N. Mingo, and F. Mauri, Phys. Rev. B 80, 113408 (2009)
2009
-
[10]
P. Chen, N. A. Katcho, J. P. Feser, W. Li, M. Glaser, O. G. Schmidt, D. G. Cahill, N. Mingo, and A. Rastelli, Phys. Rev. Lett. 111, 115901 (2013)
2013
-
[11]
P. J. Obrien, S. Shenogin, J. Liu, P. K. Chow, D. Laurencin, P. H. Mutin, M. Yamaguchi, P. Keblinski, and G. Ramanath, Nat. Mater. 12, 118 (2013)
2013
-
[12]
Y. Wang, Z. Lu, A. K. Roy, and X. Ruan, J. Appl. Phys. 119, 37 (2016)
2016
-
[13]
Mizuno, S
H. Mizuno, S. Mossa, and J. L. Barrat, Sci. Rep. 5, 14116 (2015)
2015
-
[14]
Guo, and B
R. Guo, and B. Huang, Sci. Rep. 5, 9579 (2015)
2015
-
[15]
M. N. Luckyanova and G. Chen, Science 338, 936 (2012)
2012
-
[16]
Prasher, Nano Lett
R. Prasher, Nano Lett. 5, 2155 (2005)
2005
-
[17]
S. J. Koester, K. Rim, J. O. Chu, P. M. Mooney, J. A. Ott, and M. A. Hargrove, Appl. Phys. Lett. 79, 2148 (2001)
2001
-
[18]
Magri and A
R. Magri and A. Zunger, Physical Rev. B 65, 165302 (2002)
2002
-
[19]
D. B. Aubertine and P. C. McIntyre, J. Appl. Phys. 97, 013531 (2005)
2005
-
[20]
P. Chen, T. Etzelstorfer, F. Hackl, N. A. Katcho, H.-T. Chang, L. Nausner, S.-W. Lee, T. Fromherz, J. Stangl, O. G. Schmidt, et al., phys. status solidi (a) 213, 533 (2015)
2015
-
[21]
R. J. Stevens, L. V. Zhigilei, and P. M. Norris, Int. J. Heat Mass Transfer 50, 3977 (2007)
2007
-
[22]
Lyver, John W
I. Lyver, John W. and E. Blaistenbarojas, J. Phys. Condens. Matter 21, 345402 (2009)
2009
-
[23]
E. S. Landry and A. J. H. McGaughey, Phys. Rev. B 79, 075316 (2009)
2009
-
[24]
N. A. Roberts and D. G. Walker, J. Appl. Phys. 108, 193102 (2010)
2010
-
[25]
Borca-Tasciuc, W
T. Borca-Tasciuc, W. Liu, J. Liu, T. Zeng, D. W. Song, C. D. Moore, G. Chen, K. L. Wang, M. S. Goorsky, and T. Radetic, Superlattices Microst. 28, 199 (2000)
2000
-
[26]
A. J. H. McGaughey, M. I. Hussein, E. S. Landry, M. Kaviany, and G. M. Hulbert, Phys. Rev. B 74, 104304 (2006)
2006
-
[27]
W. S. Capinski, H. J. Maris, T. Ruf, M. Cardona, K. Ploog, and D. S. Katzer, Phys. Rev. B 59, 8105 (1999)
1999
-
[28]
Y. Wang, H. Huang, and X. Ruan, Phys. Rev. B 90, 165406 (2014)
2014
-
[29]
Y. Wang, C. Gu, and X. Ruan, Appl. Phys. Lett. 106, 42 (2015)
2015
-
[30]
T. S. English, J. C. Duda, J. L. Smoyer, D. A. Jordan, P. M. Norris, and L. V. Zhigilei, Phys. Rev. B 85, 035438 (2012)
2012
-
[31]
X. Yang, J. Carrete, and Z. Wang, J. Appl. Phys. 118, 085701 (2015). 15
2015
-
[32]
Xiong, K
S. Xiong, K. S¨ a¨ askilahti, Y. A. Kosevich, H. Han, D. Donadio, and S. Volz, Phys. Rev. Lett. 117, 025503 (2016)
2016
-
[33]
Plimpton, J
S. Plimpton, J. Comput. Phys. 117, 1 (1993)
1993
-
[34]
X. Yang, J. Lin, G. Qiao, and Z. Wang, Appl. Phys. Lett. 106, 013904 (2015)
2015
-
[35]
Z. Zhu, X. Yang, M. Huang, Q. He, G. Yang, and Z. Wang, Nanotech. 27, 055401 (2015)
2015
-
[36]
S¨ a¨ askilahti, J
K. S¨ a¨ askilahti, J. Oksanen, S. Volz, and J. Tulkki, Phys. Rev. B91, 115426 (2015)
2015
-
[37]
S¨ a¨ askilahti, J
K. S¨ a¨ askilahti, J. Oksanen, J. Tulkki, and S. Volz, Phys. Rev. E93, 052141 (2016)
2016
-
[38]
S¨ a¨ askilahti, J
K. S¨ a¨ askilahti, J. Oksanen, J. Tulkki, and S. Volz, Phys. Rev. B90, 134312 (2014)
2014
-
[39]
P. K. Schelling, S. R. Phillpot, and P. Keblinski, Phys. Rev. B 65, 144306 (2002)
2002
-
[40]
E. S. Landry, M. I. Hussein, and A. J. H. McGaughey, Phys. Rev. B 77, 184302 (2008)
2008
-
[41]
barrier”) layer thickness n with a fixed A (Si-like “spacer
E. Lampin, P. L. Palla, P.-A. Francioso, and F. Cleri, J. Appl. Phys. 114, 033525 (2013). 16 FIG. 1: (a) Schematic illustration of ( A)m/(B)n SL structures used for our simulation. N denotes the period numbers of n monlayers (ML) of B separated by m ML of A. (b) The log-ratio ...
2013
Reviewed August 14, 2026 · model on record in the stance chip above.
Discussion (0). Continue with ORCID to comment.