REVIEW 4 major objections 7 minor 57 references
Impact of E-Scooters on Pedestrian Safety: A Field Study Using Pedestrian Crowd-Sensing
T0 review · 4 major / 7 minor · reviewed 2026-08-14 · deepseek-v4-flash
Pith's one-line read Pedestrian-carried Bluetooth receivers can identify nearby rental e-scooters from their beacon signatures and use the density of close encounters as a benchmark of pedestrian safety.
desk verdict The pedestrian-perspective BLE encounter-sensing method is genuinely new and plausible; the safety claims outrun the data because the risk proxy is a stated postulate, never validated. read the letter →
The pith
A machine-rendered reading of the paper's core claim, the machinery that carries it, and where it could break.
The reading
What carries the argument
The load-bearing object is the BLE advertising packet that commercial e-scooters emit continuously for app connectivity and unlocking, and the load-bearing definition is the predicted encounter: a sequence of at least four such packets from one scooter within a one-second sliding window, with gaps under 300 seconds merged into the same encounter and more than four encounters with the same scooter per day discarded to prevent stationary parking bias. Packet regularity separates close scooters from distant ones, since reception becomes inconsistent beyond roughly 20-25 feet, and received signal strength acts as a distance proxy calibrated against known provider models. Participant answers to prompted yes/no questions add ground truth on whether the scooter is moving, whether it is ahead or behind, and its direction, while heart-rate readings are used to detect startle responses.
What would settle it
Install fixed video cameras at a sample of low-, medium-, and high-encounter segments and independently code actual collisions, near-misses, sudden swerves, and pedestrian disruptions over the same weeks the encounter counters run; if the encounter-density ranking does not match the coded incident ranking, the safety proxy fails even though the encounter detection itself may be accurate.
Extended reading notes
Core claim
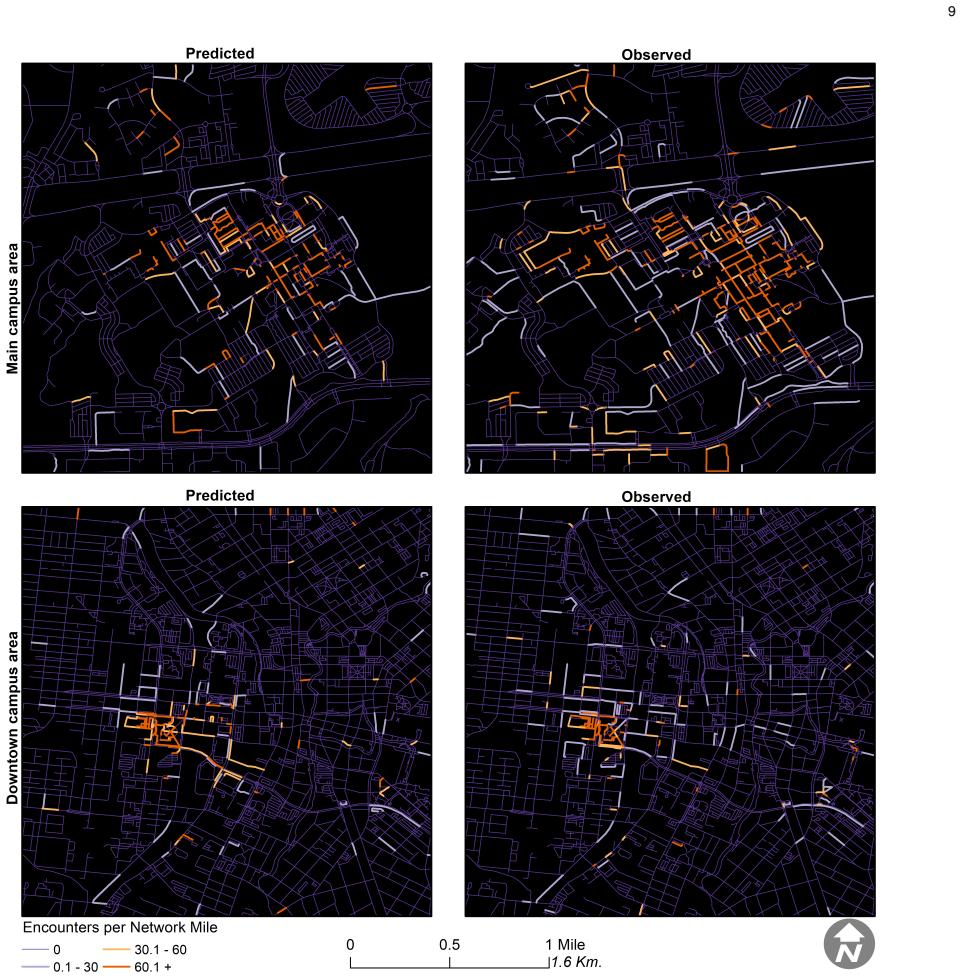
The paper's central claim is that a pedestrian's smartwatch can, by passive listening alone, recover a usable record of when and where rental e-scooters come close. Because commercial e-scooters broadcast BLE advertising packets at regular intervals, and because those packets carry provider-distinguishable identifiers, the authors define an encounter operationally: at least four packets from the same scooter in a one-second window, with nearby windows merged if less than five minutes apart, and repeated stationary proximity to the same scooter capped at four encounters per day. Applied to the campus dataset, this operation produced roughly 1,800 predicted encounters alongside participants' real-time reports of moving scooters, which add direction of approach and line of sight. The resulting spatial and temporal distributions are extremely uneven: a small number of road segments and time slots carry most of the encounters, and those high-encounter segments and periods show stronger received BLE signal strength, meaning scooters were physically closer on average. The authors take this convergence as evidence that the crowd-sensed encounter metric captures conditions under which collisions or disruptions are most probable, and they present the full pipeline—passive BLE capture, encounter detection, heart-rate confirmation, and hotspot mapping—as a blueprint for pedestrian-centered micromobility safety studies.
Load-bearing premise
The paper's safety conclusions rest on the assumption that encounter frequency and density are a valid proxy for collision risk: no counted encounter is ever linked to an actual collision, injury, or observed near-miss.
Editorial extensions
If this is right
- Planners could use the encounter maps directly to target fixes—separated bike lanes, sidewalk clearances, or re-sited scooter parking—at the specific segments where encounters cluster.
- Because data collection is pedestrian-side and passive, cities could monitor scooter-pedestrian conflict without requesting data from scooter operators, who may have incentives not to emphasize pedestrian impacts.
- The alignment of encounters with class schedules implies hotspots are partly predictable, so shuttle frequency and scooter deployment could be adjusted before peak conflict windows.
- The finding that close encounters are more common on sidewalks and local streets than on shared-use paths supports separating micromobility traffic from walking space.
- Elevated heart rates during close, fast-moving encounters, together with survey interest from 58% of participants, point toward a feasible real-time smartwatch alert application.
Reading between the lines
- Beyond the paper, the same passive-listening pipeline could be applied to other Bluetooth-emitting vehicles and personal devices, making encounter mapping a general urban-sensing primitive rather than an e-scooter-specific tool.
- Beyond the paper, separating parked-scooter obstructions from moving-scooter pass-bys would likely give planners very different safety signals, since the study's encounter counts mix the two.
- Beyond the paper, a calibration study overlaying these BLE encounters with video-coded near-misses or injury records could convert the qualitative 'potentially unsafe' label into a quantitative risk threshold, directly testing the paper's weakest assumption.
- Beyond the paper, city-scale aggregation of such pedestrian-sensed encounters could produce a dynamic sidewalk-conflict layer that complements official crash statistics, which are known to undercount pedestrian and bicycle incidents.
Signed reviews
Editorial analysis
A structured set of objections, weighed in public.
Referee Report
Summary. The paper reports a three-month field study in which 77 pedestrian participants carried custom-instrumented smartwatches that passively captured Bluetooth Low Energy (BLE) advertising packets emitted by rental e-scooters (Bird and Lime) on two university campuses. From these data the authors define two encounter types: predicted encounters (EP, derived from BLE packet streams via a sliding-window detector) and observed encounters (EO, participant-confirmed encounters with directional information). They then compute spatio-temporal encounter statistics, analyze BLE signal strength as a proxy for encounter closeness, and correlate encounters with functional road classifications, class schedules, and participant heart rate. The central safety claim is that zones and times with high encounter density or frequency are 'potentially unsafe' for pedestrians, a conclusion built on the explicit postulate in Section 3 that close e-scooter–pedestrian encounters are indicative of collision probability.
Significance. If the encounter-to-risk link were validated, the paper would make a novel and practical contribution: it demonstrates that pedestrian-carried commodity BLE receivers can identify nearby rental e-scooters and that crowd-sensed encounter data can produce useful exposure maps. The deployment is nontrivial, the encounter-detection pipeline is clearly described, and the paper is transparent in labeling its central risk proxy as a postulate rather than hiding it. However, the current manuscript is better characterized as a study of pedestrian exposure to e-scooters than as a validated safety measurement. Its headline conclusions—'potentially unsafe zones,' 'collisions are more likely,' and specific infrastructure recommendations—follow directly from the unvalidated postulate and are not independently supported by outcome data. The descriptive and methodological contributions are worth publishing, but the safety interpretation needs either external validation or systematic reframing.
major comments (4)
- [Section 3, postulate; Sections 5.1–5.3 conclusions] The core safety claim relies entirely on the Section 3 postulate that higher encounter density/frequency indicates higher collision probability or potential. The paper provides no external validation of this proxy against actual collisions, injuries, near-misses, or even pedestrian-reported disruptions. Consequently, statements such as 'this indirectly suggests that collisions are more likely to occur in high-encounter atomic segments' (Section 5.1) and 'e-scooter related pedestrian collisions are more likely to occur in spatio-temporal zones with high encounter counts' (Section 5.3) are restatements of the postulate, not empirical findings. To make the safety claim load-bearing, the authors should either validate the proxy against an outcome measure (e.g., hospital or police records, participant-reported close calls near identified hotspots) or systematically revise the manuscript to frame the results as encounter-exposure findings and use safety language only where outcomes were actually measured.
- [Section 5.1, Figure 9; Section 5.2; Section 5.3, Figure 9] The comparisons of BLE signal strength between low- and high-encounter segments/time periods/spatio-temporal zones are presented as supporting the collision-risk conclusion, but no confidence intervals or significance tests are reported. Because per-encounter RSSI is noisy and the plotted distributions appear strongly overlapping, it is not clear whether the star-marked mean differences are statistically reliable. The authors should report effect sizes with confidence intervals or bootstrap tests, and also report the number of encounters contributing to each comparison. Without this, the closeness-based claims are not quantitatively supported.
- [Section 4.4.2, heart-rate analysis] The elevated-heart-rate analysis used to support the 'startled pedestrian' narrative is not a validated outcome measure. There is no baseline or control condition (e.g., heart rate during similar walking without e-scooter encounters), no adjustment for physical activity, stair climbing, or other causes of heart-rate elevation, and no description of how the personalized thresholds were computed beyond 'most frequently occurring pulse rate(s).' The 60% figure is reported without a denominator or a statistical comparison. At best this analysis is exploratory; the authors should either add a proper control analysis or explicitly downgrade this finding to a hypothesis-generating observation.
- [Sections 5.1 and 5.3, hotspot thresholds] The designation of 'high-encounter' atomic segments (EP > 25 and EO > 5) and the corresponding spatio-temporal zone thresholds appear arbitrary, and no sensitivity analysis is provided. Since the paper's practical recommendations target these hotspots, the authors should test whether the spatial and spatio-temporal conclusions are robust to reasonable changes in the thresholds (e.g., varying EP and EO cutoffs, or using per-mile normalized counts as motivated by Table 3). Without this, the hotspot list may reflect threshold choices rather than stable features of the encounter distribution.
minor comments (7)
- [Section 4.4.1] The encounter-detection parameters (1-second sliding window with 80% overlap, N ≥ 4 packets, 300-second merge interval, maximum four encounters per scooter per participant per day) are described as 'empirically determined,' but the calibration procedure and any validation of these thresholds against independently labeled encounters are not reported. A brief description of the calibration data and its accuracy would materially improve reproducibility.
- [Section 4.2, Participants] The sentence '105 participants who participated for at least 15 days (on average) for the 30-day study' is unclear: it does not specify whether the intended participation window was 30 days or three months, and how the 15-day average was computed. Please clarify the protocol.
- [Figure 9] The visual display of BLE signal strength comparisons would be clearer with box plots or error bars; the star-mean alone does not convey the variance or sample size, which is especially important given the significance-testing concern in the major comments.
- [Section 6.1, Limitations] The limitation about privately owned e-scooters not emitting BLE packets is relevant, but the authors should also note that the study is restricted to Bird and Lime vehicles and that other providers' beacon intervals or identifiers may differ, limiting generalizability to other fleets.
- [Appendix A] The survey question numbering skips item 5; please renumber or correct the omission.
- [Table 3] The definition of Total Encounters per Segment (TES) says 'sum of all detected... encounters in a network segment,' but the column header TES is repeated for each functional class; clarify whether TES is per-segment or aggregated over all segments in that class, and state clearly how MEM is computed (it appears the MEM values are much larger than TES for some rows, so the units are unclear).
- [Section 5.1] The statement 'at least twenty atomic segments in both campuses have a relatively high number of encounters: EP > 25 and EO > 5' should state the exact number of high-encounter segments and how the threshold was chosen, particularly because the threshold is later used for safety-relevant claims.
Circularity Check
Safety conclusions are entailed by the Section 3 postulate that encounter density/frequency proxies collision risk; the descriptive encounter-sensing findings remain independent.
-
self definitional
[Section 3, 'Research Objectives', first paragraph; applied throughout Section 5 (RA1-RA3)]
"Given the significant number of incidents involving pedestrians and micromobility vehicles reported in the last two years [12], we can postulate that every such close encounter between micromobility vehicles (moving or stationary) and pedestrians has some probability of resulting in a collision or a disruption to pedestrian movement."
The paper defines the safety benchmark as encounter density/frequency in this postulate, and then draws the safety conclusions from that definition. For example, Section 5.1 states that encounters in high-encounter atomic segments 'indirectly suggests that collisions are more likely to occur in high-encounter atomic segments,' and Sections 5.2 and 5.3 make the same inference for high-encounter time periods and spatio-temporal zones. No external outcome variable (collisions, injuries, near-misses, or even pedestrian-reported disruptions linked to harm) is measured to calibrate or test the encounter proxy.
full rationale
The paper's encounter identification from BLE beacons and the resulting descriptive statistics (spatial densities, temporal patterns, signal-strength closeness) are self-contained and do not depend on any circular input. The circularity is confined to the interpretive, safety-labeling layer. The authors explicitly label the key linking assumption as a postulate in Section 3: encounter density/frequency is asserted to be a good benchmark of pedestrian safety. Sections 5.1-5.3 then report high-encounter atomic segments, time windows, and spatio-temporal zones as 'potentially unsafe' or as locations where collisions are 'more likely,' which is the postulate restated as a finding. The heart-rate observation in Section 4.4.2 is suggestive but not an external validation, as it lacks baseline and control comparisons and is itself interpreted through an assumption about startled pedestrians and inadequate response time. No load-bearing self-citation chain was found; the cited prior work is background literature rather than the source of the central claim. Overall, this is a partial circularity: the exposure measurements are valid, but the paper's safety conclusions reduce by construction to its own Section 3 definition of safety as encounter frequency/density, warranting a moderate score rather than zero.
Assumptions & free parameters
free parameters (7)
- BLE encounter detection window =
1 second
- BLE packet threshold per window =
>=4 packets
- Encounter merge interval =
300 seconds
- Maximum encounters per scooter per participant per day =
4
- Daily analysis time window =
06:00-23:00
- BLE signal strength at one foot baseline =
Bird: -60.5 dB; Lime: -46.25 dB
- Personalized heart-rate threshold =
Per participant, not specified
assumptions (5)
- domain assumption Rental e-scooters from Bird and Lime emit identifiable BLE advertising packets at regular intervals.
- domain assumption BLE signal attenuation is a reliable monotonic proxy for pedestrian-scooter distance across the smartwatches used.
- ad hoc to paper Encounter density and frequency indicate pedestrian safety risk.
- domain assumption Participant answers to the three encounter questions are accurate ground truth.
- domain assumption OpenStreetMap functional road classifications correctly represent on-campus infrastructure.
invented entities (3)
-
Predicted encounter (EP)
-
Observed encounter (EO)
-
Atomic segment
Cite this review
Pith. "Pith review of Impact of E-Scooters on Pedestrian Safety: A Field Study Using Pedestrian Crowd-Sensing." pith.science (2026). https://pith.science/paper/6C5YE4M4
@misc{pith2026190805846,
  author       = {Pith},
  title        = {Pith review of: Impact of E-Scooters on Pedestrian Safety: A Field Study Using Pedestrian Crowd-Sensing},
  year         = {2026},
  howpublished = {\url{https://pith.science/paper/6C5YE4M4}},
  note         = {Machine review of arXiv:1908.05846}
}
read the original abstract
The popularity and proliferation of electric scooters (e-scooters) as a micromobility solution in our cities and urban communities has been rapidly rising. Rent-by-the-minute pricing and a healthy competition between micromobility service providers is also benefiting riders with low trip costs. However, an unprepared urban infrastructure, combined with uncertain operation policies and poor regulation enforcement, has resulted in e-scooter riders encroaching public spaces meant for pedestrians, thus causing significant safety concerns both for themselves and the pedestrians. As a consequence, it has become critical to understand the current state of pedestrian safety in our urban communities vis-\`{a}-vis e-scooter services, identify factors that impact pedestrian safety due to such services, and determine how to support pedestrian safety going forward. Unfortunately, to date there have been no realistic, data-driven efforts within the research community that address these issues. In this work, we conduct a field study to empirically investigate crowd-sensed encounter data between e-scooters and pedestrian participants on two urban university campuses over a three-month period. We also analyze encounter statistics and mobility trends that could identify potentially unsafe spatio-temporal zones for pedestrians. This first-of-its-kind work provides a preliminary blueprint on how crowd-sensed micromobility data can enable safety-related studies in urban communities.
Figures


Figures from the paper (9 more)




Reference graph
Works this paper leans on
-
[1]
A. Neves and C. Brand, “Assessing the potential for carbon emissions savings from replacing short car trips with walking and cycling using a mixed gps-travel diary approach,” Transportation Research Part A: Policy and Practice , vol. 123, pp. 130–146, 2019
work page 2019
-
[2]
Integrating bicycling and public trans- port in north america,
J. Pucher and R. Buehler, “Integrating bicycling and public trans- port in north america,” Journal of Public Transportation , vol. 12, no. 3, p. 5, 2009
work page 2009
-
[3]
The four pillars of sustainable urban transportation,
C. Kennedy, E. Miller, A. Shalaby, H. Maclean, and J. Coleman, “The four pillars of sustainable urban transportation,” Transport Reviews, vol. 25, no. 4, pp. 393–414, 2005
work page 2005
-
[4]
National Motor Vehicle Crash Causation Survey - Crash- Stats - NHTSA,
“National Motor Vehicle Crash Causation Survey - Crash- Stats - NHTSA,” https://crashstats.nhtsa.dot.gov/Api/Public/ ViewPublication/811059, online; accessed 2019-08-01
work page 2019
-
[5]
Built environment, mobility, and quality of life,
J. Cao and J. Zhang, “Built environment, mobility, and quality of life,” Travel behaviour and society, vol. 5, pp. 1–4, 2016
work page 2016
-
[6]
J3194: Taxonomy and Classification of Pow- ered Micromobility Vehicles,
SAE International, “J3194: Taxonomy and Classification of Pow- ered Micromobility Vehicles,” https://www.sae.org/standards/ content/j3194 201911/, 2019
work page 2019
-
[7]
“Uber and Alphabet just invested $335 million in Lime - Here’s why scooter start-ups are suddenly worth billions,” https://www.cnbc.com/2018/07/11/lime-bird-spin-why- scooter-start-ups-are-suddenly-worth-billions.html, online; accessed 2019-08-01
work page 2018
-
[8]
Shedding NHTS Light on the Use of ’Little Vehicles’ in Urban Areas,
K. J. Krizek and N. McGuckin, “Shedding NHTS Light on the Use of ’Little Vehicles’ in Urban Areas,”Transport Findings, 2019
work page 2019
Show all 57 references
-
[9]
Spatiotemporal comparative analysis of scooter- share and bike-share usage patterns in washington, dc,
G. McKenzie, “Spatiotemporal comparative analysis of scooter- share and bike-share usage patterns in washington, dc,” Journal of Transport Geography, vol. 78, pp. 19–28, 2019
2019
-
[10]
Usage of e-scooters in urban environments,
C. Hardt and K. Bogenberger, “Usage of e-scooters in urban environments,” Transportation research procedia , vol. 37, pp. 155– 162, 2019
2019
-
[11]
Where Do Riders Park Dockless, Shared Electric Scooters? Find- ings from San Jose, California,
K. Fang, A. W. Agrawal, J. Steele, J. J. Hunter, and A. M. Hooper, “Where Do Riders Park Dockless, Shared Electric Scooters? Find- ings from San Jose, California,” 2018
2018
-
[12]
Sharing the sidewalk: a case of e-scooter related pedestrian injury,
N. Sikka, C. Vila, M. Stratton, M. Ghassemi, and A. Pourmand, “Sharing the sidewalk: a case of e-scooter related pedestrian injury,” The American journal of emergency medicine , 2019
2019
-
[13]
Illegal and risky riding of electric scooters in brisbane,
N. L. Haworth and A. Schramm, “Illegal and risky riding of electric scooters in brisbane,” Medical journal of Australia , vol. 211, no. 9, pp. 412–413, 2019
2019
-
[14]
Governing micro-mobility: A nationwide assessment of electric scooter regulations,
K. Anderson-Hall, B. Bordenkircher, R. O’Neil, and S. C. Scott, “Governing micro-mobility: A nationwide assessment of electric scooter regulations,” Tech. Rep., 2019
2019
-
[15]
Exploring best practice for mu- nicipal e-scooter policy in the united states,
W. Riggs and M. Kawashima, “Exploring best practice for mu- nicipal e-scooter policy in the united states,” Available at SSRN 3512725, 2020
2020
-
[16]
2018 E-Scooter Findings Report,
“2018 E-Scooter Findings Report,” https://www.portlandoregon. gov/transportation/article/709719, online; accessed 2019-08-01
2018
-
[17]
Pedestrians - Injury Facts,
“Pedestrians - Injury Facts,” https://injuryfacts.nsc.org/motor- vehicle/road-users/pedestrians/, online; accessed 2019-08-01
2019
-
[18]
Bikeshare and e-scooters in the u.s
“Bikeshare and e-scooters in the u.s.” https://data.transportation. gov/stories/s/fwcs-jprj, online; accessed 2020-03-07
2020
-
[19]
“Bird,” https://www.bird.co/, online; accessed 2019-08-01
2019
-
[20]
“Lime,” https://www.li.me/electric-scooter, online; accessed 2019-08-01
2019
-
[21]
Fly Wild,
“Fly Wild,” https://www.flyblueduck.com/, online; accessed 2019-08-01
2019
-
[22]
Are e-scooters polluters? the environmental impacts of shared dockless electric scooters,
J. Hollingsworth, B. Copeland, and J. X. Johnson, “Are e-scooters polluters? the environmental impacts of shared dockless electric scooters,” Environmental Research Letters , vol. 14, no. 8, p. 084031, 2019
2019
-
[23]
Pedestrian Safety and the Built Environment: A Review of the Risk Factors,
P . Stoker, A. Garfinkel-Castro, M. Khayesi, W. Odero, M. N. Mwangi, M. Peden, and R. Ewing, “Pedestrian Safety and the Built Environment: A Review of the Risk Factors,” Journal of Planning Literature, vol. 30, no. 4, pp. 377–392, nov 2015
2015
-
[24]
Pedestrian safety index for evaluating street facilities in urban areas,
Z. Asadi-Shekari, M. Moeinaddini, and M. Zaly Shah, “Pedestrian safety index for evaluating street facilities in urban areas,” Safety Science, vol. 74, pp. 1–14, 2015
2015
-
[25]
Racial bias in driver yielding behavior at crosswalks,
T. Goddard, K. B. Kahn, and A. Adkins, “Racial bias in driver yielding behavior at crosswalks,” Transportation Research Part F: Traffic Psychology and Behaviour, vol. 33, pp. 1–6, 2015
2015
-
[26]
Income and Racial Disparity and the Role of the Built Environment in Pedestrian Injuries,
C.-Y. Yu, X. Zhu, and C. Lee, “Income and Racial Disparity and the Role of the Built Environment in Pedestrian Injuries,” Journal of Planning Education and Research, oct 2018
2018
-
[27]
Perceived safety and experi- enced incidents between pedestrians and cyclists in a high-volume non-motorized shared space,
F. Gkekas, A. Bigazzi, and G. Gill, “Perceived safety and experi- enced incidents between pedestrians and cyclists in a high-volume non-motorized shared space,” Transportation Research Interdisci- plinary Perspectives, feb 2020
2020
-
[28]
Investigating the underreporting of pedestrian and bicycle crashes in and around university campuses - a crowdsourcing approach,
“Investigating the underreporting of pedestrian and bicycle crashes in and around university campuses - a crowdsourcing approach,” Accident Analysis & Prevention , vol. 130, no. August, pp. 99–107, sep 2019
2019
-
[29]
Bird Safety Report,
“Bird Safety Report,” https://www.bird.co/wp-content/ uploads/2019/04/Bird-Safety-Report-April-2019-3.pdf, online; accessed 2019-08-01
2019
-
[30]
E-Bikes and E-Scooters Pilot Program,
“E-Bikes and E-Scooters Pilot Program,” https://www. montgomeryparks.org/projects/directory/e-bikes-and-e- scooters-pilot-program/, online; accessed 2019-08-01
2019
-
[31]
A. P . Cohen and S. A. Shaheen, Planning for shared mobility. Amer- ican Planning Association, 2016
2016
-
[32]
Kickstarting micromobility–a pilot study on e- scooters,
S. H. Berge, “Kickstarting micromobility–a pilot study on e- scooters,” Tech. Rep., 2019
2019
-
[33]
Behavior of electric scooter operators in naturalistic environments,
J. Todd, D. Krauss, J. Zimmermann, and A. Dunning, “Behavior of electric scooter operators in naturalistic environments,” SAE Technical Paper, Tech. Rep., 2019
2019
-
[34]
Research into space conflicts among cyclists, pmd users and pedestrians on shared paths (pedestrians perspective),
P . Z. Lim, “Research into space conflicts among cyclists, pmd users and pedestrians on shared paths (pedestrians perspective),” 2019
2019
-
[35]
Comparative analysis of risky behaviors of electric bicycles at signalized intersections,
L. Bai, P . Liu, Y. Guo, and H. Yu, “Comparative analysis of risky behaviors of electric bicycles at signalized intersections,” Traffic injury prevention, vol. 16, no. 4, pp. 424–428, 2015
2015
-
[36]
Injuries associated with standing electric scooter use,
T. K. Trivedi, C. Liu, A. L. M. Antonio, N. Wheaton, V . Kreger, A. Yap, D. Schriger, and J. G. Elmore, “Injuries associated with standing electric scooter use,” JAMA network open , vol. 2, no. 1, 2019
2019
-
[37]
Emergency department visits for electric scooter- related injuries after introduction of an urban rental program,
A. Badeau, C. Carman, M. Newman, J. Steenblik, M. Carlson, and T. Madsen, “Emergency department visits for electric scooter- related injuries after introduction of an urban rental program,”The American Journal of Emergency Medicine, 2019
2019
-
[38]
Motorized scooter injuries in the era of scooter- shares: A review of the national electronic surveillance system,
M. Aizpuru, K. X. Farley, J. C. Rojas, R. S. Crawford, T. J. Moore Jr, and E. R. Wagner, “Motorized scooter injuries in the era of scooter- shares: A review of the national electronic surveillance system,” The American Journal of Emergency Medicine , 2019
2019
-
[39]
The casualties from electric bike and motorized scooter road accidents,
M. Siman-Tov, I. Radomislensky, I. T. Group, K. Peleg et al. , “The casualties from electric bike and motorized scooter road accidents,” Traffic injury prevention, vol. 18, no. 3, 2017
2017
-
[40]
The integration of electric scooters: useful technology or public health problem?
R. L. Choron, J. V . Sakranet al., “The integration of electric scooters: useful technology or public health problem?” American journal of public health, vol. 109, no. 4, pp. 555–556, 2019
2019
-
[41]
Pedestrians and e-scooters: An initial look at e-scooter parking and perceptions by riders and non-riders,
O. James, J. Swiderski, J. Hicks, D. Teoman, and R. Buehler, “Pedestrians and e-scooters: An initial look at e-scooter parking and perceptions by riders and non-riders,” Sustainability, vol. 11, no. 20, p. 5591, 2019
2019
-
[42]
Integrating e-scooters in urban transportation: Prob- lems, policies, and the prospect of system change,
S. G ¨ossling, “Integrating e-scooters in urban transportation: Prob- lems, policies, and the prospect of system change,” Transportation Research Part D: Transport and Environment, vol. 79, p. 102230, 2020
2020
-
[43]
Users attitudes on electric scooter riding speed on shared footpath: A virtual reality study,
M. Che, K. M. Lum, and Y. D. Wong, “Users attitudes on electric scooter riding speed on shared footpath: A virtual reality study,” International Journal of Sustainable Transportation, pp. 1–10, 2020
2020
-
[44]
Weather Underground,
“Weather Underground,” https://www.wunderground.com, on- line; accessed 2019-08-01
2019
-
[45]
Guidelines for regulating shared micromobility,
NACTO, “Guidelines for regulating shared micromobility,” https: //nacto.org/sharedmicromobilityguidelines/, online; accessed 2019-12-16
2019
-
[46]
Urban mobility in the sharing economy: A spa- tiotemporal comparison of shared mobility services,
G. McKenzie, “Urban mobility in the sharing economy: A spa- tiotemporal comparison of shared mobility services,” Computers, Environment and Urban Systems, vol. 79, p. 101418, 2020
2020
-
[47]
Large-scale assessment of mobile notifications,
A. Sahami Shirazi, N. Henze, T. Dingler, M. Pielot, D. Weber, and A. Schmidt, “Large-scale assessment of mobile notifications,” in 15 Proceedings of the SIGCHI Conference on Human Factors in Computing Systems, 2014, pp. 3055–3064
2014
-
[48]
My phone and me: understanding people’s receptivity to mobile notifications,
A. Mehrotra, V . Pejovic, J. Vermeulen, R. Hendley, and M. Mu- solesi, “My phone and me: understanding people’s receptivity to mobile notifications,” in Proceedings of the 2016 CHI conference on human factors in computing systems, 2016, pp. 1021–1032. APPENDIX A – P OST-STUDY S...
2016
-
[49]
How often did you receive the feedback notifications from the study application? Rarely 1 2 3 4 5 Very often
-
[50]
Did you at any point find the feedback alert notifications to be annoying? Yes No
-
[51]
If yes, did you turn the notifications off? Yes No
-
[52]
How effective was the notification mechanism? Not effective at all 1 2 3 4 5 Very effective General Pedestrian Safety
-
[53]
Have you ever used any wearable technology that pro- vides pedestrian safety? Yes No
-
[54]
If yes, please specify some
-
[55]
Would you be interested in a smartwatch application that alerts you about electric scooters in the vicinity? Yes No
-
[56]
Audio (e.g
If yes, what type of alert would you suggest for this scenario? Select all that apply. Audio (e.g. beep) Visual (e.g. flashing LED light) Tactile (e.g. vibration) A combination of the above Anindya Maiti is currently an Assistant Profes- sor in the Department of Computer Scienc...
2018
-
[2012]
Nisha Vinayaga Sureshkanth is currently a Doctoral student at the University of Texas at San Antonio, USA
His current research interests include vulnerability discovery and remediation in cyber-physical systems, and applied machine learning research in security and privacy. Nisha Vinayaga Sureshkanth is currently a Doctoral student at the University of Texas at San Antonio, USA. P...
2012
Reviewed August 14, 2026 · model on record in the stance chip above.
Discussion (0). Continue with ORCID to comment.