REVIEW 3 major objections 5 minor 6 references
Challenges in Survey Research
T0 review · 3 major / 5 minor · reviewed 2026-08-14 · deepseek-v4-flash
Pith's one-line read Software-engineering surveys become theory tests when propositions face explicit thresholds.
desk verdict A candid, experience-based survey-methods chapter; useful for early-career researchers, but the Yamane 'strong generalizability' claim and the bootstrap-median error need fixing before it becomes a reference. read the letter →
The pith
A machine-rendered reading of the paper's core claim, the machinery that carries it, and where it could break.
The reading
What carries the argument
The central mechanism is the proposition-testing protocol: a theoretical proposition is translated into a closed survey item, the response proportion is estimated by resampling with replacement (bootstrapping) to obtain a 95% confidence interval, and the proposition is considered supported only when the entire interval lies above a threshold chosen in advance (here 20% for 'common use'). A second mechanism is Bayesian accumulation: the posterior distribution from one survey run becomes the prior for the next, so evidence from repeated runs is combined instead of discarded. The protocol's work is to turn qualitative theory statements into decisions a reader can check, replacing p-value dichotomies with interval comparisons.
What would settle it
A decisive test would be to run a simulation where the true population proportion of a practice is known to be just below 20%, but the sampling frame is biased toward the kind of practitioners most likely to use it; if the bootstrap threshold rule declares support in a large share of simulated surveys, the protocol's false-support rate is unacceptably high. Conversely, the same simulation with unbiased sampling should show the rule correctly rejects below-threshold proportions.
Extended reading notes
Core claim
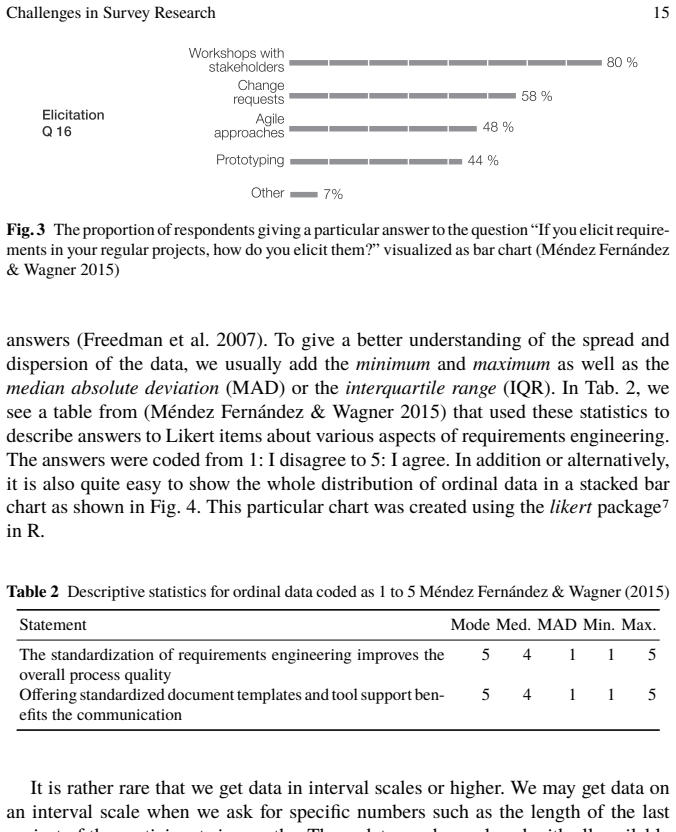
The chapter's core claim is that the reliability of survey-based research in software engineering depends less on the size of the sample than on making the inferential logic explicit at each step. A theory is expressed as propositions, each proposition is operationalized as a closed question, and support is judged by whether a bootstrapped 95% confidence interval for the response proportion stays above a pre-selected prevalence threshold; for 'common use' the authors set that threshold at 20%. Applying this protocol to requirements elicitation, they report support for all five propositions P1-P5, including observation ($P = 0.29$, CI [0.23, 0.35]). For repeated survey runs, they recommend Bayesian analysis, using the posterior of one run as the prior of the next; this narrows the workshop-usage estimate to a mean of 0.54 [0.51, 0.58]. The chapter also claims that comparing sample demographics with external large-scale surveys provides a practical representativeness check, and that for a worldwide developer population of 23 million, a sample above 400 (from Yamane's formula) supports strong generalizability claims.
Load-bearing premise
The load-bearing premise is that external benchmarks such as a commercial estimate of 23 million developers and a large developer-platform's annual survey are good enough to judge representativeness; the chapter itself concedes these benchmarks are imperfect, and if they misdescribe the true population, the representativeness checks and the $n = 400$ sample-size rule do not establish generalizability.
Editorial extensions
If this is right
- A survey claim that a practice is 'common' becomes decidable: the researcher states the threshold and the confidence interval, and any reader can check whether the interval lies entirely above it.
- Repeated surveys of the same population can accumulate evidence: each run's posterior becomes the next run's prior, so later runs sharpen estimates instead of restarting from scratch.
- A sample above 400 respondents, when demographics match external benchmarks, can support generalizing results to a worldwide developer population of about 23 million.
- Adopting a psychometrically validated instrument such as SPANE allows happiness and affect results to be compared with norm scores; modifying the instrument invalidates the comparison.
- Qualitative open answers, coded with grounded-theory techniques and validated by independent coders, can extend a theory beyond its initial propositions.
Reading between the lines
- The 20% threshold is a judgment call; the protocol would generalize to any prevalence bar, and a sensitivity analysis sweeping the threshold between 10% and 30% would show how robust the P1-P5 support really is.
- The representativeness comparison could be made quantitative by testing demographic distributions for equality instead of relying on visual comparison, which would strengthen the generalization claim.
- The same proposition-testing protocol transfers to other applied fields that use surveys to test theories, such as medical practice guidelines or management research, wherever 'common practice' is a meaningful threshold.
- A direct simulation study could calibrate the protocol: generate populations with known proportions near the threshold, sample with realistic non-representative frames, and report false-support rates for the bootstrap interval rule.
Signed reviews
Editorial analysis
A structured set of objections, weighed in public.
Referee Report
Summary. This methods-oriented chapter reports lessons learned from the authors' large-scale survey programs, primarily the NaPiRE family of requirements-engineering surveys and the GitHub-based happiness study. It covers theory building from survey data, sampling and representativeness, invitation and follow-up strategies, quantitative analysis (descriptive statistics, NHST, bootstrapped confidence intervals, Bayesian analysis), qualitative analysis with grounded-theory coding, and psychometric validation of instruments. The chapter makes concrete methodological recommendations, including evaluating theory propositions against an explicit prevalence threshold with bootstrapped confidence intervals, updating prevalence estimates across survey runs with Bayesian posteriors, and adopting psychometrically validated scales. It also makes an illustrative empirical claim that the observed proportions support all propositions P1–P5 on requirements elicitation techniques.
Significance. The chapter fills a real gap: survey-specific methodological guidance in empirical software engineering is sparse, and the authors bring unusually extensive practical experience from multi-year, multi-country survey programs. Its strengths are the concrete worked examples, the transparent decision rules (e.g., the 20% prevalence threshold), the attention to psychometric validity, and the effort to discuss ethical constraints on sampling. The advice is largely actionable and generally consonant with standard survey methodology. However, several load-bearing technical statements need correction or qualification before the chapter can serve as a reliable reference: the claim that no established bootstrap methods exist for medians, the inference from Yamane sample-size calculation to 'strong generalizability,' and an inconsistency in the Bayesian worked example. Because these issues affect central recommendations, the chapter requires a major revision rather than minor polishing.
major comments (3)
- [Section 5.3] The statement 'there are no established methods for bootstrapping confidence intervals for medians' is incorrect. Percentile and bias-corrected and accelerated (BCa) bootstrap intervals for the median are standard and are implemented in common software, including the R 'boot' package. This claim is load-bearing because it motivates the authors' decision to report confidence intervals for means on ordinal-scale data while reporting medians only as descriptive statistics. Using means for ordinal items is itself questionable, and the stated justification is false; please correct the passage and consider using bootstrap intervals for the median instead.
- [Sections 3.1–3.2, Eq. (1)] The claim that 'with a sample size of more than 400, we could claim a strong generalizability' overstates what Yamane's formula establishes. Equation (1) gives the sample size needed for a target precision under simple random sampling; it does not address nonresponse bias, coverage error, volunteer effects, or selection on outcome-related attributes. A ±5% margin (e = 0.05) is not 'strong' generalizability. The chapter's proposed representativeness check via demographic comparison to Evans Data and Stack Overflow is helpful only to the extent those benchmarks describe the target population, and the authors themselves note that they do not (Stack Overflow samples only registered users; NACE categories scatter software development). Please replace the strong generalizability language with a qualified statement that sample size addresses only sampling precision and that nonresponse and coverage threats remain.
- [Section 5.4, Fig. 5 and R output] The reported posterior parameters in the Bayesian example are internally inconsistent. The text states that the second run yielded a posterior of beta(154, 76), which is then used as the prior for the third run, and that the third run had 235 successes out of 488 responses. The posterior should therefore be beta(154+235, 76+253) = beta(389, 329). The displayed R output instead shows shape1 = 403 and shape2 = 315. As written, the worked example cannot be reproduced, undermining the illustration of Bayesian updating. Please correct the numbers or the description of the prior and data.
minor comments (5)
- [Section 1] The word 'pyschometrically' is a typo for 'psychometrically'.
- [Section 5.3] The phrase 'we ran 1,000 times resampling' should read 'we ran 1,000 bootstrap resamples.'
- [Section 5.4] The R code block includes the notebook prompt 'In [98]:' and a call to 'binom.bayes.densityplot' with no explanation; this should be cleaned up or moved to an appendix.
- [Section 7.3] The statement that 75% of respondents were professionals and 15% were students leaves 10% unaccounted for; please specify the remaining category.
- [Section 3.3] The phrase 'kindly asked us to be advised before starting research activities' is awkward; consider rewording, for example 'kindly asked us to notify them before starting research activities.'
Circularity Check
No circularity: this is an experience-report methodology chapter, not a derivation; its lessons are self-contained recommendations and worked examples.
full rationale
The paper is a methodology/experience-report chapter, so the circularity patterns targeted by this analysis (a claimed derivation whose output reduces to its input) do not apply in a direct form. The central claims are recommendations: using theory to guide questionnaires, checking representativeness against imperfect external benchmarks, estimating sample size with Yamane's formula, and preferring confidence intervals or Bayesian updating over bare NHST. These are presented as practices, not as results predicted from fitted parameters. The NaPiRE and happiness-study examples are used illustratively, and the chapter explicitly says it compiles 'lessons learned' and 'based on experiences,' which is a transparent evidential stance rather than a hidden equivalence. The 20% prevalence threshold in Section 5.3 is a stated decision rule ('we decided that common use should imply a proportion above 20 percent') applied to confidence intervals; it is not derived from the data and then re-presented as a finding. The Bayesian example in Section 5.4 uses the second-run posterior as a prior for the third run; this is conventional Bayesian updating with the assumption made explicit, and the chapter does not present the resulting posterior as an independently predicted confirmation. The sample-size argument in Section 3.2 makes an overstrong generalization claim ('with a sample size of more than 400, we could claim a strong generalizability'), but that is a statistical-inference weakness, not circularity: the conclusion follows from the formula only if the sampling assumptions hold, and the paper itself concedes the external benchmarks are imperfect. No equation in the paper equals another by construction, no fitted parameter is renamed as a prediction, and no load-bearing claim is justified solely by a self-citation whose content is unverified. The authors cite their own prior surveys heavily, but those citations supply worked examples and a theory basis, not the validity of the methodological advice itself. Under the hard rule that circularity must be exhibited by quotation and specific reduction, no circular step can be identified; the honest finding is zero.
Assumptions & free parameters
free parameters (5)
- Common-use prevalence threshold for theory propositions =
0.20
- Yamane precision level e =
0.05
- Cochran significance level alpha =
0.01
- Hypothesis operationalization threshold for problem presence =
median greater than 3 on a 1-to-5 Likert scale
- Bayesian prior for the workshop-usage proportion =
beta(154, 76) per the text; beta(168, 62) implied by the printed R output
assumptions (6)
- domain assumption Yamane's and Cochran's sample size formulas apply to software engineering survey sampling.
- domain assumption External demographic benchmarks adequately represent the target population of software developers.
- standard math The Wilcoxon signed-rank test validly tests that an ordinal Likert median exceeds a specified value.
- standard math Bootstrapped confidence intervals are asymptotically more accurate than normal-approximation intervals.
- domain assumption Grounded theory coding remains valid when applied post hoc to anonymous survey responses with stated deviations.
- domain assumption The SPANE scale's psychometric validation transfers to the GitHub developer population.
Cite this review
Pith. "Pith review of Challenges in Survey Research." pith.science (2026). https://pith.science/paper/W77H7JZN
@misc{pith2026190805899,
  author       = {Pith},
  title        = {Pith review of: Challenges in Survey Research},
  year         = {2026},
  howpublished = {\url{https://pith.science/paper/W77H7JZN}},
  note         = {Machine review of arXiv:1908.05899}
}
read the original abstract
While being an important and often used research method, survey research has been less often discussed on a methodological level in empirical software engineering than other types of research. This chapter compiles a set of important and challenging issues in survey research based on experiences with several large-scale international surveys. The chapter covers theory building, sampling, invitation and follow-up, statistical as well as qualitative analysis of survey data and the usage of psychometrics in software engineering surveys.
Figures
Reference graph
Works this paper leans on
-
[1]
AERA, APA, NCME (2014),Standards for educational and psychological testing, American Educational Research Association, Washington, DC. Amrhein, V., Greenland, S. & McShane, B. (2019), ‘Retire statistical significance’, Nature 567, 305–307. Baltes, S. & Diehl, S. (2016), Worse than spam: Issues in sampling software de- velopers, in ‘Proceedings of the 10th ...
arXiv 2014
-
[3]
Kasunic, M. (2005), Designing an effective survey, Technical report, Carnegie- Mellon University, Pittsburgh, PA and Software Engineering Institute. Kitchenham, B. A. & Pfleeger, S. L. (2002a), ‘Principles of survey research part 2: designing a survey’,ACM SIGSOFT Software Engineering Notes27(1), 18–20. URL: https://doi.org/10.1145/566493.566495 Kitchenham,...
-
[8]
URL: https://doi.org/10.1186/s40411-015-0023-0 DiCiccio, T. J. & Efron, B. (1996), ‘Bootstrap confidence intervals’,Statistical Science 11(3). Feldt, R., Torkar, R., Angelis, L. & Samuelsson, M. (2008), Towards individualized softwareengineering:empiricalstudiesshouldcollectpsychometrics, inL.Cheng, J. Sillito, M. D. Storey, B. Tessem, G. Venolia, C. R. B....
-
[20]
URL: https://doi.org/10.1145/571681.571686 Kitchenham, B. A. & Pfleeger, S. L. (2008), Personal opinion surveys,in ‘Guide to advanced empirical software engineering’, Springer, pp. 63–92. Challenges in Survey Research 33 Kline,P.(2015), Ahandbookoftestconstruction(psychologyrevivals):introduction to psychometric design, Routledge. Lenberg, P., Feldt, R. & ...
- [23]
-
[643]
Méndez Fernández, D., Wagner, S., Kalinowski, M., Schekelmann, A., Tuzcu, A., Conte, T., Spinola, R
Méndez Fernández, D., Wagner, S., Kalinowski, M., Felderer, M., Mafra, P., Vetrò, A.,Conte,T.,Christiansson,M.-T.,Greer,D.,Lassenius,C.etal.(2017),‘Naming thepaininrequirementsengineering-contemporaryproblems,causes,andeffects in practice’,Empirical Software Engineering22(5), 2298–2338. Méndez Fernández, D., Wagner, S., Kalinowski, M., Schekelmann, A., Tuz...
Reviewed August 14, 2026 · model on record in the stance chip above.
Discussion (0). Continue with ORCID to comment.