REVIEW 5 major objections 5 minor 32 references
Towards automated symptoms assessment in mental health
T0 review · 5 major / 5 minor · reviewed 2026-08-14 · deepseek-v4-flash
Pith's one-line read This thesis claims that passive physical-activity and phone-use data can differentiate psychiatric diagnoses and clinical mood states with reported accuracies of 67–95.3%, and can predict personalised mood scores with errors of 1.36–3.32…
desk verdict A substantial thesis with a new longitudinal dataset and a sensible symptom-driven framework, but the headline state-discrimination accuracies rest on self-report labels whose missingness is likely state-dependent, so the clinical-readiness claims need to be dialed back. read the letter →
The pith
A machine-rendered reading of the paper's core claim, the machinery that carries it, and where it could break.
The reading
What carries the argument
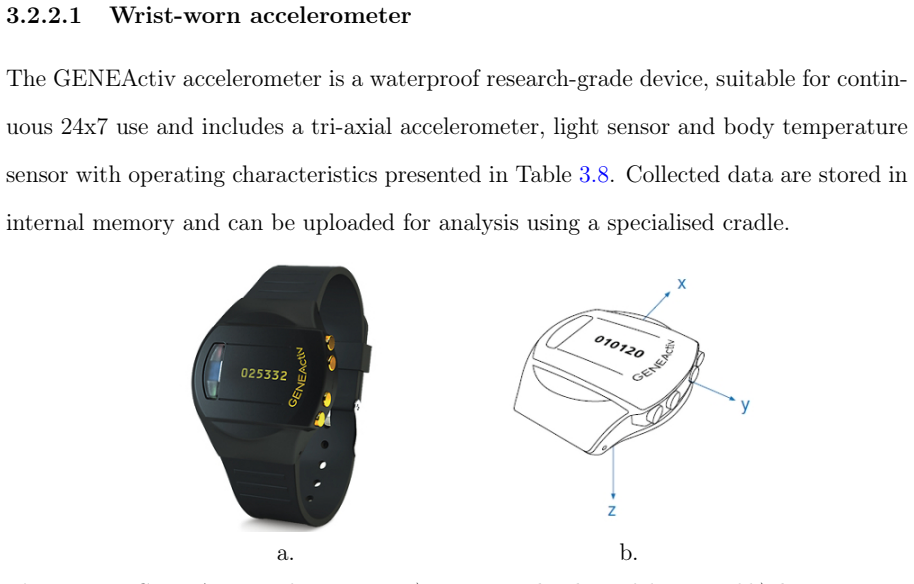
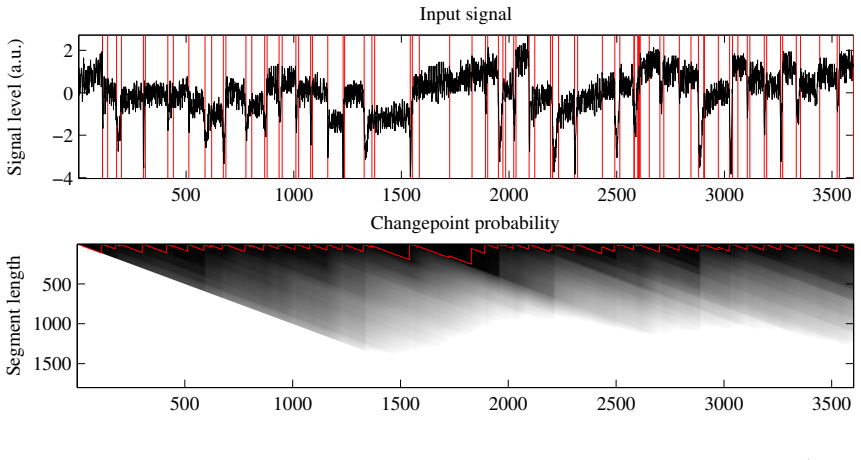
The central object is a feature pipeline built from accelerometer time series. Tri-axial acceleration is converted into the Euclidean Norm Minus One (ENMO) metric for day-time activity, while epoch-based activity counts are used for sleep analysis. Non-stationarity is treated as signal rather than noise: the Bayesian Online Change Point Detection algorithm segments activity into stationary segments, and the durations and transitions of those segments become features. Sleep and wakefulness are identified with an Explicit Duration Hidden semi-Markov Model whose parameters are trained on device-based bed-time annotations. These features are then ranked with minimum Redundancy Maximum Relevance or LASSO, and classified with logistic regression or support vector machines under leave-one-out cross-validation.
What would settle it
Run the same feature pipeline on a cohort where clinical states are independently adjudicated by structured clinical interview rather than self-report, and check whether the classifier's sensitivity and specificity for clinician-confirmed mania and depression remain at the reported levels when questionnaires are missing, delayed, or contradicted by clinician ratings.
Extended reading notes
Core claim
The central claim is that objective features extracted from activity and behaviour time series can differentiate mental health diagnoses and clinical mood states with clinically useful accuracy. The features are organised around three symptom dimensions from a five-cluster symptoms model: psychomotor (activity level and intensity), disorganisation (multiscale entropy, activity persistence, and day-to-day pattern variability), and mood (sleep-wake segmentation, circadian amplitude, and non-parametric rest-activity characteristics). Personalised regression models predict mood scores with a mean absolute error of 1.36 to 3.32 points, which falls within the 4–5 point ranges that psychiatric questionnaires reserve for distinct identifiable mood states. Adding heart-rate features to locomotor features improves schizophrenia classification by almost 10% over activity alone and by almost 17% over heart-rate features alone. The thesis argues that these results support a framework for computational behaviour analysis that could identify clinical deterioration earlier than routine clinic visits.
Load-bearing premise
The ground-truth clinical states are defined by self-report questionnaire scores (QIDS-SR16, ASRM, and Mood Zoom), and the thesis concedes that questionnaire compliance can itself change with clinical state; if the labels are wrong or missing during episodes, the reported accuracies may reflect questionnaire response patterns rather than true clinical states.
Editorial extensions
If this is right
- If a patient's sensor stream can flag mood episodes between clinic visits, clinicians could be alerted to deterioration earlier than weekly self-report alone would allow.
- The reported accuracy levels suggest sensor-based features could act as a screening layer that prompts targeted clinical interviews, rather than replacing clinician judgement.
- Personalised mood models imply that each patient's behavioural baseline can be learned, making deviations from that baseline more informative than population-level thresholds.
- The schizophrenia result, where fusing heart rate and activity improved classification, suggests multi-modal sensing may be needed for disorders whose behavioural signature is weaker.
- A standardised feature framework tied to symptom dimensions gives future studies a common language for comparing objective mental-health monitoring results.
Reading between the lines
- The accuracy figures should be read as separating questionnaire-labelled states, not clinician-validated episodes; if questionnaire compliance is itself state-dependent, the classifiers may partly be detecting response behaviour rather than the underlying episode, a limitation the thesis acknowledges.
- A natural next test is an external cohort with clinician-rated episodes and dense sensor data to see whether the 67%–95.3% accuracies survive independent adjudication.
- The framework implies that symptom dimensions, rather than diagnostic categories, are the more tractable prediction target; the same features that separate mood states could extend to other conditions with psychomotor or circadian disruption.
- A testable extension is applying the pipeline to consumer wristbands with lower sampling rates, to see whether the accuracy gains persist outside research-grade accelerometers.
Signed reviews
Editorial analysis
A structured set of objections, weighed in public.
Referee Report
Summary. The manuscript, a DPhil thesis deposited on arXiv, proposes a computational framework for automated symptom assessment in mental health from physical activity and phone-use data collected in ambulatory settings. It describes the AMoSS study, data pre-processing and segmentation methods, a symptom-driven feature framework, and three application areas: differentiation between healthy controls, bipolar disorder, and borderline personality disorder; differentiation between euthymic, manic, and depressive states; and personalised prediction of mood questionnaire scores. It also applies the framework to a separate schizophrenia dataset with heart-rate fusion. The headline results reported under leave-one-out cross-validation are 67--90% accuracy for disorder/state discrimination, 95.3% accuracy for schizophrenia versus controls, and mean absolute errors of 1.36--3.32 points for personalised mood regression.
Significance. If the reported results hold, this work would strengthen the evidence that passive sensor data contain clinically usable information about psychiatric state, and the proposed symptom-driven feature framework is a useful organizing principle for mHealth psychiatry. The strengths of the manuscript include a comparatively large longitudinal ambulatory cohort, the use of consumer devices alongside research-grade sensors, a principled mapping from Liddle's symptom dimensions to objective features, and an independent external schizophrenia dataset. However, the headline claims are conditional on two unresolved issues: the validity of self-report questionnaires as ground truth for mood state, and the integrity of the cross-validated performance estimates in small, resampled cohorts. The diagnosis-level comparisons are less exposed to the label-validity problem, but the state-discrimination and personalised mood claims, which are central to the abstract, currently inherit it.
major comments (5)
- [§3.2.1.2, §4.3.1] The state-discrimination results in Chapter 7 are not yet interpretable as clinical-state discrimination because the ground-truth labels are derived from self-report questionnaires whose missingness is state-dependent. The manuscript itself states that 'compliance can be a function of the clinical state, i.e. the patient may stop responding during a manic or depressive episode', and §4.3.1 then imputes missing weekly questionnaire scores with the unconditional mean. Under missing-not-at-random nonresponse, this procedure assigns missing episodes an average or euthymic-like score, so the remaining labels may track ease of self-report or device wear rather than true mood. The authors should quantify questionnaire missingness by state, test whether missingness is associated with concurrent self-report scores, and re-run the Chapter 7 and Chapter 8 analyses using only observed labels or an external clinician-rated episode source.
- [§6.2.2, §6.3.1, §6.4.3, §7.4.3] The cross-validated accuracy numbers in Tables 6.5 and 7.5 are point estimates from a protocol that does not, as presented, nest under-sampling, SMOTE, and feature selection inside each training fold. Under-sampling the majority class and applying mRMR or LASSO on the full data subset before LOOCV can inflate accuracy because information from the held-out subject leaks into feature selection and resampling. Please clarify the exact order of operations; if these steps are not nested within folds, the analyses should be redone with a nested or fully independent cross-validation pipeline. In addition, report bootstrap confidence intervals or per-subject prediction tables, given the small cohort sizes.
- [§4.5.1.5–§4.5.1.6] The selection of BOCPD with an expected segment length of 60 seconds for human accelerometer data is based on synthetic RR tachograms generated by the McSharry--Clifford model, with the rationale that heart rate correlates with physical activity. This is an unvalidated assumption: the model generates heart-rate dynamics, not accelerometer segment statistics, and the paper does not demonstrate that the segment-duration distributions of the two signals are similar. Since the BOCPD segment features feed into the psychomotor and disorganisation feature sets used in later chapters, the algorithm choice should be validated against human activity data with annotated change points, or at least cross-checked against the Fitbit bed/wake annotations described in §4.5.3.
- [§8.4.2, §8.5, Table 8.5] The personalised mood regression results inherit the label-validity problem of the daily Mood Zoom scores. The reported mean absolute errors are computed against the same self-report scores that are subject to state-dependent missingness and subjective bias, so the errors are not necessarily errors in an external clinical state. In addition, Table 8.5 does not report how many days per participant had imputed versus observed labels, which matters because unconditional-mean imputation will artificially improve apparent agreement when compliance is low. Please provide observed-only results and a missingness analysis.
- [§9.4, Table 9.4] The schizophrenia classification result of 95.3% and the claimed 10--17% improvement from adding heart-rate features are presented without per-fold breakdowns or confidence intervals. With the small number of participants in the Nuffield and Proteus datasets, a few individuals can drive the difference between feature sets, especially when feature selection is performed on the full cohort. Please report leave-one-out predictions per participant for the activity-only, HR-only, and combined feature sets, and state explicitly whether feature selection and any resampling were performed inside each fold.
minor comments (5)
- [§4.5.1.3, §4.5.1.6] The BOCPD expected-segment-length hyperparameter is denoted λ in the equations and Table 4.2, but the text that selects the value refers to it as τ = 60 seconds; please unify the notation.
- [Tables 3.2, 3.5, 3.7] The statistical test is spelled 'Wilcox rank sum test' in several places; the correct name is the Wilcoxon rank sum test.
- [Throughout] There are numerous typographical errors that should be corrected in a copyedit, including 'biploar disorder' in Figure 3.3, 'primarely' in the Glossary, and inconsistent hyphenation and encoding artifacts in 'Na¨ıve'.
- [§4.5.1.4–§4.5.1.6] The evaluation of change-point algorithms reports TPR and FPR, but the captions do not state the number of generated tachograms, the exact definition of the tolerance interval δ, or how true change points were defined from the synthetic model; please add these details.
- [§3.1.3.1] The mobile application section notes that 'no formal comparison were performed between smart phone characteristics with and without AMoSS mobile application'; this usability limitation should be acknowledged in the conclusions as a potential source of battery- or performance-related non-adherence.
Circularity Check
Minor in-sample HMM bed/wake validation; headline classification claims are not circular.
-
fitted input called prediction
[Section 4.5.3.3-4.5.3.4 (Model for bed/wake segmentation; Segmentation results)]
"Fitbit bed time annotation was used to estimate parameters of HMM, including the state duration distributions pi(d) and observation probability distributions bj(OOO). ... Bed/wake segmentation was performed using the proposed Hidden Markov Model and the accuracy of segmentation evaluated using manual Fitbit bed/wake annotation ground truth."
The 'ground truth' annotations are the very same Fitbit data used to estimate the HMM's state-duration and observation distributions. Reporting segmentation error against this ground truth is therefore an in-sample fit, not an independent validation: the model was constructed to reproduce the labels it is then evaluated on. This is a fitted-input-called-prediction pattern for the bed/wake component. It does not by itself force the headline classification accuracies, since diagnosis and mood-state labels are external questionnaire/clinical labels and the activity features are not derived from those labels.
full rationale
The central derivation—objective sensor features discriminating clinical groups and mood states—is not circular. The target labels are external (diagnostic labels for HC/BD/BPD and questionnaire-derived state labels), and the features are computed from accelerometer and phone data without using those labels. Leave-one-out cross-validation is used for the headline accuracy numbers. The main circularity-like issue is confined to a preprocessing component: the HMM bed/wake segmenter is fitted to Fitbit button-press annotations and then evaluated against the same annotations, so its reported minute-level errors are in-sample performance. This does not reduce the central classification claims, and the self-citations in the thesis are not load-bearing for the central predictions.
Assumptions & free parameters
free parameters (4)
- BOCPD expected segment length lambda =
60 seconds
- HMM bed/wake duration and observation parameters =
Estimated from Fitbit annotations
- Missing-data exclusion threshold for HMM segmentation =
2 hours
- Classifier and feature-selection hyperparameters =
Not fully specified
assumptions (4)
- domain assumption Physical activity and phone-use patterns are valid observable correlates of psychiatric symptoms and clinical states.
- domain assumption Questionnaire-based self-reports (QIDS-SR16, ASRM, GAD-7, Mood Zoom) provide sufficiently accurate ground truth for clinical episodes and mood.
- ad hoc to paper Synthetic RR tachograms generated by the McSharry-Clifford model have change-point statistics similar enough to human accelerometer activity to select the segmentation algorithm.
- standard math Classical statistical and machine-learning machinery (HMM, SVM, LASSO, LOOCV, SMOTE) is appropriate for these small, unbalanced, non-independent longitudinal samples.
Cite this review
Pith. "Pith review of Towards automated symptoms assessment in mental health." pith.science (2026). https://pith.science/paper/QEMXMDSG
@misc{pith2026190806013,
  author       = {Pith},
  title        = {Pith review of: Towards automated symptoms assessment in mental health},
  year         = {2026},
  howpublished = {\url{https://pith.science/paper/QEMXMDSG}},
  note         = {Machine review of arXiv:1908.06013}
}
read the original abstract
Activity and motion analysis has the potential to be used as a diagnostic tool for mental disorders. However, to-date, little work has been performed in turning stratification measures of activity into useful symptom markers. The research presented in this thesis has focused on the identification of objective activity and behaviour metrics that could be useful for the analysis of mental health symptoms in the above mentioned dimensions. Particular attention is given to the analysis of objective differences between disorders, as well as identification of clinical episodes of mania and depression in bipolar patients, and deterioration in borderline personality disorder patients. A principled framework is proposed for mHealth monitoring of psychiatric patients, based on measurable changes in behaviour, represented in physical activity time series, collected via mobile and wearable devices. The framework defines methods for direct computational analysis of symptoms in disorganisation and psychomotor dimensions, as well as measures for indirect assessment of mood, using patterns of physical activity, sleep and circadian rhythms. The approach of computational behaviour analysis, proposed in this thesis, has the potential for early identification of clinical deterioration in ambulatory patients, and allows for the specification of distinct and measurable behavioural phenotypes, thus enabling better understanding and treatment of mental disorders.
Figures


Figures from the paper (25 more)








Reference graph
Works this paper leans on
-
[1]
On this questionnaire are groups of five statements; read each group of statements carefully
-
[2]
Choose the one statement in each group that best describes the way you have been feeling for the past week
-
[3]
Circle the number next to the statement you picked. Please note:The word "occasionally" when used here means once or twice; "often" means several times or more; "frequently" means most of the time. A.2 Questions
-
[4]
Clinical features and conceptualization.Schizophrenia Research, 110(1-3):1–23. Task Force of the European Society of Cardiology the North American Society of Pac- ing Electrophysiology (1996). Heart rate variability: Standards of measurement, physiological interpretation, and clinical use.Circulation, 93(5):1043–1065. te Lindert, B. H. W. and Van Someren,...
work page 1996
-
[5]
(b) I occasionally feel happier or more cheerful than usual
Positive mood: (a) I do not feel happier or more cheerful than usual. (b) I occasionally feel happier or more cheerful than usual. 229 (c) I often feel happier or more cheerful than usual. (d) I feel happier or more cheerful than usual most of the time. (e) I feel happier or more cheerful than usual all of the time
-
[6]
(b) I occasionally feel more self-confident than usual
Self-confidence: (a) I do not feel more self-confident than usual. (b) I occasionally feel more self-confident than usual. (c) I often feel more self-confident than usual. (d) I feel more self-confident than usual. (e) I feel extremely self-confident all of the time
-
[7]
(b) I occasionally need less sleep than usual
Sleep patterns: (a) I do not need less sleep than usual. (b) I occasionally need less sleep than usual. (c) I often need less sleep than usual. (d) I frequently need less sleep than usual. (e) I can go all day and night without any sleep and still not feel tired
-
[8]
(b) I occasionally talk more than usual
Speech: (a) I do not talk more than usual. (b) I occasionally talk more than usual. (c) I often talk more than usual. (d) I frequently talk more than usual. (e) I talk constantly and cannot be interrupted
Show all 32 references
-
[9]
(b) I have occasionally been more active than usual
Activity level: 230 (a) I have not been more active (either socially, sexually, at work, home or school) than usual. (b) I have occasionally been more active than usual. (c) I have often been more active than usual. (d) I have frequently been more active than usual. (e) I am c...
-
[10]
(b) I take at least 30 minutes to fall asleep, less than half the time
Falling Asleep: (a) I never take longer than 30 minutes to fall asleep. (b) I take at least 30 minutes to fall asleep, less than half the time. (c) I take at least 30 minutes to fall asleep, more than half the time. (d) I take more than 60 minutes to fall alseep, more than hal...
-
[11]
(b) I have a restless, light sleep with a few brief awakenings each night
Sleep During the Night: 232 (a) I do not wake up at night. (b) I have a restless, light sleep with a few brief awakenings each night. (c) I wake up at least once a night, but I go back to sleep easily. (d) I awaken more than once a night and stay awake for 20 minutes or more, ...
-
[12]
(b) More than half the time, I awaken more than 30 minutes before I need to get up
Waking Up Too Early: (a) Most of the time, I awaken no more than 30 minutes before I need to get up. (b) More than half the time, I awaken more than 30 minutes before I need to get up. (c) I almost always awaken at least one hour or so before I need to, but I go back to sleep ...
-
[13]
(b) I sleep no longer than 10 hours in a 24-hour period including naps
Sleeping Too Much: (a) I sleep no longer than 7–8 hours/night, without napping during the day. (b) I sleep no longer than 10 hours in a 24-hour period including naps. (c) I sleep no longer than 12 hours in a 24-hour period including naps. (d) I sleep longer than 12 hours in a ...
-
[14]
(b) I feel sad less than half the time
Feeling Sad: (a) I do not feel sad. (b) I feel sad less than half the time. (c) I feel sad more than half the time. (d) I feel sad nearly all of the time
-
[15]
(b) I eat somewhat less often or lesser amounts of food than usual
Decreased Appetite: 233 (a) There is no change in my usual appetite. (b) I eat somewhat less often or lesser amounts of food than usual. (c) I eat much less than usual and only with personal effort. (d) I rarely eat within a 24-hour period, and only with extreme personal effort ...
-
[16]
(b) I feel a need to eat more frequently than usual
Increased Appetite: (a) There is no change from my usual appetite. (b) I feel a need to eat more frequently than usual. (c) I regularly eat more often and/or greater amounts of food than usual. (d) I feel driven to overeat both at mealtime and between meals
-
[17]
(b) I feel as if I’ve had a slight weight loss
Decreased Weight (Within the Last Two Weeks): (a) I have not had a change in my weight. (b) I feel as if I’ve had a slight weight loss. (c) I have lost 2 pounds or more. (d) I have lost 5 pounds or more
-
[18]
(b) I feel as if I’ve had a slight weight gain
Increased Weight (Within the Last Two Weeks): (a) I have not had a change in my weight. (b) I feel as if I’ve had a slight weight gain. (c) I have gained 2 pounds or more. (d) I have gained 5 pounds or more
-
[19]
234 (b) I occasionally feel indecisive or find that my attention wanders
Concentration/Decision Making: (a) There is no change in my usual capacity to concentrate or make decisions. 234 (b) I occasionally feel indecisive or find that my attention wanders. (c) Most of the time, I struggle to focus my attention or to make decisions. (d) I cannot conce...
-
[20]
(b) I am more self-blaming than usual
View of Myself: (a) I see myself as equally worthwhile and deserving as other people. (b) I am more self-blaming than usual. (c) I largely believe that I cause problems for others. (d) I think almost constantly about major and minor defects in myself
-
[21]
(b) I feel that life is empty or wonder if it’s worth living
Thoughts of Death or Suicide: (a) I do not think of suicide or death. (b) I feel that life is empty or wonder if it’s worth living. (c) I think of suicide or death several times a week for several minutes. (d) I think of suicide or death several times a day in some detail, or ...
-
[22]
(b) I notice that I am less interested in people or activities
General Interest: (a) There is no change from usual in how interested I am in other people or activities. (b) I notice that I am less interested in people or activities. (c) I find I have interest in only one or two of my formerly pursued activities. (d) I have virtually no int...
-
[23]
(b) I get tired more easily than usual
Energy Level: (a) There is no change in my usual level of energy. (b) I get tired more easily than usual. 235 (c) I have to make a big effort to start or finish my usual daily activities (for example, shopping, homework, cooking or going to work). (d) I really cannot carry out m...
-
[24]
(b) I find that my thinking is slowed down or my voice sounds dull or flat
Feeling Slowed Down: (a) I think, speak, and move at my usual rate of speed. (b) I find that my thinking is slowed down or my voice sounds dull or flat. (c) It takes me several seconds to respond to most questions and I’m sure my thinking is slowed. (d) I am often unable to resp...
-
[25]
(b) I’m often fidgety, wringing my hands, or need to shift how I am sitting
Feeling Restless: (a) I do not feel restless. (b) I’m often fidgety, wringing my hands, or need to shift how I am sitting. (c) I have impulses to move about and am quite restless. (d) At times, I am unable to stay seated and need to pace around. 236 Appendix C The Generalised A...
-
[26]
(b) Several days
Feeling nervous, anxious, or on edge: (a) Not at all. (b) Several days. (c) More than half the days. (d) Nearly every day
-
[27]
(b) Several days
Not being able to stop or control worrying: (a) Not at all. (b) Several days. 237 (c) More than half the days. (d) Nearly every day
-
[28]
(b) Several days
Worrying too much about different things: (a) Not at all. (b) Several days. (c) More than half the days. (d) Nearly every day
-
[29]
(b) Several days
Trouble relaxing: (a) Not at all. (b) Several days. (c) More than half the days. (d) Nearly every day
-
[30]
(b) Several days
Being so restless that it is hard to sit still: (a) Not at all. (b) Several days. (c) More than half the days. (d) Nearly every day
-
[31]
(b) Several days
Becoming easily annoyed or irritable: (a) Not at all. (b) Several days. (c) More than half the days. (d) Nearly every day. 238
-
[32]
(b) Several days
Feeling afraid as if something awful might happen: (a) Not at all. (b) Several days. (c) More than half the days. (d) Nearly every day. 239
Reviewed August 14, 2026 · model on record in the stance chip above.
Discussion (0). Continue with ORCID to comment.