REVIEW 3 major objections 6 minor 68 references
No-Reference Light Field Image Quality Assessment Based on Spatial-Angular Measurement
T0 review · 3 major / 6 minor · reviewed 2026-08-14 · deepseek-v4-flash
Pith's one-line read A no-reference metric that judges a light-field image by spatial naturalness plus epipolar-plane angular consistency beats 2D, 3D, multi-view, and existing light-field quality models on four public datasets.
desk verdict First no-reference LFI-QA joining spatial and angular features, worth refereeing, but the abstract overclaims and the evaluation protocol is unfair to the NR baselines. read the letter →
The pith
A machine-rendered reading of the paper's core claim, the machinery that carries it, and where it could break.
The reading
What carries the argument
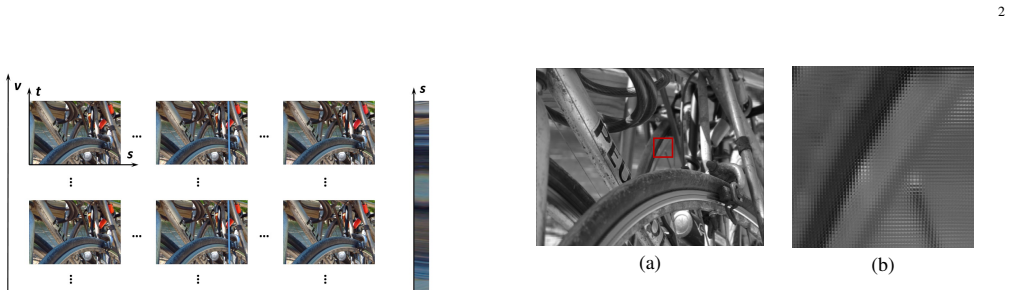
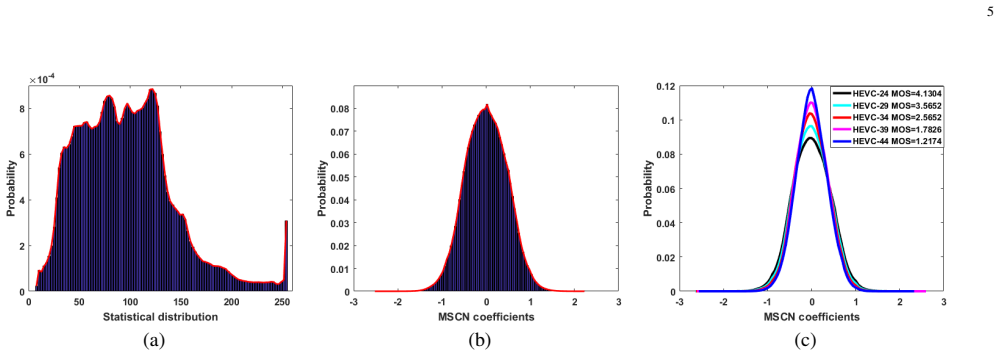
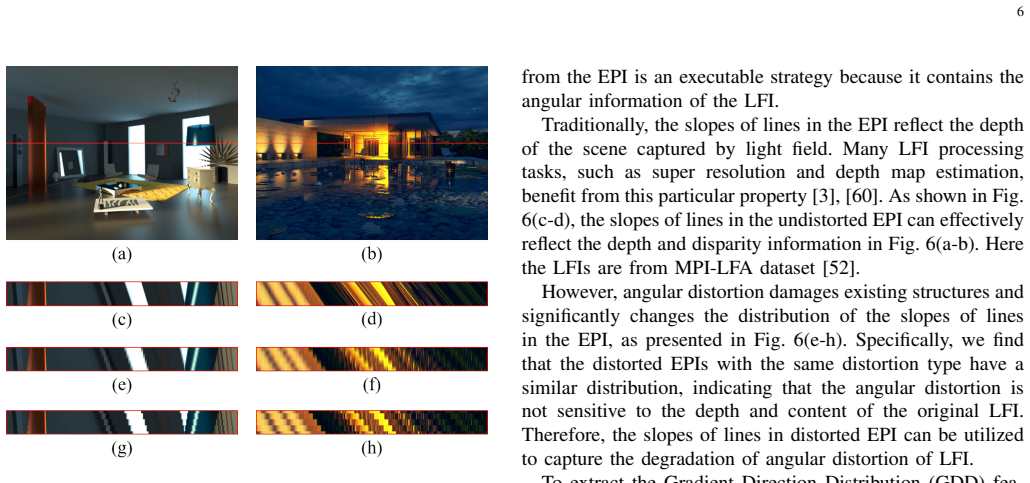
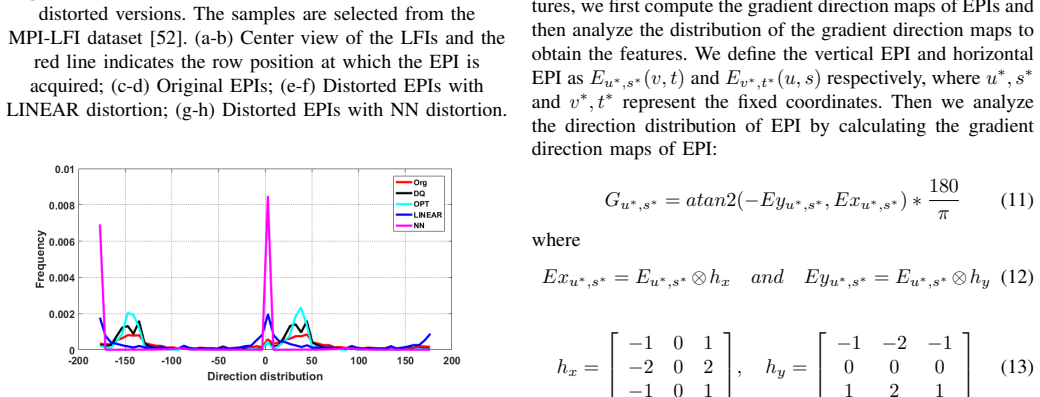
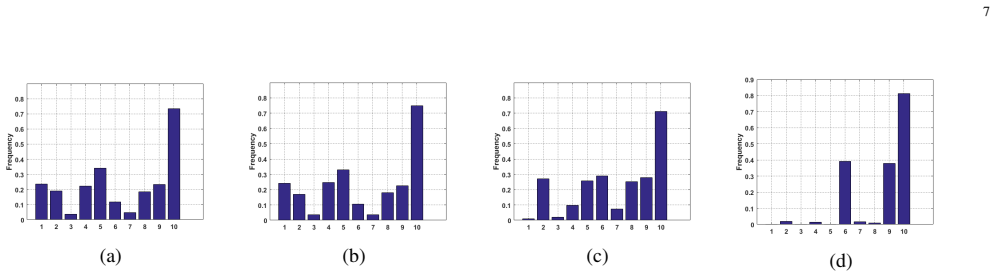
The load-bearing object is the epipolar plane image (EPI), the two-dimensional slice of a light field obtained by fixing one spatial and one angular coordinate; lines in the EPI encode disparity. The paper uses EPIs twice: gradient direction distribution (GDD), built from Sobel-derived gradient direction maps, captures global angular distortion, while weighted local binary pattern (WLBP), an entropy-weighted rotation-invariant uniform local binary pattern over EPI rows, captures local angular consistency. Spatial quality is carried by LCN, the naturalness statistics of a light field cyclopean image array synthesized by binocular-fusion weighting of neighboring sub-aperture images. These features are concatenated and mapped to subjective scores through a support vector regressor.
What would settle it
Train the published feature extractor and support vector regressor on Win5-LID and MPI-LFA, then test on a new light-field quality dataset built from reference scenes never seen in training; if SRCC falls below the within-dataset 0.90 level or below a full-reference baseline such as FSIM, the no-reference generalization claim is not supported. Also test on a distortion type absent from training, such as additive noise or blur; if the angular features cannot order its severity, they are responding to known distortion labels rather than to angular incoherence itself.
Extended reading notes
Core claim
On its own terms, NR-LFQA establishes that a single no-reference pipeline can outperform reference-based metrics on light-field quality assessment. It models the spatial half by synthesizing a light field cyclopean image array from horizontally adjacent sub-aperture images and fitting asymmetric generalized Gaussian distributions to its mean-subtracted contrast-normalized coefficients; it models the angular half by extracting the gradient direction distribution of EPIs for global consistency and a weighted local binary pattern for local inter-view coherence. The concatenated feature vector feeds a support vector regressor. Reported Spearman and linear correlation values on Win5-LID (0.9032 and 0.9206), MPI-LFA (0.9119 and 0.9155), and SMART (0.8803 and 0.9105), plus VALID 8-bit (0.9286 and 0.9799) and VALID 10-bit (0.9228 and 0.9517), exceed all compared metrics, making it the best no-reference method on VALID and the best overall compared method on the other three.
Load-bearing premise
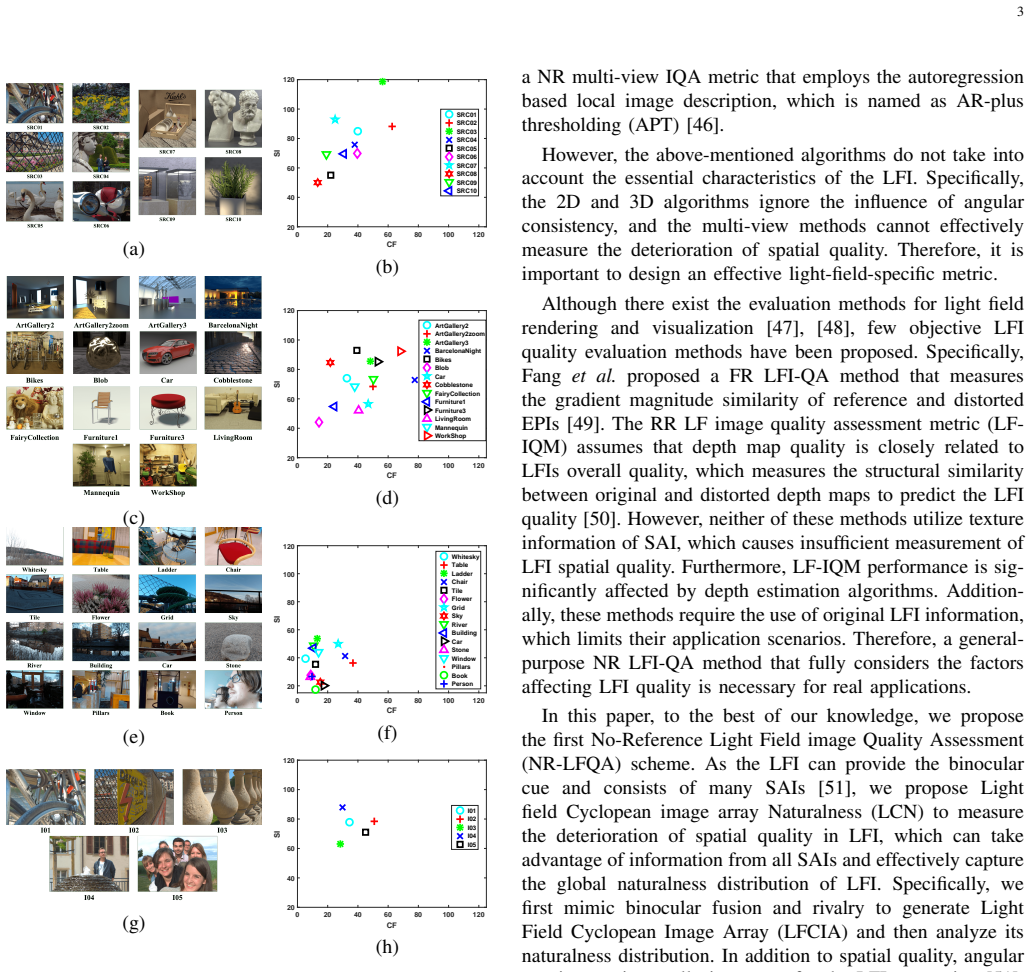
The evaluation assumes that a support vector regressor trained on a random 80% subset of each small dataset and tested on the same dataset's remaining 20%, repeated 1000 times, measures true no-reference generalization, even though only 5 to 16 reference scenes are available and the same human labels are used for both training and evaluation.
Editorial extensions
If this is right
- A no-reference LFI quality score can be computed without depth estimation, avoiding the depth-map errors that limit reduced-reference LFI metrics.
- The same features generalize across acquisition types, as shown by cross-dataset training on Win5-LID and testing on MPI-LFA with a reported SRCC of 0.8389.
- For angular-reconstruction distortions such as nearest-neighbor and linear interpolation, the method outperforms existing metrics, indicating that EPI line-slope statistics capture inter-view coherence losses that 2D and 3D metrics miss.
- Per-distortion results show competitive performance on compression distortions, with the best no-reference SRCC for HEVC and GAUSS and the best overall compared SRCC for JPEG.
- The full pipeline runs faster than the compared reduced-reference LFI metric (432 seconds versus 1169 seconds per evaluation on Win5-LID), making it practical for automated quality monitoring.
Reading between the lines
- A natural extension the authors state but do not develop is a parametric, non-regression model: if the EPI and cyclopean statistics are monotonically tied to distortion level, a closed-form quality formula could replace the support vector regressor and make the method fully blind.
- Because the features are distortion-pattern statistics tied to EPI structure, the method may transfer to view-synthesis artifacts or light-field video, provided those distortions also appear as changes in EPI line-slope distributions; this is a testable extension the paper does not run.
- The strongest test of the no-reference claim would hold out entire reference scenes during training; the paper's single cross-dataset experiment is suggestive but only covers distortion types shared between two datasets, so scene-level hold-out is where the generalization claim should be settled.
- The reported linear correlations are computed after fitting a five-parameter logistic mapping per test split, so part of the linear-accuracy advantage could reflect calibration rather than raw prediction; reporting correlations on the uncalibrated regressor output would separate ranking ability from calibration.
Signed reviews
Editorial analysis
A structured set of objections, weighed in public.
Referee Report
Summary. The paper proposes NR-LFQA, a no-reference light field image quality assessment method that combines three feature groups: LCN (naturalness statistics of a cyclopean image array synthesized from adjacent sub-aperture images), GDD (gradient direction distribution of epipolar plane images), and WLBP (entropy-weighted local binary patterns on EPIs). Quality scores are obtained by training a support vector regressor with an RBF kernel on labeled LFI datasets. The method is evaluated on Win5-LID, MPI-LFA, SMART, and VALID, with 80/20 random splits repeated 1000 times, and is compared against 2D, 3D, multi-view, and light-field QA algorithms. The main reported results show the proposed method achieving the highest SRCC/LCC on Win5-LID (0.9032/0.9206), MPI-LFA (0.9119/0.9155), and SMART (0.8803/0.9105), and the best no-reference performance on VALID. Additional experiments include per-distortion analysis, an ablation of the three feature components, a cross-dataset test, statistical significance tests, and a runtime comparison with LF-IQM.
Significance. If the performance claims survive a fair evaluation protocol, this is a valuable contribution to light field quality assessment. The method is clearly specified, the feature decomposition (spatial naturalness, global angular gradient directions, local angular LBP statistics) is interpretable and well motivated by light field geometry, and the ablation study and per-distortion tables give insight into which components drive performance. The paper also ships a cross-dataset experiment and a runtime comparison, which are commendable. The central weakness is that the headline comparison is not protocol-fair for no-reference methods, so the current evidence does not yet establish the claimed state-of-the-art status.
major comments (3)
- [Section III-D/E; Tables I-II] The main comparison is not fair to the no-reference baselines. The proposed SVR is trained on 80% of each target dataset's MOS labels (Section III-D), whereas the NR baselines are 'predict[ed] ... according to regression methods in their papers' (Section III-E), meaning BRISQUE, FRIQUEE, SINQ, and BSVQE use models trained on other databases rather than on the same LFI training folds. The reported margins in Tables I-II therefore conflate feature quality with supervised training on the evaluation dataset. To support the claim that NR-LFQA outperforms state-of-the-art no-reference methods, the authors should retrain all learnable baselines on the same LFI training splits using the same SVR and hyperparameter search, or provide cross-dataset evaluations (train on one dataset, test on each other dataset) for every method.
- [Section III-D; Tables VII] The random 80/20 split shares reference scenes between training and test. Since Win5-LID has 10 reference scenes, MPI-LFA 14, SMART 16, and VALID 5, distorted LFIs from the same scene appear in both training and test, allowing the regressor to exploit scene identity rather than generic quality perception. The drop in SRCC from 0.9119 (within MPI-LFA) to 0.8389 when training on Win5-LID and testing on MPI-LFA (Table VII) is consistent with dataset/scene dependence. The authors should report results under scene-disjoint splits (e.g., leave-one-scene-out or train/test on disjoint reference scenes) to demonstrate that the method generalizes beyond memorization of scene-specific statistics.
- [Abstract; Table II] The abstract's statement that 'the proposed method outperforms state-of-the-art 2D, 3D, multi-view, and LFI quality assessment algorithms' is contradicted by the paper's own results on VALID-8bit. In Table II, several full-reference methods achieve higher SRCC than the proposed NR-LFQA, including VIF (0.9749), IFC (0.9693), FSIM (0.9695), IWSSIM (0.9674), MP-PSNR Full (0.9730), and MP-PSNR Reduc (0.9744), versus the proposed 0.9286. The later text correctly says the method is 'superior to all NR algorithms' on VALID, but the abstract and the introduction's contributions should be reworded to claim superiority over no-reference methods, or to restrict the claim to the datasets where the broad statement actually holds.
minor comments (6)
- [Eq. (3)] In the denominator of Eq. (3), the second term is written as ε[Su,v+1((s,t)+ds,t)], which appears to be a typo; based on the definition of Wu+1,v it should likely be ε[Su+1,v((s,t)+ds,t)]. Please check and correct.
- [Section III-D] The SVR hyperparameters (C and gamma for the RBF kernel) are not reported. Since these are selected on each dataset, the search range and the chosen values should be given to make the experiments reproducible.
- [Fig. 6 caption] The caption refers to the 'MPI-LFI dataset'; the dataset name is MPI-LFA throughout the rest of the paper. Please correct the typo.
- [Table VI] The Win5-LID column header 'JPEG' is inconsistent with Section II, which describes the distortion as 'JPEG2000 (JPEG)'. Please clarify whether the table refers to JPEG2000 and use a consistent abbreviation.
- [Section I] The introduction claims the 'first No-Reference Light Field image Quality Assessment scheme.' Given the pace of the field, please check for earlier NR LFI-QA works and either cite them or qualify the claim as 'to the best of the authors' knowledge.'
- [General] The paper uses 'LF-IQM' and 'LFI-IQM' interchangeably; please standardize the abbreviation throughout.
Circularity Check
No significant circularity: the proposed features are independent image statistics, and the reported correlations come from held-out splits.
full rationale
NR-LFQA's features are constructed from pixel data only. LCN computes MSCN/AGGD statistics of a cyclopean image array synthesized from SAIs (Eqs. 1-5); GDD computes histogram statistics of EPI gradient directions (Eqs. 11-13); WLBP computes entropy-weighted rotation-invariant uniform LBP histograms on EPIs (Eqs. 14-20). None of these definitions references MOS or subjective scores, so the features are not defined in terms of the target. The quality regression in Section III-D trains an RBF SVR on an 80% random split and reports median SRCC/LCC/RMSE over 1000 splits on the remaining 20%; the headline performance numbers are therefore held-out predictions rather than fitted values renamed as predictions. The use of the authors' Win5-LID dataset [51] is a mild self-citation, but MPI-LFA, SMART, and VALID are external benchmarks, and the self-citation does not supply any load-bearing derivation: the proposed equations are self-contained. The logistic mapping in Eq. (21) is a standard monotonic fit applied equally to all competitors and does not determine SRCC. Concerns about the fairness of comparing a supervised SVR against pre-trained NR baselines, or about scene overlap in random splits, are experimental-protocol issues, not circularity; no equation in the paper reduces by construction to its own input.
Assumptions & free parameters
free parameters (6)
- SVR RBF kernel hyperparameters (C, gamma) =
not reported
- Logistic mapping parameters beta_1 to beta_5 =
optimized on each test split
- Cyclopean weighting constants A1 and A2 =
not reported
- WLBP configuration R, P, T =
R=1,2,3; P=3R; T=R/2
- MSCN Gaussian window K and L =
K=L=3
- SAI downsampling factor =
2
assumptions (4)
- domain assumption MSCN coefficients of natural light field cyclopean image arrays follow an AGGD-shaped distribution, and distortion breaks this naturalness.
- domain assumption Adjacent horizontal SAIs behave like a stereo pair, so cyclopean synthesis with an SSIM-based disparity estimate models binocular fusion for light fields.
- domain assumption EPI line-slope statistics and their gradient-direction and LBP distributions are valid perceptual proxies for angular consistency.
- domain assumption The subjective opinion scores in Win5-LID, MPI-LFA, SMART and VALID are reliable ground truth for light field quality.
Cite this review
Pith. "Pith review of No-Reference Light Field Image Quality Assessment Based on Spatial-Angular Measurement." pith.science (2026). https://pith.science/paper/Z5BARCBX
@misc{pith2026190806280,
  author       = {Pith},
  title        = {Pith review of: No-Reference Light Field Image Quality Assessment Based on Spatial-Angular Measurement},
  year         = {2026},
  howpublished = {\url{https://pith.science/paper/Z5BARCBX}},
  note         = {Machine review of arXiv:1908.06280}
}
read the original abstract
Light field image quality assessment (LFI-QA) is a significant and challenging research problem. It helps to better guide light field acquisition, processing and applications. However, only a few objective models have been proposed and none of them completely consider intrinsic factors affecting the LFI quality. In this paper, we propose a No-Reference Light Field image Quality Assessment (NR-LFQA) scheme, where the main idea is to quantify the LFI quality degradation through evaluating the spatial quality and angular consistency. We first measure the spatial quality deterioration by capturing the naturalness distribution of the light field cyclopean image array, which is formed when human observes the LFI. Then, as a transformed representation of LFI, the Epipolar Plane Image (EPI) contains the slopes of lines and involves the angular information. Therefore, EPI is utilized to extract the global and local features from LFI to measure angular consistency degradation. Specifically, the distribution of gradient direction map of EPI is proposed to measure the global angular consistency distortion in the LFI. We further propose the weighted local binary pattern to capture the characteristics of local angular consistency degradation. Extensive experimental results on four publicly available LFI quality datasets demonstrate that the proposed method outperforms state-of-the-art 2D, 3D, multi-view, and LFI quality assessment algorithms.
Figures

Figures from the paper (7 more)


Reference graph
Works this paper leans on
-
[1]
Overview of the multiview and 3D extensions of high efficiency video coding,
G. Tech, Y . Chen, K. M ¨uller, J.-R. Ohm, A. Vetro, and Y .-K. Wang, “Overview of the multiview and 3D extensions of high efficiency video coding,” IEEE Transactions on Circuits and Systems for Video Technology, vol. 26, no. 1, pp. 35–49, 2016
work page 2016
-
[2]
Design, implementation, and evaluation of a point cloud codec for tele-immersive video,
R. Mekuria, K. Blom, and P. Cesar, “Design, implementation, and evaluation of a point cloud codec for tele-immersive video,” IEEE Transactions on Circuits and Systems for Video Technology , vol. 27, no. 4, pp. 828–842, 2016
work page 2016
-
[3]
Light field image processing: An overview,
G. Wu, B. Masia, A. Jarabo, Y . Zhang, L. Wang, Q. Dai, T. Chai, and Y . Liu, “Light field image processing: An overview,” IEEE Journal of Selected Topics in Signal Processing, vol. 11, no. 7, pp. 926–954, 2017
work page 2017
-
[4]
A. Gershun, “The light field,” Journal of Mathematics and Physics , vol. 18, no. 1-4, pp. 51–151, 1939
work page 1939
-
[5]
The plenoptic function and the elements of early vision. computational models of visual processing,
E. H. Adelson and J. R. Bergen, “The plenoptic function and the elements of early vision. computational models of visual processing,” International Journal of Computer Vision , p. 20, 1991
work page 1991
-
[6]
Light field rendering,
M. Levoy and P. Hanrahan, “Light field rendering,” in Proceedings of the 23rd annual conference on Computer graphics and interactive techniques. ACM, 1996, pp. 31–42
1996
-
[7]
The lumigraph,
S. J. Gortler, R. Grzeszczuk, R. Szeliski, and M. F. Cohen, “The lumigraph,” in Proceedings of the 23rd annual conference on Computer graphics and interactive techniques . ACM, 1996, pp. 43–54
1996
- [8]
Show all 68 references
-
[9]
JPEG Pleno call for proposals on light field coding,
I. J. S. 29/WG1, “JPEG Pleno call for proposals on light field coding,” Jan. 2017
2017
-
[10]
Cap- turing and rendering with incident light fields,
J. Unger, A. Wenger, T. Hawkins, A. Gardner, and P. Debevec, “Cap- turing and rendering with incident light fields,” UNIVERSITY OF SOUTHERN CALIFORNIA MARINA DEL REY CA INST FOR CREATIVE , Tech. Rep., 2003
2003
-
[11]
Super- multiview content with high angular resolution: 3D quality assessment on horizontal-parallax lightfield display,
R. R. Tamboli, B. Appina, S. Channappayya, and S. Jana, “Super- multiview content with high angular resolution: 3D quality assessment on horizontal-parallax lightfield display,” Signal Processing: Image Communication, vol. 47, pp. 42–55, 2016
2016
-
[12]
3D light field camera technology,
¯A. Raytrix, “3D light field camera technology,” 2017
2017
-
[13]
A survey on computational displays: Pushing the boundaries of optics, computation, and perception,
B. Masia, G. Wetzstein, P. Didyk, and D. Gutierrez, “A survey on computational displays: Pushing the boundaries of optics, computation, and perception,” Computers & Graphics, vol. 37, no. 8, pp. 1012–1038, 2013
2013
-
[14]
Optimal presentation of imagery with focus cues on multi- plane displays,
R. Narain, R. A. Albert, A. Bulbul, G. J. Ward, M. S. Banks, and J. F. O’Brien, “Optimal presentation of imagery with focus cues on multi- plane displays,” ACM Transactions on Graphics (TOG) , vol. 34, no. 4, p. 59, 2015
2015
-
[15]
Focus 3D: Compressive accommodation display
A. Maimone, G. Wetzstein, M. Hirsch, D. Lanman, R. Raskar, and H. Fuchs, “Focus 3D: Compressive accommodation display.” ACM Trans. Graph., vol. 32, no. 5, pp. 153–1, 2013
2013
-
[16]
Plenoptic modeling: An image-based rendering system,
L. McMillan and G. Bishop, “Plenoptic modeling: An image-based rendering system,” in Proceedings of the 22nd annual conference on Computer graphics and interactive techniques . Citeseer, 1995, pp. 39– 46
1995
-
[17]
Image quality assessment: from error visibility to structural similarity,
Z. Wang, A. C. Bovik, H. R. Sheikh, and E. P. Simoncelli, “Image quality assessment: from error visibility to structural similarity,” IEEE Transactions on Image Processing , vol. 13, no. 4, pp. 600–612, 2004
2004
-
[18]
Multiscale structural similarity for image quality assessment,
Z. Wang, E. P. Simoncelli, and A. C. Bovik, “Multiscale structural similarity for image quality assessment,” in The Thrity-Seventh Asilomar Conference on Signals, Systems & Computers , vol. 2. IEEE, 2003, pp. 1398–1402
2003
-
[19]
FSIM: A feature similarity index for image quality assessment,
L. Zhang, L. Zhang, X. Mou, and D. Zhang, “FSIM: A feature similarity index for image quality assessment,” IEEE Transactions on Image Processing, vol. 20, no. 8, pp. 2378–2386, 2011
2011
-
[20]
Information content weighting for perceptual image quality assessment,
Z. Wang and Q. Li, “Information content weighting for perceptual image quality assessment,” IEEE Transactions on Image Processing , vol. 20, no. 5, pp. 1185–1198, 2011
2011
-
[21]
Perceptual quality metric with in- ternal generative mechanism,
J. Wu, W. Lin, G. Shi, and A. Liu, “Perceptual quality metric with in- ternal generative mechanism,” IEEE Transactions on Image Processing, vol. 22, no. 1, pp. 43–54, 2013
2013
-
[22]
VSI: A visual saliency-induced index for perceptual image quality assessment,
L. Zhang, Y . Shen, and H. Li, “VSI: A visual saliency-induced index for perceptual image quality assessment,” IEEE Transactions on Image Processing, vol. 23, no. 10, pp. 4270–4281, 2014
2014
-
[23]
Gradient magnitude similarity deviation: A highly efficient perceptual image quality index,
W. Xue, L. Zhang, X. Mou, and A. C. Bovik, “Gradient magnitude similarity deviation: A highly efficient perceptual image quality index,” IEEE Transactions on Image Processing , vol. 23, no. 2, pp. 684–695, 2014. 13
2014
-
[24]
An information fidelity criterion for image quality assessment using natural scene statistics,
H. R. Sheikh, A. C. Bovik, and G. De Veciana, “An information fidelity criterion for image quality assessment using natural scene statistics,” IEEE Transactions on Image Processing , vol. 14, no. 12, pp. 2117– 2128, 2005
2005
-
[25]
Image information and visual quality,
H. R. Sheikh and A. C. Bovik, “Image information and visual quality,” IEEE Transactions on Image Processing , vol. 15, no. 2, pp. 430–444, 2006
2006
-
[26]
Image quality assessment based on a degradation model,
N. Damera-Venkata, T. D. Kite, W. S. Geisler, B. L. Evans, and A. C. Bovik, “Image quality assessment based on a degradation model,” IEEE Transactions on Image Processing , vol. 9, no. 4, pp. 636–650, 2000
2000
-
[27]
VSNR: A wavelet-based visual signal-to-noise ratio for natural images,
D. M. Chandler and S. S. Hemami, “VSNR: A wavelet-based visual signal-to-noise ratio for natural images,” IEEE Transactions on Image Processing, vol. 16, no. 9, pp. 2284–2298, 2007
2007
-
[28]
Reduced-reference image quality assess- ment using a wavelet-domain natural image statistic model,
Z. Wang and E. P. Simoncelli, “Reduced-reference image quality assess- ment using a wavelet-domain natural image statistic model,” in Human Vision and Electronic Imaging X , vol. 5666. International Society for Optics and Photonics, 2005, pp. 149–160
2005
-
[29]
Reduced-and no-reference image quality assessment,
Z. Wang and A. C. Bovik, “Reduced-and no-reference image quality assessment,” IEEE Signal Processing Magazine , vol. 28, no. 6, pp. 29– 40, 2011
2011
-
[30]
Reduced-reference image quality assessment by structural similarity estimation,
A. Rehman and Z. Wang, “Reduced-reference image quality assessment by structural similarity estimation,” IEEE Transactions on Image Pro- cessing, vol. 21, no. 8, pp. 3378–3389, 2012
2012
-
[31]
Blind image quality assessment: From natural scene statistics to perceptual quality,
A. K. Moorthy and A. C. Bovik, “Blind image quality assessment: From natural scene statistics to perceptual quality,” IEEE Transactions on Image Processing , vol. 20, no. 12, pp. 3350–3364, 2011
2011
-
[32]
Blind image quality assessment: A natural scene statistics approach in the DCT domain,
M. A. Saad, A. C. Bovik, and C. Charrier, “Blind image quality assessment: A natural scene statistics approach in the DCT domain,” IEEE Transactions on Image Processing, vol. 21, no. 8, pp. 3339–3352, 2012
2012
-
[33]
No-reference image quality assessment in the spatial domain,
A. Mittal, A. K. Moorthy, and A. C. Bovik, “No-reference image quality assessment in the spatial domain,” IEEE Transactions on Image Processing, vol. 21, no. 12, pp. 4695–4708, 2012
2012
-
[34]
Making a “completely blind
A. Mittal, R. Soundararajan, and A. C. Bovik, “Making a “completely blind” image quality analyzer,” IEEE Signal Processing Letters, vol. 20, no. 3, pp. 209–212, 2012
2012
-
[35]
Perceptual quality prediction on authentically distorted images using a bag of features approach,
D. Ghadiyaram and A. C. Bovik, “Perceptual quality prediction on authentically distorted images using a bag of features approach,” Journal of vision, vol. 17, no. 1, pp. 32–32, 2017
2017
-
[36]
HDR-VDP- 2: a calibrated visual metric for visibility and quality predictions in all luminance conditions,
R. Mantiuk, K. J. Kim, A. G. Rempel, and W. Heidrich, “HDR-VDP- 2: a calibrated visual metric for visibility and quality predictions in all luminance conditions,” in ACM Transactions on Graphics (TOG) , vol. 30, no. 4. ACM, 2011, p. 40
2011
-
[37]
Objective quality assessment method of stereo images,
J. Yang, C. Hou, Y . Zhou, Z. Zhang, and J. Guo, “Objective quality assessment method of stereo images,” in 3DTV Conference: The True Vision-Capture, Transmission and Display of 3D Video . IEEE, 2009, pp. 1–4
2009
-
[38]
Full-reference quality assessment of stereopairs accounting for rivalry,
M.-J. Chen, C.-C. Su, D.-K. Kwon, L. K. Cormack, and A. C. Bovik, “Full-reference quality assessment of stereopairs accounting for rivalry,” Signal Processing: Image Communication , vol. 28, no. 9, pp. 1143– 1155, 2013
2013
-
[39]
No-reference quality assessment of natural stereopairs,
M.-J. Chen, L. K. Cormack, and A. C. Bovik, “No-reference quality assessment of natural stereopairs,” IEEE Transactions on Image Pro- cessing, vol. 22, no. 9, pp. 3379–3391, 2013
2013
-
[40]
Binocular spatial activity and reverse saliency driven no-reference stereopair quality assessment,
L. Liu, B. Liu, C.-C. Su, H. Huang, and A. C. Bovik, “Binocular spatial activity and reverse saliency driven no-reference stereopair quality assessment,” Signal Processing: Image Communication , vol. 58, pp. 287–299, 2017
2017
-
[41]
Blind stereoscopic video quality assess- ment: From depth perception to overall experience,
Z. Chen, W. Zhou, and W. Li, “Blind stereoscopic video quality assess- ment: From depth perception to overall experience,” IEEE Transactions on Image Processing , vol. 27, no. 2, pp. 721–734, 2018
2018
-
[42]
DIBR synthesized image quality assessment based on morphological pyramids, 3DTV- CON immersive and interactive 3D media experience over networks,
D. Sandic-Stankovic, D. Kukolj, and P. Le Callet, “DIBR synthesized image quality assessment based on morphological pyramids, 3DTV- CON immersive and interactive 3D media experience over networks,” Lisbon, July, 2015
2015
-
[43]
Multi-scale synthe- sized view assessment based on morphological pyramids,
D. Sandi ´c-Stankovi´c, D. Kukolj, and P. Le Callet, “Multi-scale synthe- sized view assessment based on morphological pyramids,” Journal of Electrical Engineering, vol. 67, no. 1, pp. 3–11, 2016
2016
-
[44]
DIBR synthesized image quality assessment based on morphological wavelets,
D. Sandic-Stankovic, D. Kukolj, and P. Le Callet, “DIBR synthesized image quality assessment based on morphological wavelets,” in Seventh International Workshop on Quality of Multimedia Experience (QoMEX). IEEE, 2015, pp. 1–6
2015
-
[45]
Objective image quality assessment of 3D synthesized views,
F. Battisti, E. Bosc, M. Carli, P. Le Callet, and S. Perugia, “Objective image quality assessment of 3D synthesized views,” Signal Processing: Image Communication, vol. 30, pp. 78–88, 2015
2015
-
[46]
Model- based referenceless quality metric of 3D synthesized images using local image description,
K. Gu, V . Jakhetiya, J.-F. Qiao, X. Li, W. Lin, and D. Thalmann, “Model- based referenceless quality metric of 3D synthesized images using local image description,” IEEE Transactions on Image Processing , vol. 27, no. 1, pp. 394–405, 2018
2018
-
[47]
Estimation of signal distortion using effective sampling density for light field-based free viewpoint video,
H. Shidanshidi, F. Safaei, and W. Li, “Estimation of signal distortion using effective sampling density for light field-based free viewpoint video,” IEEE Transactions on Multimedia , vol. 17, no. 10, pp. 1677– 1693, 2015
2015
-
[48]
The key performance indicators of projection-based light field visualization,
P. A. Kara, R. R. Tamboli, O. Doronin, A. Cserkaszky, A. Barsi, Z. Nagy, M. G. Martini, and A. Simon, “The key performance indicators of projection-based light field visualization,” Journal of Information Display, vol. 20, no. 2, pp. 81–93, 2019
2019
-
[49]
Light filed image quality assessment by local and global features of epipolar plane image,
Y . Fang, K. Wei, J. Hou, W. Wen, and N. Imamoglu, “Light filed image quality assessment by local and global features of epipolar plane image,” in Fourth International Conference on Multimedia Big Data (BigMM) . IEEE, 2018, pp. 1–6
2018
-
[50]
Reduced reference quality assess- ment of light field images,
P. Paudyal, F. Battisti, and M. Carli, “Reduced reference quality assess- ment of light field images,” IEEE Transactions on Broadcasting , pp. 1–14, 2019
2019
-
[51]
Perceptual evaluation of light field image,
L. Shi, S. Zhao, W. Zhou, and Z. Chen, “Perceptual evaluation of light field image,” in 25th IEEE International Conference on Image Processing (ICIP). IEEE, 2018, pp. 41–45
2018
-
[52]
Towards a quality metric for dense light fields,
V . K. Adhikarla, M. Vinkler, D. Sumin, R. K. Mantiuk, K. Myszkowski, H.-P. Seidel, and P. Didyk, “Towards a quality metric for dense light fields,” in IEEE Conference on Computer Vision and Pattern Recognition (CVPR). IEEE, 2017, pp. 3720–3729
2017
-
[53]
Towards the perceptual quality evaluation of compressed light field images,
P. Paudyal, F. Battisti, M. Sj ¨ostr¨om, R. Olsson, and M. Carli, “Towards the perceptual quality evaluation of compressed light field images,”IEEE Transactions on Broadcasting, vol. 63, no. 3, pp. 507–522, 2017
2017
-
[54]
V ALID: Visual quality assessment for light field images dataset,
I. Viola and T. Ebrahimi, “V ALID: Visual quality assessment for light field images dataset,” in 10th International Conference on Quality of Multimedia Experience (QoMEX) , no. CONF, 2018
2018
-
[55]
Subjective video quality assessment methods for multimedia applications,
P. ITU-T RECOMMENDATION, “Subjective video quality assessment methods for multimedia applications,” International telecommunication union, 1999
1999
-
[56]
The zone of comfort: Predicting visual discomfort with stereo displays,
T. Shibata, J. Kim, D. M. Hoffman, and M. S. Banks, “The zone of comfort: Predicting visual discomfort with stereo displays,” Journal of vision, vol. 11, no. 8, pp. 11–11, 2011
2011
-
[57]
S. B. Steinman, R. P. Garzia, and B. A. Steinman, Foundations of binocular vision: a clinical perspective. McGraw-Hill New York, 2000
2000
-
[58]
Foundations of cyclopean perception
B. Julesz, “Foundations of cyclopean perception.” 1971
1971
-
[59]
Linearity and normal- ization in simple cells of the macaque primary visual cortex,
M. Carandini, D. J. Heeger, and J. A. Movshon, “Linearity and normal- ization in simple cells of the macaque primary visual cortex,” Journal of Neuroscience, vol. 17, no. 21, pp. 8621–8644, 1997
1997
-
[60]
Light field reconstruction using deep convolutional network on EPI,
G. Wu, M. Zhao, L. Wang, Q. Dai, T. Chai, and Y . Liu, “Light field reconstruction using deep convolutional network on EPI,” in IEEE Conference on Computer Vision and Pattern Recognition (CVPR) , vol. 2017, 2017, p. 2
2017
-
[61]
Multiresolution gray-scale and rotation invariant texture classification with local binary patterns,
T. Ojala, M. Pietikainen, and T. Maenpaa, “Multiresolution gray-scale and rotation invariant texture classification with local binary patterns,” IEEE Transactions on Pattern Analysis and Machine Intelligence , vol. 24, no. 7, pp. 971–987, 2002
2002
-
[62]
LBP-based edge-texture features for object recognition,
A. Satpathy, X. Jiang, and H.-L. Eng, “LBP-based edge-texture features for object recognition,”IEEE Transactions on Image Processing, vol. 23, no. 5, pp. 1953–1964, 2014
1953
-
[63]
Survey on LBP based texture descriptors for image classification,
L. Nanni, A. Lumini, and S. Brahnam, “Survey on LBP based texture descriptors for image classification,” Expert Systems with Applications , vol. 39, no. 3, pp. 3634–3641, 2012
2012
-
[64]
Blind image quality assessment using multiscale local binary patterns,
P. G. Freitas, W. Y . Akamine, and M. C. Farias, “Blind image quality assessment using multiscale local binary patterns,” Journal of Imaging Science and Technology, vol. 60, no. 6, pp. 60 405–1, 2016
2016
-
[65]
Blind image quality assessment using the joint statistics of generalized local binary pattern,
M. Zhang, C. Muramatsu, X. Zhou, T. Hara, and H. Fujita, “Blind image quality assessment using the joint statistics of generalized local binary pattern,” IEEE Signal Processing Letters , vol. 22, no. 2, pp. 207–210, 2015
2015
-
[66]
No reference image quality assessment based on local binary pattern statistics,
M. Zhang, J. Xie, X. Zhou, and H. Fujita, “No reference image quality assessment based on local binary pattern statistics,” in Visual Communications and Image Processing (VCIP) . IEEE, 2013, pp. 1–6
2013
-
[67]
3D-HEVC visual quality assessment: Database and bitstream model,
W. Zhou, N. Liao, Z. Chen, and W. Li, “3D-HEVC visual quality assessment: Database and bitstream model,” in Eighth International Conference on Quality of Multimedia Experience (QoMEX) . IEEE, 2016, pp. 1–6
2016
-
[68]
LIBSVM: a library for support vector machines,
C.-C. Chang and C.-J. Lin, “LIBSVM: a library for support vector machines,” ACM Transactions on Intelligent Systems and Technology (TIST), vol. 2, no. 3, p. 27, 2011
2011
Reviewed August 14, 2026 · model on record in the stance chip above.
Discussion (0). Continue with ORCID to comment.