REVIEW 2 major objections 5 minor 72 references
Homogeneous Analysis of Hot Earths: Masses, Sizes, and Compositions
T0 review · 2 major / 5 minor · reviewed 2026-08-14 · deepseek-v4-flash
Pith's one-line read Analyzing all 11 known hot Earths with one uniform pipeline, this paper finds that every one is less massive than 8 Earth masses, and argues that this ceiling is the critical mass for runaway gas accretion.
desk verdict A genuinely useful homogeneous catalog of all known hot Earths, with a suggestive but not conclusive critical-mass claim that needs a bit more statistical care. read the letter →
The pith
A machine-rendered reading of the paper's core claim, the machinery that carries it, and where it could break.
The reading
What carries the argument
The load-bearing machinery is the homogeneous analysis pipeline. For each of the 11 systems it feeds Gaia parallaxes, literature spectroscopic parameters, and K-band magnitudes through stellar evolutionary tracks to get stellar masses and radii; fits transit light curves with priors on stellar mean density; and models radial velocities with a quasi-periodic Gaussian-process kernel whose hyperparameters are trained on the out-of-transit light curve, so correlated stellar activity is separated from the planetary signal. Compositions are then read off a two-layer iron-core plus MgSiO$_3$-mantle mass–radius model, with water-envelope limits computed separately. The single pipeline is what lets the paper compare planets that had previously been modeled by different groups with conflicting results.
What would settle it
A Doppler measurement of one additional hot Earth satisfying the same selection (insolation above 650 times Earth's, radius below $2\,R_\oplus$, FGK host) with a mass above $8\,M_\oplus$ would overturn the proposed ceiling; alternatively, evidence that giant impacts have stripped a substantial fraction of mantle mass from hot Earths would break the link between observed masses and the critical core mass for accretion.
Extended reading notes
Core claim
On the paper's own terms, the discovery is an observational upper bound with a formation interpretation. After homogenizing stellar parameters, transit fits, and radial-velocity noise models across the complete sample of hot Earths with insolation $F/F_\odot > 650$, radii below $2\,R_\oplus$, and FGK hosts ($\log g > 4$), every planet has a Doppler mass below about $8\,M_\oplus$ — even though radial-velocity surveys preferentially detect more massive planets. Because hot Earths are thought to be the exposed rocky cores of sub-Neptunes that lost their envelopes to photoevaporation, the maximum surviving core mass should trace the critical core mass for runaway gas accretion. The paper therefore proposes that the critical mass is roughly $8\,M_\oplus$, consistent with recent envelope-opacity calculations (2–8 $M_\oplus$) and below the older canonical $10\,M_\oplus$. A secondary result is that the apparent spread in hot-Earth compositions shrinks under the homogeneous treatment: K2-106b is no longer extremely iron-rich, most planets match an Earth-like iron/rock ratio, and none require a substantial water or volatile atmosphere.
Load-bearing premise
The central inference assumes that hot Earths are the stripped rocky cores of sub-Neptune planets whose masses have not been significantly reduced by giant impacts, and that the 11-planet sample is representative of the most massive cores that avoided runaway gas accretion.
Editorial extensions
If this is right
- If $8\,M_\oplus$ is the critical core mass for runaway accretion, then giant-planet cores in this formation picture should cluster below that value; the hot-Earth sample provides a direct, if indirect, measurement of that threshold.
- The absence of any detected hot Earth above $8\,M_\oplus$ sharpens the allowed range for critical core mass from the older $10\,M_\oplus$ estimate down to about $8\,M_\oplus$.
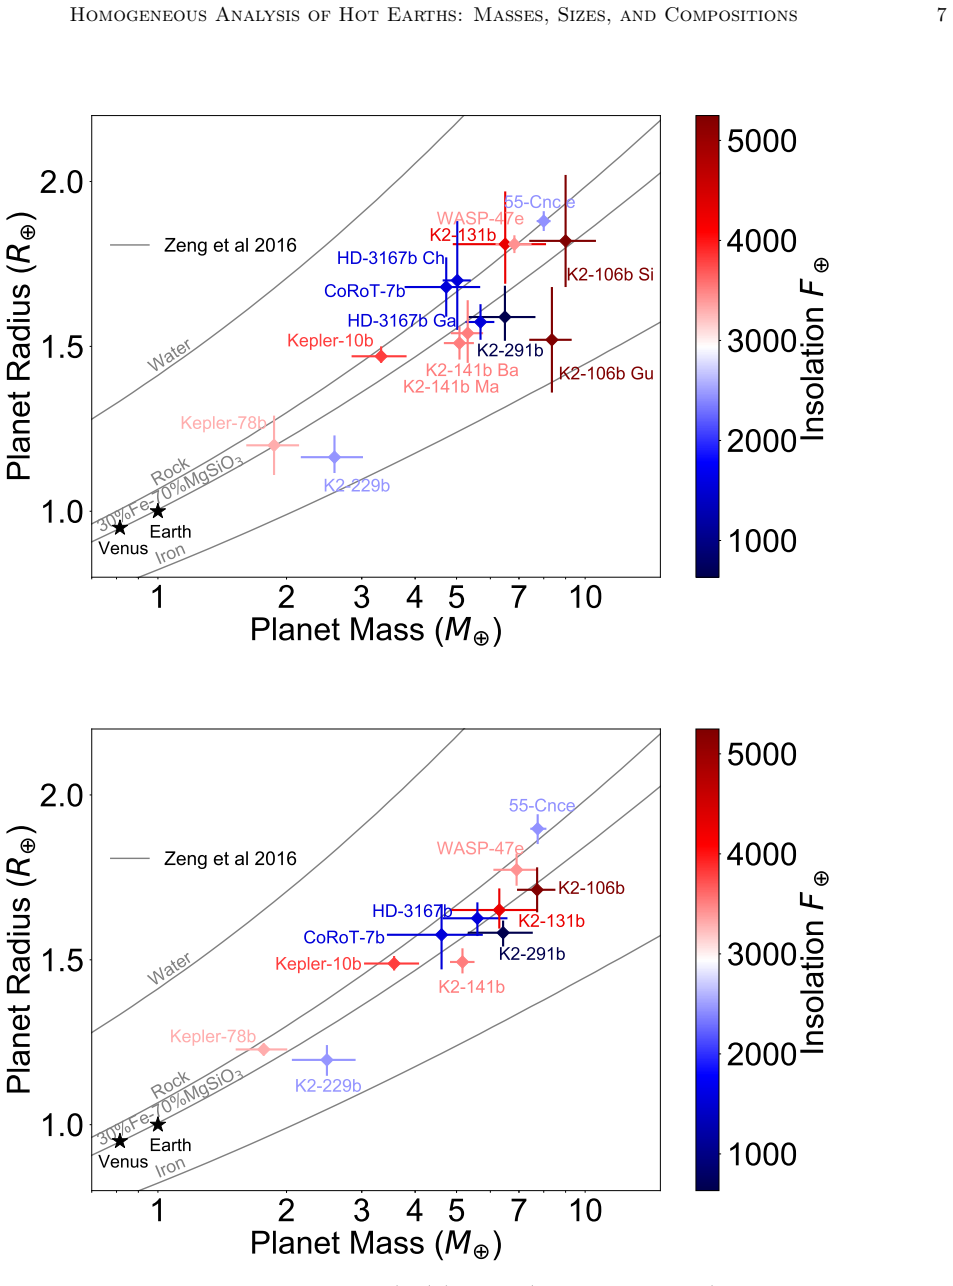
- The homogeneous re-analysis removes the previously reported ultra-iron-rich composition of K2-106b, implying that at least some claimed compositional extremes among hot Earths were artifacts of heterogeneous modeling.
- Water-mass-fraction upper limits mostly below 10–20% support formation from volatile-depleted planetesimals inside the snow line rather than migration from beyond it.
- The lack of correlation between core mass fraction and insolation is additional evidence that these planets have no significant H/He envelope, as photoevaporation theory predicts.
Reading between the lines
- If the $8\,M_\oplus$ ceiling is a formation threshold rather than a selection artifact, future transit surveys with brighter host stars should keep the ceiling intact; a single well-measured hot Earth above $8\,M_\oplus$ would force a different explanation.
- The same homogeneous pipeline could be applied to the broader sub-Neptune population; if their inferred core masses also pile up below about $8\,M_\oplus$, that would strengthen the link between hot Earths and the cores of wider-orbiting planets.
- The two iron-rich planets (K2-141b and K2-229b) and the two low-density planets (55 Cnc e and WASP-47e) hint that more than one formation channel operates; a larger sample could test whether the iron-rich cases correlate with host-star metallicity or the presence of giant companions.
Signed reviews
Editorial analysis
A structured set of objections, weighed in public.
Referee Report
Summary. This paper presents a homogeneous re-analysis of the 11 known 'hot Earths' (ultra-short-period planets with Fp/Fsun > 650, Rp < 2 Rearth, and log g > 4). The authors combine all publicly available transit and radial-velocity data, use Gaia DR2 parallaxes to refine stellar parameters through MESA isochrone fitting, fit the transits with BATMAN, and model the radial velocities with a Gaussian-process framework whose hyperparameters are informed by out-of-transit photometry. For each planet they report the mass, radius, and composition under a two-layer iron/rock model. Their main results are: (1) the homogeneous analysis reduces the scatter in inferred iron mass fractions compared with the heterogeneous literature values, (2) most hot Earths are consistent with an Earth-like composition, with K2-141b and K2-229b showing possible iron enhancement and 55 Cnc e requiring either a very low iron fraction or a volatile envelope, and (3) all of the planets are less massive than 8 Mearth, which the authors interpret as evidence that 8 Mearth is the critical mass for runaway gas accretion.
Significance. The homogeneous re-analysis itself is a valuable contribution: it demonstrates the power of combining Gaia parallaxes, uniform stellar modeling, and Gaussian-process noise treatment, and it resolves a specific published contradiction (the composition of K2-106b). A reliable catalog of masses, radii, and compositions for hot Earths is important for testing photoevaporation and formation scenarios. If the composition results hold, they support the picture of hot Earths as exposed rocky cores with little or no H/He envelope. However, the headline claim that 8 Mearth is the critical mass for runaway accretion is not quantitatively supported by the current analysis; the maximum of an 11-object sample is a weak estimator of the upper edge of the core-mass distribution unless selection and the underlying distribution are modeled. The paper's central measurement results are sound, but the formation-theory conclusion requires additional statistical work.
major comments (2)
- [Section 6.2, Table 2] The inference that 8 Mearth is the critical mass for runaway gas accretion is not supported by the presented analysis. The evidence is the maximum mass among 11 planets, 55 Cnc e at 7.74 +/- 0.37 Mearth. A sample maximum is a high-variance estimator of the upper edge of a distribution unless the underlying distribution and the selection function are modeled; with only 11 objects, the maximum could easily be several Mearth below the true threshold. The sentence in Section 6.2 that selection bias 'works in our favor' is qualitative and does not replace a completeness calculation, since the 11 systems come from different surveys with different detection thresholds and follow-up criteria. Furthermore, the two most massive planets in Table 2, 55 Cnc e and WASP-47e, have core mass fractions consistent with zero (-0.10 +/- 0.14 and 0.09 +/- 0.21), so their total masses are not clean upper limits on the rocky core mass; the observed maximum is not even a robust bound on the core-mass threshold. I recommend either adding an explicit order-statistics calculation with a stated prior on the core-mass distribution and selection function, or substantially softening the conclusion to a statement about the observed masses rather than the critical mass.
- [Section 6.1, Figure 2, Table 2] The claim of a smaller dispersion in composition and of residual intrinsic dispersion is not quantitatively established. The paper reports a mean core mass fraction of 26% with a standard deviation of 23%, but this is the raw scatter of the posterior modes and does not separate measurement uncertainty from intrinsic scatter. Given that individual core mass fractions have uncertainties of roughly 0.15 to 0.35 (Table 2), the data may be consistent with a single common composition, or with a wide range of intrinsic dispersions. The comparison with the literature in Figure 2 is visual, and no significance test is reported. A formal model comparison, such as a common-composition model versus an intrinsic-scatter model, is needed to support the conclusions that the dispersion is reduced relative to the literature and that a real intrinsic dispersion remains.
minor comments (5)
- [Section 3] The sentence 'We inflated the uncertainties on uncertainties of Teff to 110 K' appears to have a typo; presumably it should read 'the uncertainties of Teff'.
- [Figure 2 caption] The notation '(Rp/R)earth' in the caption is unclear; it should probably be '(Rp/Rearth)'.
- [Section 6.1] There is a typo in the discussion of Dorn et al. (2019): 'whcih' should be 'which'.
- [Table 1] System names are not rendered consistently (e.g., '55 Cnc e', 'CoRot-7b', 'K2-291b'); standardizing the names would improve readability.
- [References] Wang & Dai (2017) is cited only as an arXiv e-print; if a peer-reviewed version exists, it should be updated.
Circularity Check
No significant circularity: the 8 M⊕ statement is an empirical maximum of independently measured masses, not an input to the fit.
full rationale
The paper's derivation chain is data-driven rather than self-referential: stellar parameters are obtained from Gaia parallaxes, literature spectroscopy, and MESA isochrones; transit radii are fitted from photometry; masses are fitted from radial velocities with a Gaussian-process activity model; and compositions are interpreted by comparing the derived mass-radius values with the externally published Zeng et al. (2016) Fe-MgSiO3 curves. No fitted parameter is renamed as a prediction, and no target quantity is inserted into the likelihood. The '8 M⊕ is the critical mass' claim is explicitly presented as an inference from the maximum observed mass of the sample, with the paper stating, 'With these premises, we can use the maximum observed mass of a hot Earth as an indicator of the critical mass for initiating runaway gas accretion,' and immediately noting the giant-impact caveat. This is an estimator based on an order statistic, not a circular reduction: the critical mass is not defined as the sample maximum, and the paper compares its empirical bound with independent theoretical estimates (Rafikov 2006; Lee & Chiang 2016). Self-citations (Dai et al. 2017 Gaussian-process pipeline, Dai et al. 2018 stellar-parameter procedure, Wang & Dai 2017 mass-loss calculation, Zeng et al. 2016 composition curves) are methodological or theoretical tools with stated assumptions and are not fitted to the paper's conclusions; none is a uniqueness theorem or an ansatz that forces the headline result. The acknowledged limitations (small sample, possible volatile envelopes for 55 Cnc e and WASP-47 e, possible giant-impact mass stripping) weaken the astrophysical interpretation but do not constitute circularity. The paper is benchmarked against earlier literature values in Figure 2 and is self-contained against external data.
Assumptions & free parameters
free parameters (2)
- GP hyperparameters h, tau, Gamma, T per star =
not listed (posteriors)
- Stellar jitter per instrument =
not listed
assumptions (5)
- domain assumption Two-layer Fe-MgSiO3 interior model from Zeng et al. (2016) applies to hot Earths.
- domain assumption Hot Earths have lost all H/He envelopes via photoevaporation, so their masses are core masses.
- domain assumption The quasi-periodic GP kernel trained on photometry captures the correlated noise in RVs.
- domain assumption Hot Earth orbits are circular due to tidal circularization.
- domain assumption The sample defined by F/F_sun > 650, Rp < 2 R_earth, and logg > 4 is complete for maximum-mass inference.
Cite this review
Pith. "Pith review of Homogeneous Analysis of Hot Earths: Masses, Sizes, and Compositions." pith.science (2026). https://pith.science/paper/TG3OXKRY
@misc{pith2026190806299,
  author       = {Pith},
  title        = {Pith review of: Homogeneous Analysis of Hot Earths: Masses, Sizes, and Compositions},
  year         = {2026},
  howpublished = {\url{https://pith.science/paper/TG3OXKRY}},
  note         = {Machine review of arXiv:1908.06299}
}
abstract
Terrestrial planets have been found orbiting Sun-like stars with extremely short periods --- some as short as 4 hours. These "ultra-short-period planets" or "hot Earths" are so strongly irradiated that any initial H/He atmosphere has probably been lost to photoevaporation. As such, the sample of hot Earths may give us a glimpse at the rocky cores that are often enshrouded by thick H/He envelopes on wider-orbiting planets. However, the mass and radius measurements of hot Earths have been derived from a hodgepodge of different modeling approaches, and include several cases of contradictory results. Here, we perform a homogeneous analysis of the complete sample of 11 known hot Earths with an insolation exceeding 650 times that of the Earth. We combine all available data for each planet, incorporate parallax information from {\it Gaia} to improve the stellar and planetary parameters, and use Gaussian Process regression to account for correlated noise in the radial-velocity data. The homogeneous analysis leads to a smaller dispersion in the apparent composition of hot Earths, although there does still appear to be some intrinsic dispersion. Most of the planets are consistent with an Earth-like composition (35\% iron and 65\% rock), but two planets (K2-141b and K2-229b) show evidence for a higher iron fraction, and one planet (55\,Cnc\,e) has either a very low iron fraction or an envelope of low-density volatiles. All of the planets are less massive than 8\,$M_\oplus$, despite the selection bias towards more massive planets, suggesting that 8\,$M_\oplus$ is the critical mass for runaway accretion.
Figures

Reference graph
Works this paper leans on
-
[1]
, " * write output.state after.block = add.period write newline
ENTRY address archivePrefix author booktitle chapter doi edition editor eprint howpublished institution journal key month note number organization pages publisher school series title misctitle type volume year version url label extra.label sort.label short.list INTEGERS output.state before.all mid.sentence after.sentence after.block FUNCTION init.state.co...
-
[2]
write newline
" write newline "" before.all 'output.state := FUNCTION format.doi doi empty "" "doi:" doi * if FUNCTION format.url url empty "" new.block "" url * "" * if FUNCTION format.eprint eprint empty "" archivePrefix empty "" archivePrefix ":" * if eprint field.or.null * if FUNCTION format.pid eprint empty format.doi format.eprint if FUNCTION n.dashify 't := "" t...
-
[3]
main" (lambda () (LaTeX-add-bibitems
thebibliography [1] 20pt to REFERENCES 6pt =0pt 10pt plus 3pt =0pt =0pt =1pt plus 1pt =0pt =0pt -12pt =13pt plus 1pt =20pt =13pt plus 1pt \@M =10000 =-1.0em =0pt =0pt 0pt =0pt =1.0em @enumiv\@empty 10000 10000 `\.\@m \@noitemerr \@latex@warning Empty `thebibliography' environment \@ifnextchar \@reference \@latexerr Missing key on reference command Each re...
- [4]
-
[5]
Bailer-Jones , C. A. L., Rybizki , J., Fouesneau , M., Mantelet , G., & Andrae , R. 2018, , 156, 58
2018
- [6]
-
[7]
C., Vanderburg , A., Adams , F
Becker , J. C., Vanderburg , A., Adams , F. C., Rappaport , S. A., & Schwengeler , H. M. 2015, , 812, L18
work page 2015
-
[8]
Benz , W., Anic , A., Horner , J., & Whitby , J. A. 2008, The Origin of Mercury , ed. A. Balogh , L. Ksanfomality , & R. von Steiger , 7
work page 2008
Show all 72 references
-
[9]
S., Zeng , L., Damasso , M., et al
Bonomo , A. S., Zeng , L., Damasso , M., et al. 2019, Nature Astronomy, 3, 416
2019
-
[10]
2018, , 619, A1
Bourrier , V., Dumusque , X., Dorn , C., et al. 2018, , 619, A1
2018
-
[11]
L., Vanderburg , A., Burt , J., et al
Christiansen , J. L., Vanderburg , A., Burt , J., et al. 2017, , 154, 122
2017
-
[12]
Dai , F., Masuda , K., & Winn , J. N. 2018, , 864, L38
2018
-
[13]
N., Gandolfi , D., et al
Dai , F., Winn , J. N., Gandolfi , D., et al. 2017, , 154, 226
2017
-
[14]
2016, , 532, 207
Demory , B.-O., Gillon , M., de Wit , J., et al. 2016, , 532, 207
2016
-
[15]
Dorn , C., Harrison , J. H. D., Bonsor , A., & Hands , T. O. 2019, , 484, 712
2019
-
[16]
2016, , 222, 8
Dotter , A. 2016, , 222, 8
2016
-
[17]
D., Charbonneau , D., Dumusque , X., et al
Dressing , C. D., Charbonneau , D., Dumusque , X., et al. 2015, , 800, 135
2015
-
[18]
S., Haywood , R
Dumusque , X., Bonomo , A. S., Haywood , R. D., et al. 2014, , 789, 154
2014
-
[19]
S., & Agol , E
Eastman , J., Gaudi , B. S., & Agol , E. 2013, , 125, 83
2013
-
[20]
W., Lang , D., & Goodman , J
Foreman-Mackey , D., Hogg , D. W., Lang , D., & Goodman , J. 2013, , 125, 306
2013
-
[21]
J., & Petigura , E
Fulton , B. J., & Petigura , E. A. 2018, , 156, 264
2018
-
[22]
J., Petigura , E
Fulton , B. J., Petigura , E. A., Howard , A. W., et al. 2017, , 154, 109
2017
-
[23]
Gaia Collaboration , Brown , A. G. A., Vallenari , A., et al. 2018, , 616, A1
2018
-
[24]
P., et al
Gandolfi , D., Barrag \'a n , O., Hatzes , A. P., et al. 2017, , 154, 123
2017
-
[25]
2017, , 469, 278
Ginzburg , S., & Sari , R. 2017, , 469, 278
2017
-
[26]
M., Schlafly , E
Green , G. M., Schlafly , E. F., Finkbeiner , D., et al. 2018, , 478, 651
2018
-
[27]
W., Barrag \'a n , O., Dai , F., et al
Guenther , E. W., Barrag \'a n , O., Dai , F., et al. 2017, , 608, A93
2017
-
[28]
A., Margot, J.-L., Solomon, S
Hauck II, S. A., Margot, J.-L., Solomon, S. C., et al. 2013, Journal of Geophysical Research: Planets, 118, 1204. https://agupubs.onlinelibrary.wiley.com/doi/abs/10.1002/jgre.20091
2013 doi
-
[29]
D., Collier Cameron , A., Queloz , D., et al
Haywood , R. D., Collier Cameron , A., Queloz , D., et al. 2014, , 443, 2517
2014
-
[30]
W., Sanchis-Ojeda , R., Marcy , G
Howard , A. W., Sanchis-Ojeda , R., Marcy , G. W., et al. 2013, , 503, 381
2013
-
[31]
2006, , 451, 951
Isella , A., Testi , L., & Natta , A. 2006, , 451, 951
2006
-
[32]
R., Blunt , S., L \'o pez-Morales , M., et al
Kosiarek , M. R., Blunt , S., L \'o pez-Morales , M., et al. 2019, , 157, 116
2019
-
[33]
2015, , 127, 1161
Kreidberg , L. 2015, , 127, 1161
2015
-
[34]
2009, , 506, 399
Lammer , H., Odert , P., Leitzinger , M., et al. 2009, , 506, 399
2009
-
[35]
J., & Chiang , E
Lee , E. J., & Chiang , E. 2016, , 817, 90
2016
-
[36]
2017, , 842, 40
---. 2017, , 842, 40
2017
-
[37]
2009, , 506, 287
L \'e ger , A., Rouan , D., Schneider , J., et al. 2009, , 506, 287
2009
-
[38]
Lewis, J. S. 1972, Earth and Planetary Science Letters, 15, 286 . http://www.sciencedirect.com/science/article/pii/0012821X72901744
1972
-
[39]
Lopez , E. D. 2017, , 472, 245
2017
-
[40]
S., Kjeldsen , H., Albrecht , S., et al
Lundkvist , M. S., Kjeldsen , H., Albrecht , S., et al. 2016, Nature Communications, 7, 11201
2016
-
[41]
W., Louden , T., et al
Malavolta , L., Mayo , A. W., Louden , T., et al. 2018, , 155, 107
2018
-
[42]
Morton , T. D. 2015, isochrones: Stellar model grid package , Astrophysics Source Code Library, , , ascl:1503.010
2015
-
[43]
2017, , 154, 266
Niraula , P., Redfield , S., Dai , F., et al. 2017, , 154, 266
2017
-
[44]
2018, , 234, 9
Ofir , A., Xie , J.-W., Jiang , C.-F., Sari , R., & Aharonson , O. 2018, , 234, 9
2018
-
[45]
E., & Wu , Y
Owen , J. E., & Wu , Y. 2017, , 847, 29
2017
-
[46]
2011, , 192, 3
Paxton , B., Bildsten , L., Dotter , A., et al. 2011, , 192, 3
2011
-
[47]
C., Latham , D
Pepe , F., Cameron , A. C., Latham , D. W., et al. 2013, , 503, 377
2013
-
[48]
A., Marcy , G
Petigura , E. A., Marcy , G. W., Winn , J. N., et al. 2018, , 155, 89
2018
-
[49]
2018, , 618, A116
Prieto-Arranz , J., Palle , E., Gandolfi , D., et al. 2018, , 618, A116
2018
-
[50]
Rafikov , R. R. 2006, , 648, 666
2006
-
[51]
2019, , 484, 3731
Rice , K., Malavolta , L., Mayo , A., et al. 2019, , 484, 3731
2019
-
[52]
R., Winn , J
Ricker , G. R., Winn , J. N., Vanderspek , R., et al. 2014, in Society of Photo-Optical Instrumentation Engineers (SPIE) Conference Series, Vol. 9143, Space Telescopes and Instrumentation 2014: Optical, Infrared, and Millimeter Wave, 914320
2014
-
[53]
Rogers , L. A. 2015, , 801, 41
2015
-
[54]
N., et al
Sanchis-Ojeda , R., Rappaport , S., Winn , J. N., et al. 2014, , 787, 47
2014
-
[55]
2013, , 774, 54
---. 2013, , 774, 54
2013
-
[56]
J., et al
Santerne , A., Brugger , B., Armstrong , D. J., et al. 2018, Nature Astronomy, 2, 393
2018
-
[57]
W., Petigura , E
Sinukoff , E., Howard , A. W., Petigura , E. A., et al. 2017, , 153, 271
2017
-
[58]
F., Cutri , R
Skrutskie , M. F., Cutri , R. M., Stiening , R., et al. 2006, , 131, 1163
2006
-
[59]
2008, , 386, 1644
Southworth , J. 2008, , 386, 1644
2008
-
[60]
2009, , 394, 272
---. 2009, , 394, 272
2009
-
[61]
K., Wang , S., Wolfgang , A., et al
Teske , J. K., Wang , S., Wolfgang , A., et al. 2018, , 155, 148
2018
-
[62]
A., Sozzetti , A., et al
Torres , G., Fischer , D. A., Sozzetti , A., et al. 2012, , 757, 161
2012
-
[63]
A., Marchant , P., & Rogers , L
Valsecchi , F., Rappaport , S., Rasio , F. A., Marchant , P., & Rogers , L. A. 2015, , 813, 101
2015
-
[64]
C., Buchhave , L
Vanderburg , A., Becker , J. C., Buchhave , L. A., et al. 2017, , 154, 237
2017
-
[65]
2017, ArXiv e-prints, arXiv:1710.03826
Wang , L., & Dai , F. 2017, ArXiv e-prints, arXiv:1710.03826
2017 arXiv
-
[66]
G., Gillen , E., Bayliss , D., et al
West , R. G., Gillen , E., Bayliss , D., et al. 2018, arXiv e-prints, arXiv:1809.00678
2018 arXiv
-
[67]
N., Sanchis-Ojeda , R., & Rappaport , S
Winn , J. N., Sanchis-Ojeda , R., & Rappaport , S. 2018, ArXiv e-prints, arXiv:1803.03303
2018 arXiv
-
[68]
N., Sanchis-Ojeda , R., Rogers , L., et al
Winn , J. N., Sanchis-Ojeda , R., Rogers , L., et al. 2017, , 154, 60
2017
-
[69]
2013, , 769, 78
Wurm , G., Trieloff , M., & Rauer , H. 2013, , 769, 78
2013
-
[70]
W., Petigura , E
Yee , S. W., Petigura , E. A., & von Braun , K. 2017, , 836, 77
2017
-
[71]
D., & Jacobsen , S
Zeng , L., Sasselov , D. D., & Jacobsen , S. B. 2016, , 819, 127
2016
-
[72]
B., Sasselov, D
Zeng, L., Jacobsen, S. B., Sasselov, D. D., et al. 2019, Proceedings of the National Academy of Sciences, 116, 9723. https://www.pnas.org/content/116/20/9723
2019
Reviewed August 14, 2026 · model on record in the stance chip above.
Discussion (0). Continue with ORCID to comment.