REVIEW 3 major objections 6 minor 47 references
Benchmarks for Graph Embedding Evaluation
T0 review · 3 major / 6 minor · reviewed 2026-08-14 · deepseek-v4-flash
Pith's one-line read Graph embedding methods, led by SDNE, outperform traditional link-prediction heuristics across a 100-graph benchmark, and the paper's GFS-score turns that comparison into a reusable ranking.
desk verdict A useful benchmark resource with a credible broad claim, but the headline GFS-score table is missing the protocol details needed to reproduce it. read the letter →
The pith
A machine-rendered reading of the paper's core claim, the machinery that carries it, and where it could break.
The reading
What carries the argument
The load-bearing object is GFS-score, a normalized evaluation score that divides a method's link-prediction performance, measured by MAP or P@100, by the performance of a random predictor and averages the ratio over a set of graphs. It has micro, macro, and per-domain variants, so one number ranks methods while the domain components show where the advantage comes from. The supporting machinery is the benchmark itself: 100 real-world graphs with varied size (200 to 1500 nodes), density, diameter, and clustering, grouped into four domains, evaluated with two complementary metrics that capture global and local prediction quality.
What would settle it
Run the same eight methods on a held-out set of large real networks that are not in the benchmark corpus, with per-method hyperparameter tuning; if traditional heuristics match or beat the embedding methods on average, the claim that embeddings outperform traditional methods is refuted.
Extended reading notes
Core claim
On the paper's own terms, the discovery is that graph embedding methods reliably outperform traditional non-parametric link-prediction heuristics across a broad corpus. Averaged over 100 real graphs and normalized by a random predictor, the best embedding method, SDNE, achieves a micro-GFS MAP score of 11.0, compared with 2.8 for Common Neighbors, and a macro-GFS MAP score of 10.1 against 4.8 for the best heuristic. The margin is domain-dependent: traditional heuristics still do well on social graphs, while economic graphs, which lack community structure, defeat the heuristics almost entirely and favor SDNE. HOPE, which preserves higher-order proximity, takes the top P@100 score in biology and social domains. The paper argues that GFS-score, with micro, macro, and per-domain components, is a principled way to rank existing and future methods and to expose which graph properties each method exploits.
Load-bearing premise
The rankings depend on the 100 benchmark graphs being representative: if the sampled versions of large social graphs distort degree distributions, community structure, or diameter, the GFS-scores will not transfer to the original networks or to other graph families.
Editorial extensions
If this is right
- Someone with a new graph can use per-domain GFS-scores to pick an embedding method instead of testing all candidates, because the paper finds performance is consistent within a domain.
- Future embedding methods can be plugged into the accompanying open-source library and compared on the same 100 graphs with the same random-normalized score, replacing ad hoc claims of improvement on a few datasets.
- The failure of traditional heuristics on economic graphs implies that methods capturing non-local structure, not just neighborhood overlap, are necessary for link prediction in domains without clear community structure.
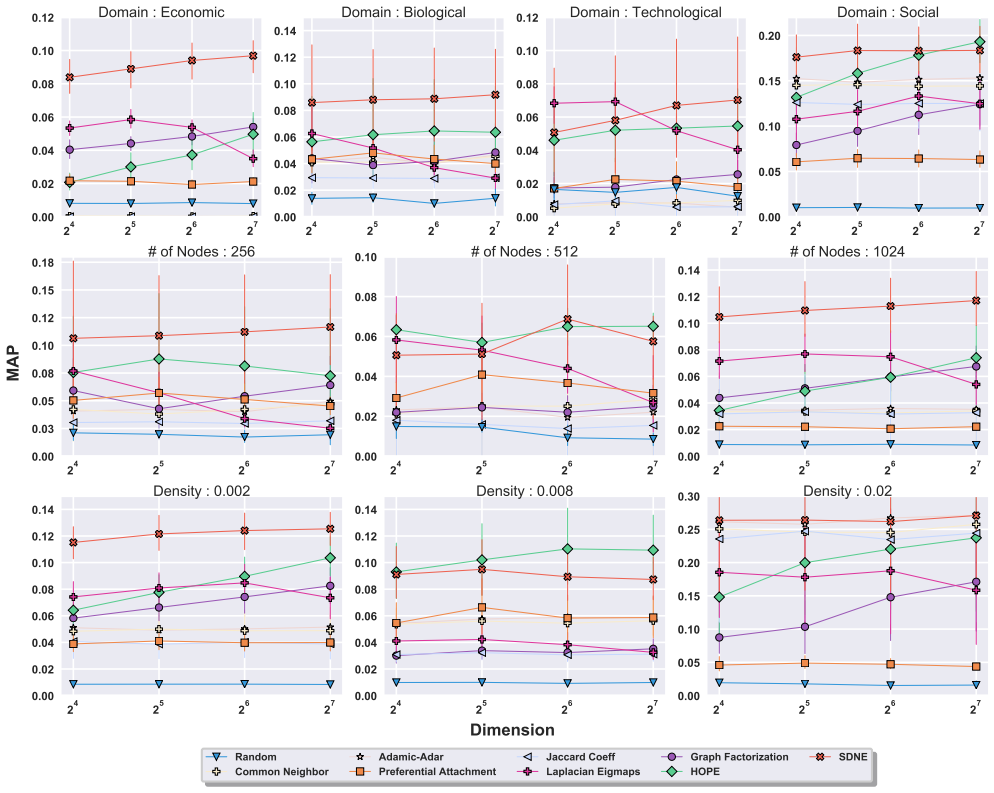
- Embedding dimension is not neutral: SDNE improves as dimensions rise while Laplacian Eigenmaps overfits, so fair comparisons must report and justify dimension.
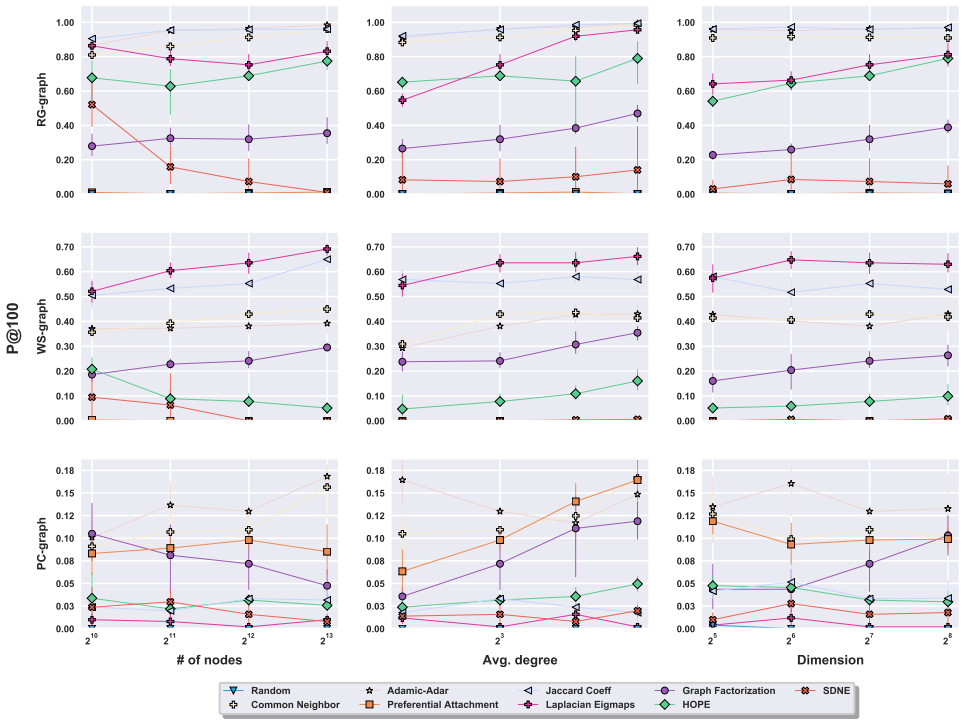
- The synthetic-graph results show simple generated graphs are not a substitute for real benchmarks, since classic heuristics can beat embeddings when the generator's structure matches the heuristic.
Reading between the lines
- A natural extension the authors leave implicit is to turn GFS-score into a recommender: fit a model from cheap graph statistics (density, diameter, clustering coefficient) to the best-performing method, then predict the right embedding for an unseen graph without running every method.
- Because only four embedding methods are ranked, the leaderboard is a snapshot; applying the same framework to newer neural link predictors could reorder the top ranks without changing the framework's validity.
- Since GFS-score is a ratio to a random baseline, reporting absolute MAP and P@100 alongside the ratio would make the comparison more informative for graphs where the random baseline is very weak.
- A concrete experiment suggested by the appendix: generate graphs that combine community structure with power-law degree distributions and check whether embedding methods regain the advantage they hold on real networks, which would identify the structural driver of that advantage.
Signed reviews
Editorial analysis
A structured set of objections, weighed in public.
Referee Report
Summary. The paper introduces GEM-BEN, a benchmark for evaluating graph embedding methods on link prediction. It assembles a corpus of 100 real-world graphs, mostly from CommunityFitNet with additions from SNAP, grouped into social, biological, economic, and technological domains. The paper evaluates four graph embedding methods (Laplacian Eigenmaps, Graph Factorization, HOPE, SDNE) and four traditional link prediction baselines (Preferential Attachment, Common Neighbors, Jaccard Coefficient, Adamic-Adar) using MAP and P@100. It proposes a GFS-score, defined as the average over graphs of the ratio between a method's performance and a random baseline, with micro, macro, and per-domain variants. The central empirical claim is that graph embedding approaches outperform traditional link prediction methods across the benchmark, with SDNE generally ranked first. The paper also analyzes sensitivity to graph size, density, and embedding dimension, and documents a Python library implementing the benchmark.
Significance. If the results are made reproducible, the benchmark and the GFS-score would be a useful community resource for comparing graph embedding methods on a broader set of real networks than is typical in the literature. The release of the gemben library and the explicit goal of supporting evaluation of future methods are concrete strengths. The paper also provides falsifiable aggregate rankings across domains and metrics. However, the central quantitative claim currently rests on several unstated experimental choices, so the significance is conditional on completing the methodological specification.
major comments (3)
- [Section 3.3, Eq. (1), Table 2] Table 2 is titled 'Average and standard deviation of GFS-score' but no standard deviations are reported anywhere in the table or text. For example, the paper states SDNE beats HOPE by a large margin on micro-GFS MAP (11.0 vs 6.1), but without the spread across graphs the reader cannot judge whether this difference is stable or driven by a few graphs. Please report standard deviations or per-graph score distributions for the GFS values.
- [Section 3.1 and Section 3.2] The link prediction protocol is underspecified. The paper does not state how many edges are hidden for testing, how negative samples are generated, what the positive-to-negative ratio is, whether P@100 is computed over all nodes or a sample, or whether the same train/test splits are used for every method. Since the definition of em(g, a) in Eq. (1) depends on these choices, the GFS-score is not uniquely defined by the text, and protocol differences can affect the comparison between embedding methods and heuristics. Please describe the exact evaluation protocol, including any random seed and number of runs.
- [Section 3.1] The benchmark uses Induced Subgraph Random Walk Sampling (ISRW) to sample 'some huge social graphs while keeping the same graph density,' but it does not say which graphs were sampled, what sampling parameters were used, or whether the induced subgraphs preserve the properties relevant to embedding performance such as degree distribution, community structure, and diameter. Since the GFS-score averages over these graphs, any distortion introduced by sampling affects the external validity of the ranking for the original large networks. Please list the sampled graphs and provide a comparison of key structural properties before and after sampling.
minor comments (6)
- [Section 1.3] The text reads 'an and overview of graph embeddings'; this should be 'an overview of graph embeddings.'
- [Section 3.1] The sentence 'We use Induced Subgraph Random Walk Sampling (ISRW) to sample some huge social graphs while keeping the same graph density to ensure' is incomplete and should be finished.
- [Section 3] There is a typo in the phrase 'the bias of the embedding method towards specific nodes int he graph'; 'int he' should be 'in the.'
- [Figures 2 and 3] These figures would benefit from error bars or shaded confidence bands; the text states observations about consistent performance and low variance, but the plots show single curves without dispersion information.
- [Appendix, Section 6.2 vs 6.3] The appendix first describes ten synthetic graph generators but Section 6.3 refers to 'eleven synthetic graph datasets'; this inconsistency should be corrected.
- [Section 1.2 and Section 3.5] The paper calls '8 state-of-the-art methods' in the contributions, but only four are graph embedding methods and the other four are traditional heuristics; the wording should distinguish 'methods' from 'baselines.'
Circularity Check
No significant circularity: GFS-score is a direct empirical average of measured normalized link-prediction scores, and the paper's conclusions are aggregates of those measurements rather than products of fitted parameters or self-citations.
full rationale
The paper's central quantitative object, the GFS-score in Eqs. (1)-(3), is defined directly as the average, over the benchmark graphs, of em(g, a)/em(g, random) for each approach and metric. This is an empirical aggregation of measured link-prediction scores, not a parameter fitted to make a particular ranking emerge. The conclusion that 'graph embedding approaches outperform traditional methods on a variety of different graphs' is drawn from the measured values in Table 2, and the GFS-score itself is presented as a reusable normalization with respect to a random baseline. No equation in the paper defines the embedding methods in terms of the GFS-score, and no ranking is used to construct the score. The cited works by the authors are background references only: [6] is a survey used for organizing embedding methods into categories, and [38] is mentioned in the appendix as one example of synthetic-graph evaluation; neither supplies a load-bearing premise or an imported uniqueness result. The absence of a stated embedding dimension for Table 2 and the missing standard deviations are reproducibility and reporting shortcomings, not circularity: they do not mean the reported scores are equivalent to their inputs by construction. The appendix's synthetic-graph results, where heuristic methods sometimes beat embeddings, further confirm that the main real-graph conclusion is an empirical finding rather than a tautology. The derivation chain is therefore self-contained and not circular.
Assumptions & free parameters
free parameters (1)
- Embedding dimension used to compute GFS-score =
not reported
assumptions (4)
- domain assumption Link prediction performance measured by MAP and P@100 is a sufficient proxy for overall graph embedding quality.
- domain assumption The 100 graphs, dominated by CommunityFitNet and restricted to 200-1500 nodes, are representative of real-world graphs across the four domains.
- domain assumption ISRW sampling preserves the graph properties that affect embedding quality when large social graphs are reduced to subgraphs.
- domain assumption The random baseline is a valid normalization across graphs of very different sizes and densities.
invented entities (1)
-
GFS-score
Cite this review
Pith. "Pith review of Benchmarks for Graph Embedding Evaluation." pith.science (2026). https://pith.science/paper/M6Y3DPKA
@misc{pith2026190806543,
  author       = {Pith},
  title        = {Pith review of: Benchmarks for Graph Embedding Evaluation},
  year         = {2026},
  howpublished = {\url{https://pith.science/paper/M6Y3DPKA}},
  note         = {Machine review of arXiv:1908.06543}
}
read the original abstract
Graph embedding is the task of representing nodes of a graph in a low-dimensional space and its applications for graph tasks have gained significant traction in academia and industry. The primary difference among the many recently proposed graph embedding methods is the way they preserve the inherent properties of the graphs. However, in practice, comparing these methods is very challenging. The majority of methods report performance boosts on few selected real graphs. Therefore, it is difficult to generalize these performance improvements to other types of graphs. Given a graph, it is currently impossible to quantify the advantages of one approach over another. In this work, we introduce a principled framework to compare graph embedding methods. Our goal is threefold: (i) provide a unifying framework for comparing the performance of various graph embedding methods, (ii) establish a benchmark with real-world graphs that exhibit different structural properties, and (iii) provide users with a tool to identify the best graph embedding method for their data. This paper evaluates 4 of the most influential graph embedding methods and 4 traditional link prediction methods against a corpus of 100 real-world networks with varying properties. We organize the 100 networks in terms of their properties to get a better understanding of the embedding performance of these popular methods. We use the comparisons on our 100 benchmark graphs to define GFS-score, that can be applied to any embedding method to quantify its performance. We rank the state-of-the-art embedding approaches using the GFS-score and show that it can be used to understand and evaluate novel embedding approaches. We envision that the proposed framework (https://www.github.com/palash1992/GEM-Benchmark) will serve the community as a benchmarking platform to test and compare the performance of future graph embedding techniques.
Figures


Figures from the paper (4 more)


Reference graph
Works this paper leans on
-
[1]
M. E. Newman, Clustering and preferential attachment in growing net- works, Physical review E 64 (2) (2001) 025102
work page 2001
-
[2]
L. A. Adamic, E. Adar, Friends and neighbors on the web, Social net- works 25 (3) (2003) 211–230
work page 2003
- [3]
-
[4]
A. Thor, P. Anderson, L. Raschid, S. Navlakha, B. Saha, S. Khuller, X.-N. Zhang, Link prediction for annotation graphs using graph summarization, in: International Semantic Web Conference, Springer, 2011, pp. 714–729
work page 2011
-
[5]
M. Kim, J. Leskovec, The network completion problem: Inferring miss- ing nodes and edges in networks, in: Proceedings of the 2011 SIAM In- ternational Conference on Data Mining, SIAM, 2011, pp. 47–58
work page 2011
- [6]
-
[7]
W. L. Hamilton, R. Ying, J. Leskovec, Representation learning on graphs: Methods and applications, arXiv preprint arXiv:1709.05584
-
[8]
H. Cai, V . W. Zheng, K. C.-C. Chang, A comprehensive survey of graph embedding: Problems, techniques, and applications, IEEE Transactions on Knowledge and Data Engineering 30 (9) (2018) 1616–1637
work page 2018
Show all 47 references
-
[9]
Ahmed, N
A. Ahmed, N. Shervashidze, S. Narayanamurthy, V . Josifovski, A. J. Smola, Distributed large-scale natural graph factorization, in: Proceed- ings of the 22nd international conference on World Wide Web, ACM, 2013, pp. 37–48
2013
-
[10]
D. Wang, P. Cui, W. Zhu, Structural deep network embedding, in: Pro- ceedings of the 22nd International Conference on Knowledge Discovery and Data Mining, ACM, 2016, pp. 1225–1234
2016
-
[11]
Grover, J
A. Grover, J. Leskovec, node2vec: Scalable feature learning for networks, in: Proceedings of the 22nd International Conference on Knowledge Dis- covery and Data Mining, ACM, 2016, pp. 855–864
2016
-
[12]
Salehi Rizi, M
F. Salehi Rizi, M. Granitzer, K. Ziegler, Properties of vector embeddings in social networks, Algorithms 10 (4) (2017) 109
2017
-
[13]
Ghasemian, H
A. Ghasemian, H. Hosseinmardi, A. Clauset, Evaluating overfit and un- derfit in models of network community structure, IEEE Trans. Knowledge and Data Engineering (TKDE)In press
-
[14]
Leskovec, R
J. Leskovec, R. Sosi ˇc, Snap: A general-purpose network analysis and graph-mining library, ACM Transactions on Intelligent Systems and Technology (TIST) 8 (1) (2016) 1
2016
-
[15]
Clauset, E
A. Clauset, E. Tucker, M. Sainz, The Colorado Index of Complex Net- works. (2016)
2016
-
[16]
S. T. Roweis, L. K. Saul, Nonlinear dimensionality reduction by locally linear embedding, Science 290 (5500) (2000) 2323–2326
2000
-
[17]
Belkin, P
M. Belkin, P. Niyogi, Laplacian eigenmaps and spectral techniques for embedding and clustering, in: NIPS, V ol. 14, 2001, pp. 585–591
2001
-
[18]
B. Shaw, T. Jebara, Structure preserving embedding, in: Proceedings of the 26th Annual International Conference on Machine Learning, ACM, 2009, pp. 937–944
2009
-
[19]
D. Luo, F. Nie, H. Huang, C. H. Ding, Cauchy graph embedding, in: Proceedings of the 28th International Conference on Machine Learning (ICML-11), 2011, pp. 553–560
2011
-
[20]
S. Cao, W. Lu, Q. Xu, Grarep: Learning graph representations with global structural information, in: Proceedings of the 24th ACM International on Conference on Information and Knowledge Management, ACM, 2015, pp. 891–900
2015
-
[21]
M. Ou, P. Cui, J. Pei, Z. Zhang, W. Zhu, Asymmetric transitivity preserv- ing graph embedding, in: Proc. of ACM SIGKDD, 2016, pp. 1105–1114
2016
-
[22]
Perozzi, R
B. Perozzi, R. Al-Rfou, S. Skiena, Deepwalk: Online learning of social representations, in: Proceedings 20th international conference on Knowl- edge discovery and data mining, 2014, pp. 701–710
2014
-
[23]
J. Tang, M. Qu, M. Wang, M. Zhang, J. Yan, Q. Mei, Line: Large-scale information network embedding, in: Proceedings 24th International Con- ference on World Wide Web, 2015, pp. 1067–1077
2015
-
[24]
H. Chen, B. Perozzi, Y . Hu, S. Skiena, Harp: Hierarchical representation learning for networks, arXiv preprint arXiv:1706.07845
-
[25]
Perozzi, V
B. Perozzi, V . Kulkarni, S. Skiena, Walklets: Multiscale graph embeddings for interpretable network classification, arXiv preprint arXiv:1605.02115
-
[26]
S. Cao, W. Lu, Q. Xu, Deep neural networks for learning graph represen- tations, in: Proceedings of the Thirtieth AAAI Conference on Artificial Intelligence, AAAI Press, 2016, pp. 1145–1152
2016
-
[27]
Bruna, W
J. Bruna, W. Zaremba, A. Szlam, Y . LeCun, Spectral networks and locally connected networks on graphs, arXiv preprint arXiv:1312.6203
-
[28]
Hena ff, J
M. Hena ff, J. Bruna, Y . LeCun, Deep convolutional networks on graph- structured data, arXiv preprint arXiv:1506.05163
-
[29]
Y . Li, D. Tarlow, M. Brockschmidt, R. Zemel, Gated graph sequence neu- ral networks, arXiv preprint arXiv:1511.05493
-
[30]
W. L. Hamilton, R. Ying, J. Leskovec, Inductive representation learning on large graphs, arXiv preprint arXiv:1706.02216
-
[31]
Zhang, Y
M. Zhang, Y . Chen, Link prediction based on graph neural networks, in: Advances in Neural Information Processing Systems, 2018, pp. 5165– 5175
2018
-
[32]
Z. Ying, J. You, C. Morris, X. Ren, W. Hamilton, J. Leskovec, Hierar- chical graph representation learning with di fferentiable pooling, in: Ad- vances in Neural Information Processing Systems, 2018, pp. 4800–4810
2018
-
[33]
T. N. Kipf, M. Welling, Variational graph auto-encoders, arXiv preprint arXiv:1611.07308
-
[34]
Lancichinetti, S
A. Lancichinetti, S. Fortunato, F. Radicchi, Benchmark graphs for test- ing community detection algorithms, Physical review E 78 (4) (2008) 046110
2008
-
[35]
X. Lu, S. Bressan, Sampling connected induced subgraphs uniformly at random, in: International Conference on Scientific and Statistical Database Management, Springer, 2012, pp. 195–212
2012
-
[36]
Barab ´asi, R
A.-L. Barab ´asi, R. Albert, Emergence of scaling in random networks, sci- ence 286 (5439) (1999) 509–512
1999
-
[37]
Jaccard, Nouvelles recherches sur la distribution florale, Bull
P. Jaccard, Nouvelles recherches sur la distribution florale, Bull. Soc. Vaud. Sci. Nat. 44 (1908) 223–270
1908
-
[38]
Goyal, S
P. Goyal, S. R. Chhetri, A. Canedo, dyngraph2vec: Capturing network dy- namics using dynamic graph representation learning, Knowledge-Based Systems
-
[39]
Penrose, et al., Random geometric graphs, V ol
M. Penrose, et al., Random geometric graphs, V ol. 5, Oxford university press, 2003
2003
-
[40]
B. M. Waxman, Routing of multipoint connections, IEEE journal on se- lected areas in communications 6 (9) (1988) 1617–1622
1988
-
[41]
Y . J. Wang, G. Y . Wong, Stochastic blockmodels for directed graphs, Jour- nal of the American Statistical Association 82 (397) (1987) 8–19
1987
-
[42]
D. J. Watts, S. H. Strogatz, Collective dynamics of small-worldnetworks, nature 393 (6684) (1998) 440
1998
-
[43]
Ispolatov, P
I. Ispolatov, P. Krapivsky, A. Yuryev, Duplication-divergence model of protein interaction network, Physical review E 71 (6) (2005) 061911
2005
-
[44]
Holme, B
P. Holme, B. J. Kim, Growing scale-free networks with tunable clustering, Physical review E 65 (2) (2002) 026107
2002
-
[45]
Leskovec, D
J. Leskovec, D. Chakrabarti, J. Kleinberg, C. Faloutsos, Z. Ghahramani, Kronecker graphs: An approach to modeling networks, Journal of Ma- chine Learning Research 11 (Feb) (2010) 985–1042. 13 0.00 0.02 0.04 0.06 0.08 0.10 0.12 0.14 social 0.00 0.02 0.04 0.06 0.08 0.10 0.12 0.1...
2010
-
[46]
Chakrabarti, Y
D. Chakrabarti, Y . Zhan, C. Faloutsos, R-mat: A recursive model for graph mining, in: Proceedings of the 2004 SIAM International Confer- ence on Data Mining, SIAM, 2004, pp. 442–446
2004
-
[47]
Krioukov, F
D. Krioukov, F. Papadopoulos, M. Kitsak, A. Vahdat, M. Bogun´a, Hyper- bolic geometry of complex networks, Physical Review E 82 (3) (2010) 036106. 18
2010
Reviewed August 14, 2026 · model on record in the stance chip above.
Discussion (0). Continue with ORCID to comment.