REVIEW 4 major objections 4 minor 29 references
Advanced Mathematical Business Strategy Formulation Design
T0 review · 4 major / 4 minor · reviewed 2026-08-14 · deepseek-v4-flash
Pith's one-line read A stochastic first-exceed model computes the best moment to shift strategy in a 2x2 matrix.
desk verdict A straightforward relabeling of the first-exceed model with a superficial BCG example, no proofs, and assumptions that real market data do not satisfy; not a new mathematical result. read the letter →
The pith
A machine-rendered reading of the paper's core claim, the machinery that carries it, and where it could break.
The reading
What carries the argument
The first exceed model: a fluctuation-theory construction that stops a random process at the first observation epoch at which a component reaches or passes its assigned threshold, and also records the state one epoch before that crossing. The machinery consists of the delayed renewal observation process, two marked Poisson compound increment processes for the decision parameters, and the exit index (the counting index of the first crossing). The operator calculus of the first exceed model converts the joint transform of the exit indices into explicit probability generating functions, so the expected shift moments follow by differentiation.
What would settle it
Take observed series of market share and market growth for a set of products, estimate the increments, and test whether the increments are independent, nonnegative, and Poisson-compound and whether the observation intervals are memoryless. Then compare the empirical threshold-crossing times with the expected exit indices from Lemmas 1 and 2: systematic disagreement, or any observed decrease in a decision parameter before a shift, would falsify the model's timing predictions in practice.
Extended reading notes
Core claim
The paper establishes a closed-form expression for the strategy-shift index in a quantitative 2x2 strategy matrix. It models the two decision parameters as marked Poisson compound processes $A_m$ and $B_n$, observes them at the epochs of a delayed renewal process $\gamma$, and defines exit indices $\mu=\inf\{n: A_n \ge \theta_A\}$ and $\nu=\inf\{n: B_n \ge \theta_B\}$. The joint functional $\Phi_{\gamma,\delta}(u,v)$ records the state of the process at the shift time and one observation epoch earlier. Theorem 1 gives an explicit formula for this functional, and Lemmas 1 and 2 extract the probability generating functions and expected values of $\mu$ and $\nu$. In the BCG application, with the relative-share threshold set at 1.5, these expected values are the optimal moments for shifting among Dogs, Cows, Stars, and Question Marks.
Load-bearing premise
The load-bearing premise is that each decision parameter evolves as a Poisson compound process with monotone nondecreasing increments and that observation times are memoryless; if real market share or growth can fall, jump in non-Poisson ways, or be observed with dependence on past values, the predicted optimal shifting times will not describe the actual process.
Editorial extensions
If this is right
- For any two quantitative decision parameters satisfying the model assumptions, the expected strategy-shift time for each parameter can be computed in closed form from the exit-index formulas.
- The best-strategy function makes the strategic choice a threshold rule: which of the four quadrants is best depends only on whether each parameter is above or below its threshold.
- The model gives not only the first-passage time but also the observation epoch one step before it, so a decision maker can be warned before a threshold is actually crossed.
- In the BCG application, the optimal moments for moving products among Dogs, Cows, Stars, and Question Marks follow from evaluating the exit-index expectations with the modified relative-share scale.
Reading between the lines
- A natural extension the paper leaves implicit is a backtest: compare historical strategy-change dates against the expected exit indices computed from the same data; systematic gaps would measure how far real decisions are from the model's optimal timing.
- The same first-exceed construction should transfer to other quantified 2x2 strategy grids, such as product-market or business-level strategy matrices, whenever their axes can be assigned thresholds.
- If the monotone Poisson assumption is relaxed to allow decreases and correlated increments, a numerical version of the same first-exceed functional would show how sensitive the optimal shift times are to those assumptions.
Signed reviews
Editorial analysis
A structured set of objections, weighed in public.
Referee Report
Summary. The paper proposes an analytical framework, based on fluctuation theory and the first-exceed model of Dshalalow, for determining the optimal moment to shift strategy in a 2x2 strategy matrix (such as the BCG growth-share matrix). Two decision parameters are modeled as compound Poisson processes observed at a delayed renewal process, and the exit index (the first observation epoch at which a threshold is crossed) is used to derive probability generating functions and expected shift moments. The model is then applied to the BCG matrix by transforming market share into a relative competitive position and assuming the decision parameters are monotone nondecreasing until a strategy shift. The paper claims the framework is adaptable to 'practically any' matrix-formulated strategic decision situation.
Significance. If the mathematical results were correctly derived and the modeling assumptions realistically satisfied, the paper would offer a novel quantitative tool for timing strategic decisions, bridging stochastic process theory and strategic management. The paper explicitly acknowledges the restrictiveness of its assumptions, which is a commendable sign of scientific caution. However, the significance is substantially undercut because the main theorems are stated without proof, the derivation is not self-contained, no numerical or empirical validation is provided, and the central BCG application rests on assumptions that are not justified for real market share and growth data. As it stands, the paper is an application sketch rather than a validated decision-support model.
major comments (4)
- [Section 3.1, Theorem 1 and Lemmas 1-2 (Eqs. 3.23, 3.42, 3.43)] Theorem 1 and Lemmas 1-2 are stated without proof. The text merely says that the expressions follow from earlier equations (e.g., 'From (3.138) and (3.23)-(3.24)'), but no derivation is supplied. These results are load-bearing: the subsequent moment formulas (3.52)-(3.54) and the entire BCG application depend on them. At minimum, the author must provide a complete proof or a detailed derivation that shows exactly how the operator-theoretic results of Dshalalow's first-exceed model are applied to the strategy matrix setting, including the precise conditions on the process that justify the functional equations.
- [Sections 3.4 and 4] The model requires that each decision parameter be a 'Poisson compound process' and, in the BCG application, that market share and growth rate are 'monotone nondecreasing until a strategy is shifted.' These are not reasonable assumptions for real market data: market share can decline, and growth rates can fall. The paper offers no empirical or theoretical justification that BCG inputs satisfy these conditions, nor does it discuss how the formulas would change if negative jumps or downward threshold crossings are allowed. Since the abstract claims the model can predict actual 'best moments of changing strategies,' this gap directly undermines the central claim. The author needs to either justify the assumptions for the proposed applications or substantially qualify the scope of the predictions.
- [Overall (no validation)] The paper contains no numerical, simulated, or real-data example that demonstrates how the formulas in (3.52)-(3.54) would be computed or used. Section 4 only restates the BCG mapping and refers back to earlier equations; it does not compute a single shift moment or compare the model's output with any actual decision. Given the complexity of the mathematical expressions, a concrete worked example (even with synthetic parameters) is essential to establish that the model is implementable and that the formulas yield finite, sensible values. Without such validation, the applicability claim remains unsupported.
- [Section 3.1, Eqs. (3.13)-(3.15)] The derivation is not self-contained. The paper imports the first-exceed model and its operator formalism (3.19)-(3.21) from prior work but does not adequately define the 'magical transform' in (3.15) or explain the inverse operator in (3.21). Several equation references are incorrect (e.g., (3.138) does not exist), and the notation is corrupted with nonprinting or misplaced symbols (e.g., in (3.1)-(3.12)). A reader cannot verify the steps without consulting multiple external references, which conflicts with the paper's goal of providing an 'explicit' strategy formulation. The author should rewrite the mathematical development in a self-contained, clearly typeset manner.
minor comments (4)
- [Section 1, Abstract] The abstract claims the model yields 'the explicit probability of the strategy shifting,' but the paper only provides probability generating functions for the exit indices, not explicit probabilities. The relationship between the PGFs and the probabilities should be clarified.
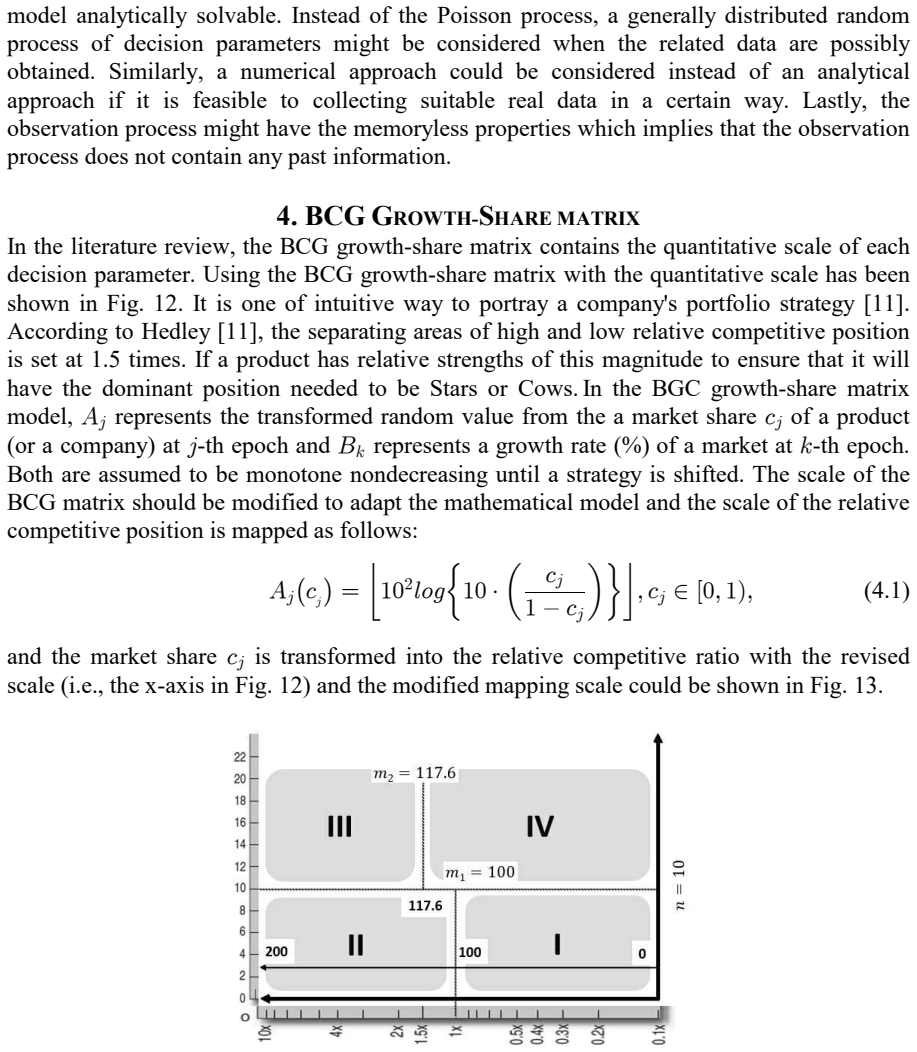
- [Section 4, Eq. (4.1) and Fig. 12] The transformation of market share into relative competitive position in (4.1) is not fully specified, and the thresholds used in the BSF rule (4.1) (e.g., 1.0) are not derived from the mapping. Please clarify how the quantitative scale is revised and how the thresholds are set in the BCG example.
- [Throughout] There are numerous typographical and typesetting issues: garbled equations (e.g., (3.42), (3.43) contain stray symbols), undefined notation (e.g., 'magical transform'), and missing figure references. The manuscript needs careful proofreading before it can be considered for publication.
- [Section 5, Conclusion] The conclusion restates the contributions without addressing the limitations that the paper itself acknowledges in Section 3.4, such as the mandatory Poisson-process assumption and the lack of numerical implementation. A more balanced conclusion would note these caveats.
Circularity Check
No circularity: the derivation explicitly imports Dshalalow's first-exceed model and applies it under stated assumptions; no fitted parameter is renamed as a prediction.
full rationale
The paper's mathematical core, Theorem 1 and the associated operators, is explicitly adopted from Dshalalow's first-exceed model (references [12-15]). This is an independent external source, not the authors' own prior claim or a fitted input. The model's assumptions (Poisson compound processes, monotone nondecreasing decision parameters, memoryless observation process) are stated as conditions in Sections 3.4 and 4, not as consequences of the predicted shift moments. The 'prediction' of optimal shifting moments is obtained by computing PGFs and expectations from those assumptions; this is a derivation, not a circular restatement of the inputs. The paper includes self-citations to the author's prior works on blockchain games and stochastic duels, but these are listed as applications of the same first-exceed model and are not load-bearing for the central theorem or the BCG application. No equation is defined directly in terms of the target output, and no empirical data are fitted and then called a prediction. The limitation that real market share and growth may not be monotone is a modeling concern, not a circularity. The paper is not fully self-contained because it relies on Dshalalow's results, but that reliance is transparent and externally grounded, so it does not raise the circularity score.
Assumptions & free parameters
free parameters (2)
- Thresholds u and v =
1.00 and 1.00 in the BCG example
- Poisson intensities lambda+ and lambda-
assumptions (4)
- standard math The first exceed model of Dshalalow provides the functional equations and inversion operators used in Theorem 1 and Lemmas 1-2.
- domain assumption Each decision parameter process is a marked Poisson process with independent increments.
- domain assumption The observation process is a delayed renewal process with memoryless properties.
- domain assumption Decision parameter increments are monotone nondecreasing until a strategy shift occurs.
Cite this review
Pith. "Pith review of Advanced Mathematical Business Strategy Formulation Design." pith.science (2026). https://pith.science/paper/XP4RT2EJ
@misc{pith2026190806890,
  author       = {Pith},
  title        = {Pith review of: Advanced Mathematical Business Strategy Formulation Design},
  year         = {2026},
  howpublished = {\url{https://pith.science/paper/XP4RT2EJ}},
  note         = {Machine review of arXiv:1908.06890}
}
read the original abstract
This paper deals with the explicit design of strategy formulations to make the best strategic choices from a conventional matrix form of representing strategic choices. The explicit strategy formulation is an analytical model which is targeted to provide a mathematical strategy framework to find the best moment for strategy shifting to prepare rapid market changes. This theoretical model could be adapted into practically any strategic decision making situation when a strategic formulation is described as a matrix form with quantitative measured decision parameters. Analytically tractable results are obtained by using the fluctuation theory and these results are capable to predict the best moments of changing strategies in a matrix form. This research helps strategy decision makers who want to find the optimal moments of shifting present strategies.
Figures


Figures from the paper (3 more)


Reference graph
Works this paper leans on
-
[1]
M. A. Hitt, R. D. Ireland, Concepts Strategic Management: Competitiveness & Globalization 9th Ed. (2011), South-Western Cengage Learning, Mason, OH
work page 2011
-
[2]
G. Johnson, R. Whittington and et. al., Exploring Strategy Text and Cases 11th Ed., Harlow, UK: Pearson, 2017
work page 2017
-
[3]
T. L. Wheelen and J. D. Hunger, Strategic Management and Business Policy 13th Ed. (2012), Pearson, Upper Saddle River, NJ
work page 2012
-
[4]
P. Juneja, Steps in Strategy Formulation Process (2019), Available online: https://www.managementstudyguide.com/strategy-formulation-process.htm
work page 2019
-
[5]
Salor Foundation, Strategy Formulation (2019), Available online: https://resources.saylor.org/wwwresources/archived/site/wp-content/uploads/2013/09/Saylor.orgs-Strategy- Formulation.pdf
work page 2019
-
[6]
Foresight Activities in the U.S.A.: Time for a Re-Assessment?
L. L. Lederman, "Foresight Activities in the U.S.A.: Time for a Re-Assessment?", Long Range Planning 17:3 (1984), pp. 41-50
work page 1984
-
[7]
From Competitive Advantage to Corporate Strategy
M. E. Porter, "From Competitive Advantage to Corporate Strategy", Strategic Management (1989), pp 234- 255
work page 1989
-
[8]
C. Bowman and D. Faulkner (1997), Competitive and Corporate Strategy, Irwin, London
work page 1997
Show all 29 references
-
[9]
Strategies for Diversification
I. Ansoff, "Strategies for Diversification", Harvard Business Review, 1957, pp. 113-124
1957
-
[10]
Strategy and the Business Portfolio
B. Hedley, "Strategy and the Business Portfolio", Long Range Planning 10:1 (1977), pp. 9-15
1977
-
[11]
Strategic Analysis and Action
M. Crossan, "Strategic Analysis and Action", Harvard Business Publishing, W09374-PDF-ENG (2011), 43 pages
2011
-
[12]
First excess level process
J. H. Dshalalow, "First excess level process", Advances in Queueing, CRC Press, Boca Raton, FL (1995) 244-261
1995
-
[13]
J. H. Dshalalow and H.-J. Ke, ``Layers of noncooperative games", Nonlinear Analysis 71, (2009) 283-291
2009
-
[14]
Random Walk Analysis in Antagonistic Stochastic Games
J. H.Dshalalow, "Random Walk Analysis in Antagonistic Stochastic Games", Stochastic Analysis and Applications 26:4 (2008), pp. 738-783
2008
-
[15]
On Antagonistic Game With a Constant Initial Condition Marginal Functionals and Probability Distributions
J. H. Dshalalow, W. Huang and et al., "On Antagonistic Game With a Constant Initial Condition Marginal Functionals and Probability Distributions", Nonlinear Dynamics and Systems Theory 16:3 (2016), pp. 268-275
2016
-
[16]
Discrete Operational Calculus in Delayed Stochastic Games
J. H. Dshalalow, K. Iwezulu and R. T. White, "Discrete Operational Calculus in Delayed Stochastic Games", Neural, Parallel, and Scientific Computations 24 (2016), pp. 55-64
2016
-
[17]
Kim, "Enhanced Design of Stochastic Defense System with Mixed Game Strategies'', Game Theory for Networking Applications (2018), pp
S.-K. Kim, "Enhanced Design of Stochastic Defense System with Mixed Game Strategies'', Game Theory for Networking Applications (2018), pp. 107-117
2018
-
[18]
Kim, "Blockchain Governance Game'', Comp
S.-K. Kim, "Blockchain Governance Game'', Comp. \& Indu. Eng. 136 (2019), pp. 373-380
2019
-
[19]
Strategic Alliance for Blockchain Governance Game
S.-K. Kim, "Strategic Alliance for Blockchain Governance Game", Probability in the Engineering and Informational Sciences (2020), pp. 1-17
2020
-
[20]
A Versatile Stochastic Duel Game
S.-K. Kim, "A Versatile Stochastic Duel Game", Mathematics 8:5, 678, 2020
2020
-
[21]
Antagonistic One-To-N Stochastic Duel Game
S.-K. Kim, "Antagonistic One-To-N Stochastic Duel Game", Mathematics 8:7, 1114, 2020
2020
-
[22]
Hanlon, How to use the BCG Matrix model (2019), Available online:https://www.smartinsights.com/marketing-planning/marketing-models/use-bcg-matrix/
A. Hanlon, How to use the BCG Matrix model (2019), Available online:https://www.smartinsights.com/marketing-planning/marketing-models/use-bcg-matrix/
2019
-
[23]
Kenton, BCG Growth-Share Matrix (2019), Available online: https://www.investopedia.com/terms/b/bcg.asp
W. Kenton, BCG Growth-Share Matrix (2019), Available online: https://www.investopedia.com/terms/b/bcg.asp
2019
-
[24]
Values-Based Management
C. Anderson, "Values-Based Management", The Academy of Mgt Execc 11:4 (1997), pp. 25-46
1997
-
[25]
A Systems Thinking Approach to Corporate Strategy Development
M. A. Weissenberger-Eibl and et al., "A Systems Thinking Approach to Corporate Strategy Development", Systems 7:1, 16, 2019. 12
2019
-
[26]
Developing distributed manufacturing strategies from the perspective of a product-process matrix
M. Kumara, N. Tsolakisb and et al., "Developing distributed manufacturing strategies from the perspective of a product-process matrix", International Journal of Production Economics (2020), pp. 1-17
2020
-
[27]
Riley, Bowman's Strategic Clock (2016), Available online: https://www.tutor2u.net/business/reference/strategic-positioning-bowmans-strategy-clock
J. Riley, Bowman's Strategic Clock (2016), Available online: https://www.tutor2u.net/business/reference/strategic-positioning-bowmans-strategy-clock
2016
-
[28]
McKinsey \& Company, McKinsey Quarterly (2008), Available online: https://www.mckinsey.com/business-functions/strategy-and-corporate-finance/our-insights/enduring-ideas-the- ge-and-mckinsey-nine-box-matrix
2008
-
[29]
Enalls, GE McKinsey Matrix: How to Apply it to your Business (2017), Available online: http://ideagenius.com/ge-mckinsey-matrix-apply-business/
T. Enalls, GE McKinsey Matrix: How to Apply it to your Business (2017), Available online: http://ideagenius.com/ge-mckinsey-matrix-apply-business/
2017
Reviewed August 14, 2026 · model on record in the stance chip above.
Discussion (0). Continue with ORCID to comment.