REVIEW 3 major objections 4 minor 37 references
First sub-arcsecond submillimeter-wave [C I] image of 49 Ceti with ALMA
T0 review · 3 major / 4 minor · reviewed 2026-08-14 · deepseek-v4-flash
Pith's one-line read Nearby debris disk 49 Ceti hosts a double-peaked atomic carbon ring inside its dust belt, and the [C I]/CO ratio climbs from 1.8 at the dust peak to about 10 at the disk edges.
desk verdict First resolved [C I] map of 49 Ceti is a genuine observational advance; the radial ratio trend is suggestive but the outer values are not secure, and the interpretation is honestly hedged. read the letter →
The pith
A machine-rendered reading of the paper's core claim, the machinery that carries it, and where it could break.
The reading
What carries the argument
The load-bearing observational product is the high-resolution [C I] 3P1-3P0 map at 492 GHz obtained with ALMA Band 8 at about 0.5 arcsecond (30 au) resolution, paired with archival CO(3-2) and 614 µm continuum data. The argument then rests on the [C I]/CO(3-2) intensity ratio along the major axis and on an optically thick CO interpretation calibrated by Equation (1), which converts the measured 12CO/13CO flux ratio of 2.3 into a 12CO optical depth of about 43 under the assumption that both isotopologues share the same excitation temperature and are co-located. That opacity step makes the [C I]/CO ratio a tracer of gas excitation and carbon chemistry rather than simply a CO column-density tracer.
What would settle it
A spatially resolved 13CO(2-1) map of 49 Ceti at the same roughly 0.5 arcsecond resolution, compared with 12CO(2-1) and [C I], would test the co-location and common-excitation assumptions; if the 13CO peak is displaced from the 12CO peak, or its excitation temperature differs, the derived optical depth of about 43 and the optically thick interpretation collapse. A detection of [C I] 3P2-3P1 at comparable resolution would directly measure whether the [C I] excitation temperature rises toward the star as the proposed picture requires.
Extended reading notes
Core claim
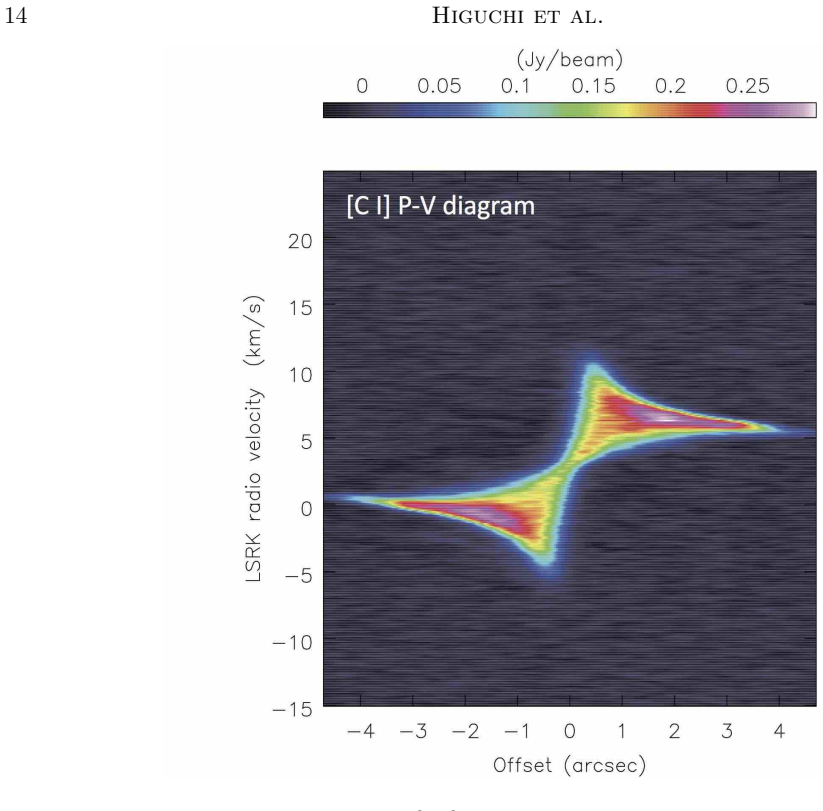
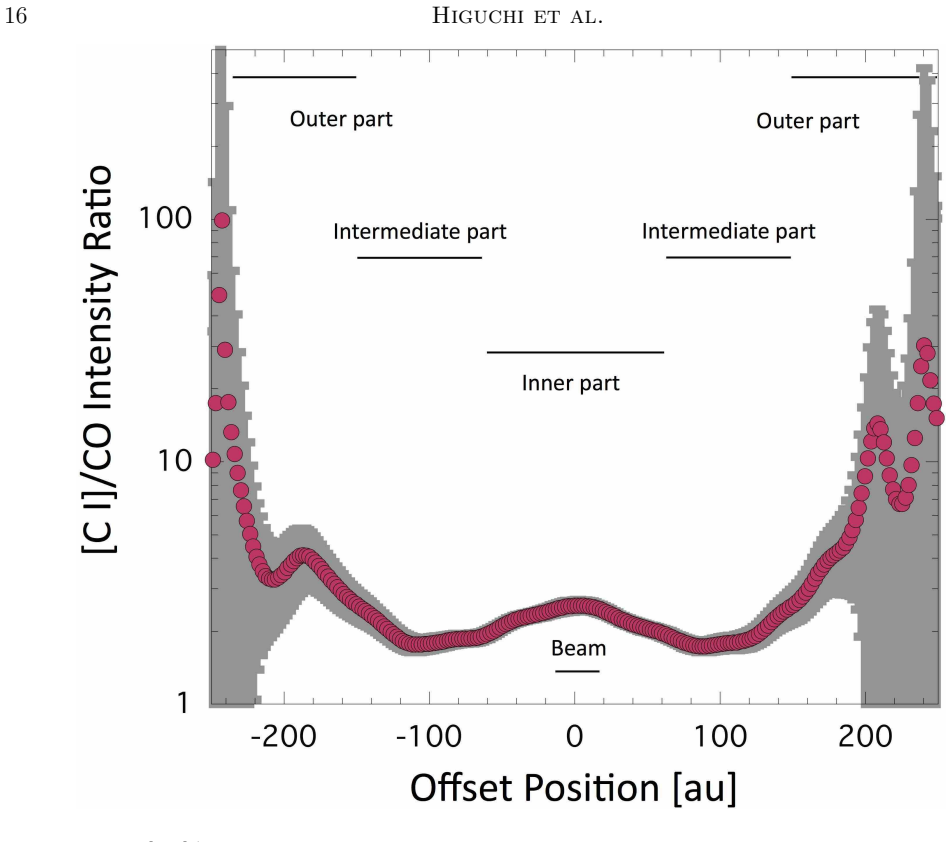
The central discovery is that [C I] 3P1-3P0 emission from 49 Ceti, detected previously with a single-dish telescope, is spatially resolved at 0.5 arcsecond (about 30 au) resolution. Its integrated intensity map has two peaks inside the dust continuum ring, which runs from about 60 to 250 au, and the [C I] disk extends from roughly 30 to 195 au. Along the major axis the [C I]/CO(3-2) intensity ratio takes a minimum of about 1.8 at the dust peak, increases inward to about 3, and increases outward to about 10. The authors interpret this pattern as a combination of excitation-temperature differences and C/CO abundance changes driven by stellar UV radiation in the inner disk and interstellar UV radiation in the outer disk. They also infer, from a 12CO/13CO flux ratio of 2.3, that the CO line is optically thick with optical depth near 43, which raises the estimated CO mass above 0.01 Earth masses.
Load-bearing premise
The interpretation that the [C I]/CO ratio variation reflects excitation temperature and C/CO abundance changes assumes that 12CO and 13CO have the same excitation temperature and occupy the same spatial region, so a flux ratio of 2.3 really means the 12CO line is about 43 times optically thick; the paper also notes that its outer-region ratio errors may be underestimated.
Editorial extensions
If this is right
- The 49 Ceti gas disk is not a simple CO ring: neutral carbon forms a double-peaked distribution inside the dust belt, so any model must reproduce two distinct C peaks and a minimum C/CO ratio at the dust peak.
- With CO optically thick, the CO mass of 49 Ceti is at least 0.01 Earth masses, two orders of magnitude above earlier estimates and three orders above that of beta Pictoris, so gas masses in debris disks may be systematically underestimated.
- The inward rise in [C I]/CO toward the star and the outward rise beyond 140 au indicate that both stellar and interstellar ultraviolet radiation drive CO photodissociation to atomic carbon.
- The spatially resolved [C I]/CO ratio provides a direct observable for distinguishing secondary gas released from solids from primordial gas left over from planet formation.
Reading between the lines
- If the same ratio pattern appears in other gaseous debris disks observed at comparable resolution, [C I]/CO could become a standard diagnostic of gas origin and UV irradiation geometry in the debris-disk phase.
- The estimated C/CO abundance ratios of roughly 100 in the outer region and 50 near the star are testable predictions: multi-transition [C I] and CO observations that break the optical-depth degeneracy would either confirm or rule them out.
- The inward displacement of the C peaks relative to the dust ring may trace the viscous spreading of gas released from the planetesimal belt, providing a way to distinguish secondary-gas models from primordial-gas dispersal even without direct detection of outflows.
Signed reviews
Editorial analysis
A structured set of objections, weighed in public.
Referee Report
Summary. This manuscript reports new ALMA Band 8 observations of the debris disk system 49 Ceti, yielding the first sub-arcsecond image of the [C I] 3P1-3P0 line and a 614 micron continuum map, together with an archival CO(3-2) map. The 614 micron continuum shows a broad ring (Rin ~ 60 au, Rout ~ 250 au), while the [C I] and CO emission are double-peaked inside the dust ring with comparable overall extent. Along the major axis, the [C I]/CO(3-2) integrated intensity ratio is roughly constant between 70 and 140 au, dips to a minimum of about 1.8 near the dust peak, and rises inward to about 3 and outward to about 10. The authors interpret the inner rise as stellar UV heating/dissociation and the outer rise as interstellar UV-driven carbon enhancement, and they discuss the implications for the optically thick CO and [C I] emission and for the secondary versus primordial origin of the gas.
Significance. The paper delivers a genuinely new observational product: the first spatially resolved [C I] map of a debris disk at sub-arcsecond resolution, with a high-S/N detection and a clean comparison to CO and dust continuum from the same system. If the reported [C I]/CO ratio variation is robust, it provides a directly falsifiable constraint on chemical and dynamical models of gaseous debris disks, in particular the Kral et al. (2018) secondary-gas picture. The measured maps, velocity field, and P-V diagram are standard ALMA products with plausible calibration and error propagation, and the authors are appropriately cautious in presenting the physical interpretation as qualitative. The main scientific added value beyond the images themselves is the ratio trend, and that trend is currently the least certain part of the analysis.
major comments (3)
- [Section 3.3, Figure 4] See comment above.
- [Section 3.4, Eq. (1)] See comment above.
- [Section 3.4, inner-region interpretation] See comment above.
minor comments (4)
- [Section 3.2] See comment above.
- [Appendix A] See comment above.
- [Figure 3 caption] See comment above.
- [Keywords] See comment above.
Circularity Check
No significant circularity; the analysis is an observational imaging paper with external calibration and explicitly caveated interpretation.
full rationale
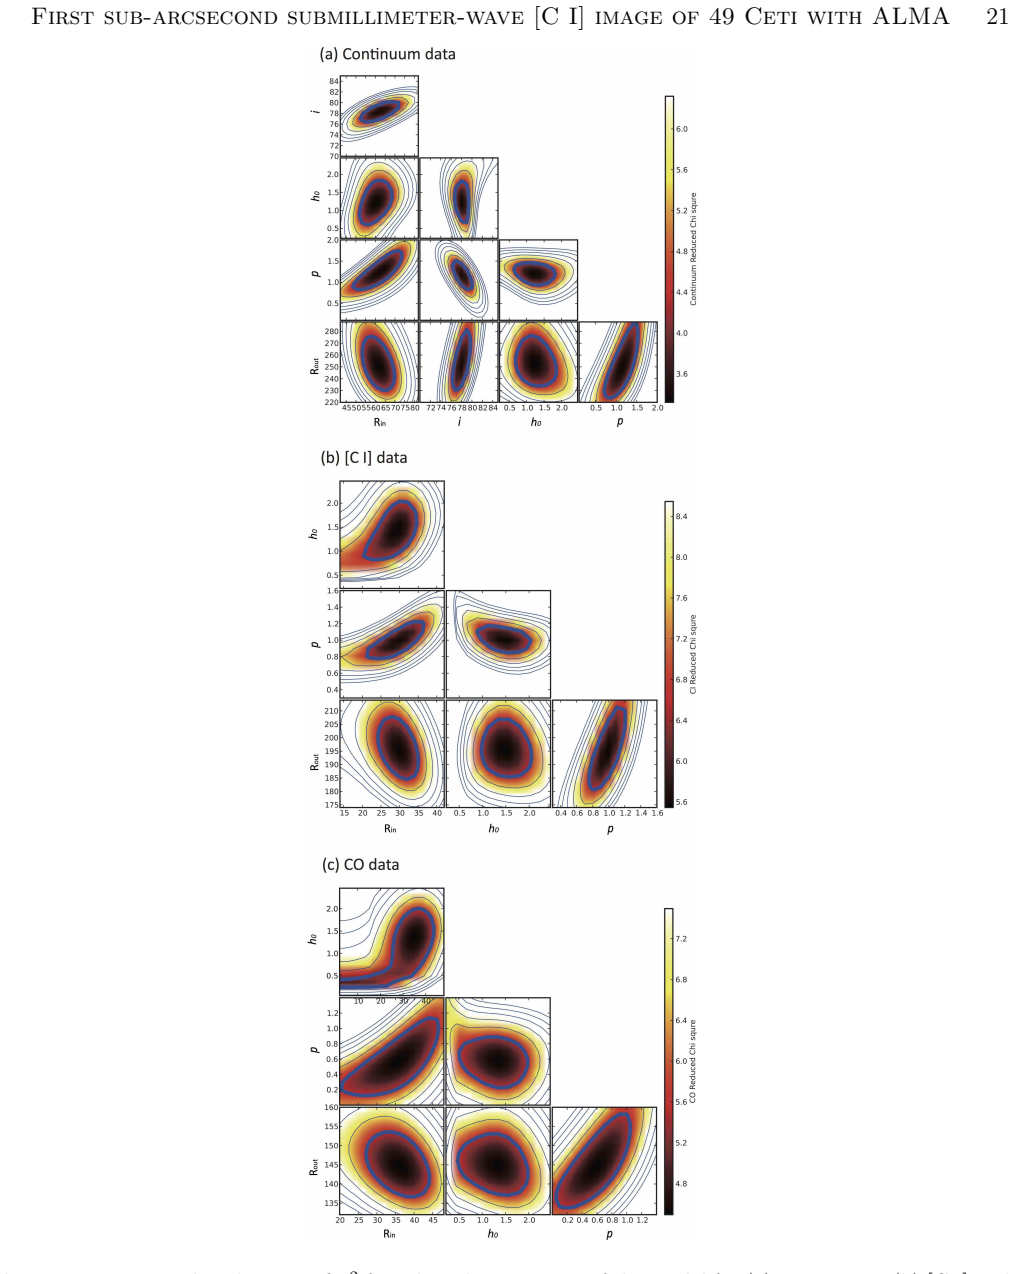
The paper's central results are direct ALMA images and measured [C I]/CO intensity ratios; these are not derived from a fitted parameter or from the paper's own assumptions. The only quantitative conversion, the optical depth estimate in Section 3.4 via Eq. 1, uses the 12CO/13CO flux ratio measured independently by Moór et al. (2019) and the published elemental 12C/13C ratio of 77, so it is not a prediction that reduces to an input of this paper. The size estimates for the dust, [C I], and CO distributions use the Hughes et al. (2017) power-law disk model, but the paper explicitly states that this is only to 'determine the approximate sizes' and not to model the disk structure in detail, and the fitted radii are presented as measurements rather than as evidence for the physical interpretation. The interpretation of the ratio variation in terms of stellar and interstellar UV radiation is qualitative, and the paper itself notes that 'the optical depth problem hampers quantitative discussions on the C/CO abundance ratio.' Several self-citations appear (Higuchi et al. 2017 for flux consistency and standard abundance conversion formulae, and Kral et al. 2018 as an independent model comparison), but none is load-bearing in the sense that the present conclusion is forced by that citation rather than by the new data. No equation in the paper is identical by construction to its input, no fitted parameter is renamed as a prediction, and no uniqueness theorem is imported from the authors' prior work. The acknowledged underestimation of outer-region error bars in Figure 4 is a data-quality limitation, not a circularity.
Assumptions & free parameters
free parameters (6)
- p: surface density power-law index =
dust 1.2 +/- 0.3, [C I] 1.0 +/- 0.2, CO 0.6 +/- 0.4
- h0: scale-height constant =
dust 1.2 +/- 0.4, [C I] 1.4 +/- 0.6, CO 1.3 +/- 0.7
- Rin: inner radius =
dust 60 +/- 10 au, [C I] 30 +/- 5 au, CO 35 +/- 10 au
- Rout: outer radius =
dust 250 +/- 20 au, [C I] 195 +/- 20 au, CO 145 +/- 10 au
- i: inclination =
78 +/- 2 degrees
- Dust temperature T_d =
30 to 100 K
assumptions (6)
- domain assumption The disk surface flux density follows a single power law with inner radius Rin and outer cutoff Rout (Eq A1).
- domain assumption The disk temperature structure is T(R)=40(R/100 au)^-0.5 (Eq A5).
- domain assumption The stellar mass is 2.1 solar masses (Hughes et al. 2017).
- domain assumption 12CO and 13CO have the same excitation temperature, are spectro-spatially co-located, and the elemental 12C/13C ratio is 77 (Section 3.4).
- ad hoc to paper CO and C are vertically segregated, with CO near the midplane and C in the surface layer (Section 3.4, Figure 5).
- domain assumption The 614 micron dust continuum is optically thin (Section 3.1).
Cite this review
Pith. "Pith review of First sub-arcsecond submillimeter-wave [C I] image of 49 Ceti with ALMA." pith.science (2026). https://pith.science/paper/3KKPKKLF
@misc{pith2026190807032,
  author       = {Pith},
  title        = {Pith review of: First sub-arcsecond submillimeter-wave [C I] image of 49 Ceti with ALMA},
  year         = {2026},
  howpublished = {\url{https://pith.science/paper/3KKPKKLF}},
  note         = {Machine review of arXiv:1908.07032}
}
read the original abstract
We present the first sub-arcsecond images of 49 Ceti in the [C I]3P1-3P0 emission and the 614 micron dust continuum emission observed with ALMA, as well as that in the CO(J=3-2) emission prepared by using the ALMA archival data. The spatial distribution of the 614 micron dust continuum emission is found to have a broad-ring structure with a radius of about 100 au around the central star. A substantial amount of gas is also associated with 49 Ceti. The [C I] emission map shows two peaks inside the dust ring, and its overall extent is comparable to that of the dust continuum emission and the CO emission. We find that the [C I]/CO(J=3-2) intensity ratio significantly varies along the major axis. The ratio takes the minimum value of 1.8 around the dust peak position, and increases inwards and outwards. The enhanced ratio around the central star (~3) likely originates from the stellar UV radiation, while that in the outer disk (~10) from the interstellar UV radiation. Such complex distributions of the [C I] and CO(J=3-2) emission will be a key to understand the origin of the gas in 49 Ceti, and will also provide a stringent constraint on physical and chemical models of gaseous debris disks.
Figures


Figures from the paper (4 more)


Reference graph
Works this paper leans on
-
[1]
, " * write output.state after.block = add.period write newline
ENTRY address archivePrefix author booktitle chapter doi edition editor eprint howpublished institution journal key month note number organization pages publisher school series title misctitle type volume year version url label extra.label sort.label short.list INTEGERS output.state before.all mid.sentence after.sentence after.block FUNCTION init.state.co...
-
[2]
write newline
" write newline "" before.all 'output.state := FUNCTION format.doi doi empty "" "doi:" doi * if FUNCTION format.url url empty "" new.block "" url * "" * if FUNCTION format.eprint eprint empty "" archivePrefix empty "" archivePrefix ":" * if eprint field.or.null * if FUNCTION format.pid eprint empty format.doi format.eprint if FUNCTION n.dashify 't := "" t...
-
[3]
thebibliography [1] 20pt to REFERENCES 6pt =0pt 10pt plus 3pt =0pt =0pt =1pt plus 1pt =0pt =0pt -12pt =13pt plus 1pt =20pt =13pt plus 1pt \@M =10000 =-1.0em =0pt =0pt 0pt =0pt =1.0em @enumiv\@empty 10000 10000 `\.\@m \@noitemerr \@latex@warning Empty `thebibliography' environment \@ifnextchar \@reference \@latexerr Missing key on reference command Each re...
work page 1998
-
[4]
C., Hollenbach, D., Laughlin, G., & Gorti, U.\ 2004, , 611, 360
Adams, F. C., Hollenbach, D., Laughlin, G., & Gorti, U.\ 2004, , 611, 360
work page 2004
- [5]
-
[6]
Cataldi, G., Brandeker, A., Wu, Y., et al.\ 2018, , 861, 72
work page 2018
-
[7]
Dent, W. R. F., Greaves, J. S., & Coulson, I. M.\ 2005, , 359, 663
work page 2005
-
[8]
Dent, W. R. F., Wyatt, M. C., Roberge, A., et al.\ 2014, Science, 343, 1490
work page 2014
Show all 37 references
-
[9]
Dong, R., van der Marel, N., Hashimoto, J., et al.\ 2017, , 836, 201
2017
-
[10]
Gaia Collaboration, Brown, A. G. A., Vallenari, A., et al.\ 2018, , 616, A1
2018
-
[11]
E., Sato, A., Tsukagoshi, T., et al.\ 2017, , 839, L14
Higuchi, A. E., Sato, A., Tsukagoshi, T., et al.\ 2017, , 839, L14
2017
-
[12]
S., Matthews, B
Holland, W. S., Matthews, B. C., Kennedy, G. M., et al.\ 2017, , 470, 3606
2017
-
[13]
M., Wilner, D
Hughes, A. M., Wilner, D. J., Kamp, I., & Hogerheijde, M. R.\ 2008, , 681, 626-635
2008
-
[14]
M., Lieman-Sifry, J., Flaherty, K
Hughes, A. M., Lieman-Sifry, J., Flaherty, K. M., et al.\ 2017, , 839, 86
2017
-
[15]
M., Duch \^e ne, G., & Matthews, B
Hughes, A. M., Duch \^e ne, G., & Matthews, B. C.\ 2018, , 56, 541
2018
-
[16]
Iwasaki, K., Kobayashi, H., in prep
-
[17]
Kama, M., Bruderer, S., Carney, M., et al.\ 2016, , 588, A108
2016
-
[18]
K \'o sp \'a l, \'A ., Mo \'o r, A., Juh \'a sz, A., et al.\ 2013, , 776, 77
2013
-
[19]
C., Kama, M., & Matra, L.\ 2018, arXiv:1811.08439
Kral, Q., Marino, S., Wyatt, M. C., Kama, M., & Matra, L.\ 2018, arXiv:1811.08439
2018 arXiv
-
[20]
Kudo, T., Hashimoto, J., Muto, T., et al.\ 2018, , 868, L5
2018
-
[21]
P., Waters, B., Schiebel, D., Young, W., & Golap, K.\ 2007, Astronomical Data Analysis Software and Systems XVI, 376, 127
McMullin, J. P., Waters, B., Schiebel, D., Young, W., & Golap, K.\ 2007, Astronomical Data Analysis Software and Systems XVI, 376, 127
2007
-
[22]
K., Di Francesco, J., Johnstone, D., et al.\ 2014, , 784, 82
Mann, R. K., Di Francesco, J., Johnstone, D., et al.\ 2014, , 784, 82
2014
-
[23]
A., Kalas, P., et al.\ 2017, , 842, 9
Matr \`a , L., MacGregor, M. A., Kalas, P., et al.\ 2017, , 842, 9
2017
-
[24]
Mayama, S., Akiyama, E., Pani \'c , O., et al.\ 2018, , 868, L3
2018
-
[25]
Mo \'o r, A., Kral, Q., \'A brah \'a m, P., et al.\ 2019, , submitted
2019
-
[26]
Mo \'o r, A., Cur \'e , M., K \'o sp \'a l, \'A ., et al.\ 2017, , 849, 123
2017
-
[27]
Mo \'o r, A., Juh \'a sz, A., K \'o sp \'a l, \'A ., et al.\ 2013, , 777, L25
2013
-
[28]
Oka, T., Yamamoto, S., Iwata, M., et al.\ 2001, , 558, 176
2001
-
[29]
Roberge, A., Kamp, I., Montesinos, B., et al.\ 2013, , 771, 69
2013
-
[30]
Tsukagoshi, T., Momose, M., Kitamura, Y., et al.\ 2019, , 871, 5
2019
-
[31]
Tsukagoshi, T., Momose, M., Saito, M., et al.\ 2015, , 802, L7
2015
-
[32]
van der Marel, N., Dong, R., di Francesco, J., Williams, J., & Tobin, J.\ 2019, arXiv:1901.03680
2019 arXiv
-
[33]
van Leeuwen, F.\ 2007, , 474, 653
2007
-
[34]
L., & Rood, R.\ 1994, , 32, 191
Wilson, T. L., & Rood, R.\ 1994, , 32, 191
1994
-
[35]
S., & Liu, T.\ 1995, , 446, L79
Zuckerman, B., Kim, S. S., & Liu, T.\ 1995, , 446, L79
1995
-
[36]
Zuckerman, B., & Song, I.\ 2012, , 758, 77
2012
-
[37]
Zuckerman, B.\ 2019, , 870, 27
2019
Reviewed August 14, 2026 · model on record in the stance chip above.
Discussion (0). Continue with ORCID to comment.