REVIEW 4 major objections 7 minor 21 references
A Novel method for IDC Prediction in Breast Cancer Histopathology images using Deep Residual Neural Networks
T0 review · 4 major / 7 minor · reviewed 2026-08-14 · deepseek-v4-flash
Pith's one-line read Seven-channel residual network learns IDC patches at 99.29% accuracy
desk verdict A routine patch-level CNN paper with an untrustworthy evaluation protocol; the 99.29% accuracy is likely inflated by slide-level leakage and cannot be taken at face value. read the letter →
The pith
A machine-rendered reading of the paper's core claim, the machinery that carries it, and where it could break.
The reading
What carries the argument
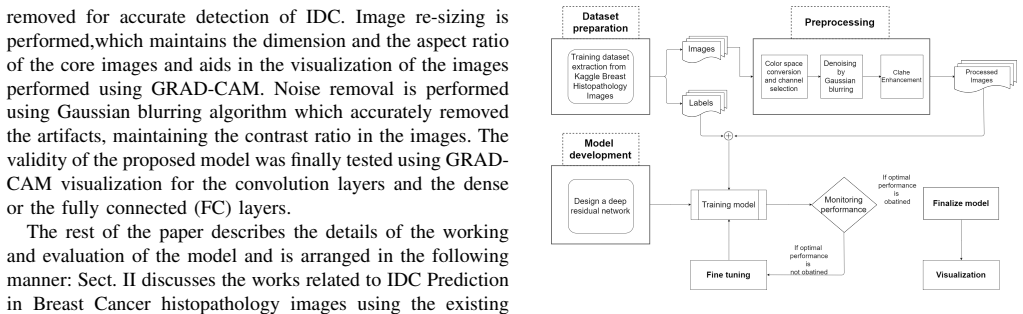
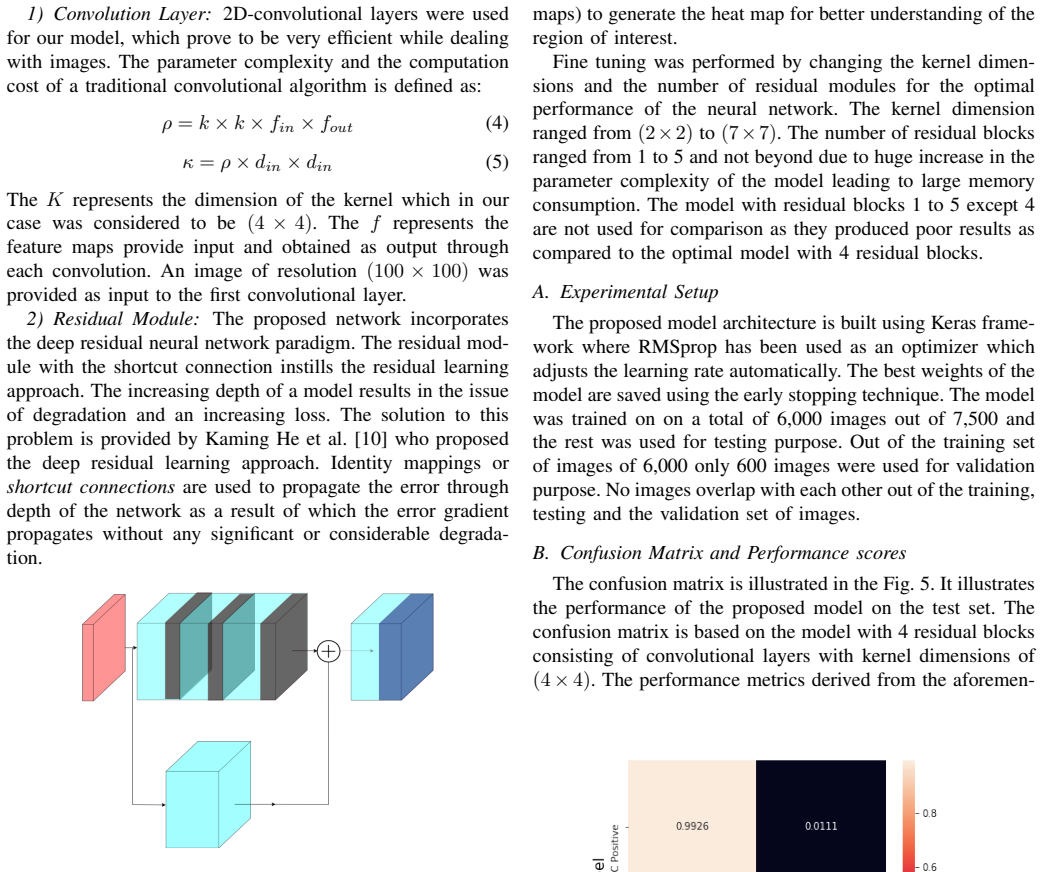
The load-bearing mechanism is the seven-channel image matrix: RGB plus the hue and saturation channels of HSV plus the $l^*$ and $a^*$ channels of CIELAB, all denoised with a Gaussian blur and contrast-enhanced with CLAHE on the RGB channels only. The paper argues these extra color channels let the network see past stain variation. The network itself is a residual CNN with four residual blocks, each block stacking three convolutional layers and an unactivated shortcut connection whose outputs are added before ReLU; a global average pooling layer feeds a fully connected classifier.
What would settle it
A patient-level or slide-level split—placing all patches from each of the 162 source slides entirely in train, validation, or test—would settle it: if accuracy or AUROC falls materially below 99.29% and 0.9996, the original numbers reflected patch-level leakage rather than true IDC detection. An additional RGB-only run would isolate whether the seven-channel input is responsible for the gain.
Extended reading notes
Core claim
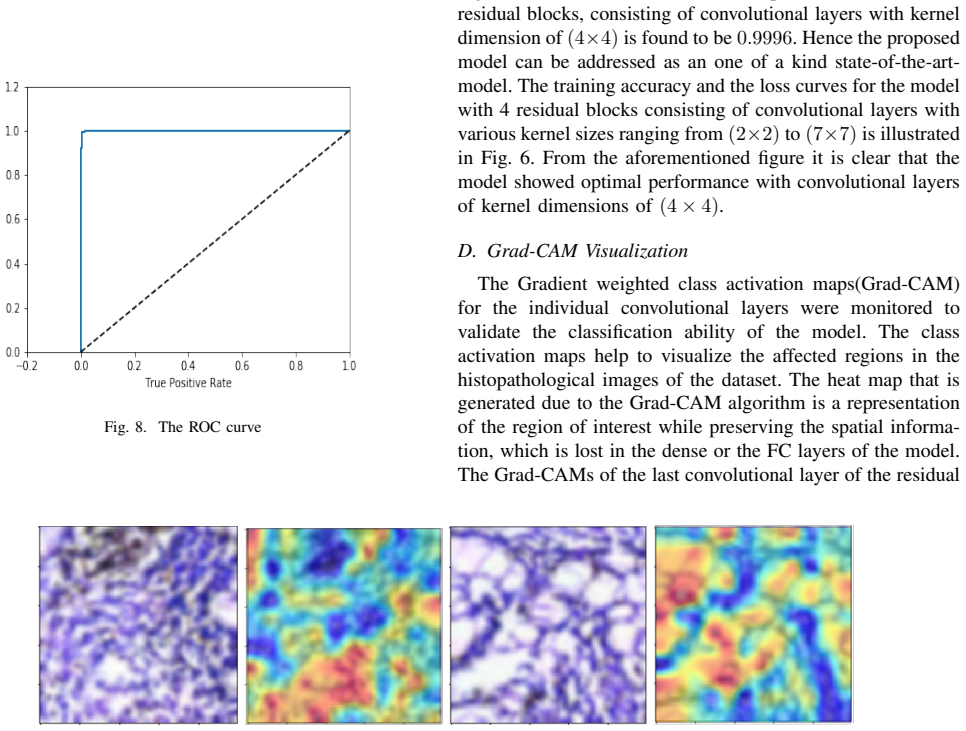
The central claim is that a 4-block deep residual network trained on a seven-channel image representation, rather than plain RGB, distinguishes IDC-positive from IDC-negative histopathology patches at essentially ceiling performance. The authors report per-class accuracy of 0.9929, precision and recall around 0.99 for both classes, and AUROC 0.9996, and they use Grad-CAM heatmaps to argue the network focuses on the affected regions. They frame this as a state-of-the-art result relative to the earlier CNN and machine-learning methods listed in their comparison table.
Load-bearing premise
The evaluation assumes randomly splitting patches into train and test does not leak information from the same whole-slide image into both sets; if that assumption fails, the reported near-perfect scores overstate how well the model would do on new patients.
Editorial extensions
If this is right
- The 99.29% accuracy and 0.9996 AUROC, if taken at face value, mean the model misclassifies only about one in 140 test patches, far below the 81–89% accuracies of the compared methods.
- The seven-channel preprocessing is, on the paper's account, what lets the network handle stain variation and low-resolution $50 \times 50$ patches.
- Grad-CAM visualizations, as the authors use them, provide patch-level localization of the regions driving the IDC decision, which is useful for pathologist review.
- The model's ceiling-level performance on this subset implies the remaining research question is generalization to larger and more varied histopathology cohorts, which the authors identify as future scope.
Reading between the lines
- A patient-level or whole-slide-level split would be the real test of the 99.29% figure; because patches are drawn from only 162 source slides, random patch splitting likely places highly correlated neighbours in train and test, inflating the score.
- An RGB-only ablation would quantify how much the four extra channels contribute; without it, the seven-channel claim is untested.
- Applying the exact pipeline to the full 277,524-patch set or to an outside hospital's slides would show whether the near-perfect scores survive scale and stain shift.
Signed reviews
Editorial analysis
A structured set of objections, weighed in public.
Referee Report
Summary. The paper proposes a deep residual convolutional neural network for classifying invasive ductal carcinoma (IDC) in breast histopathology images. The authors take a 7,500-patch subset of the Kaggle Breast Histopathology Images dataset (originally 277,524 patches from 162 whole-slide images), preprocess the patches by resizing to 100×100, merging RGB with hue/saturation from HSV and l*/a* from CIELAB into a 7-channel input, applying Gaussian blur and CLAHE, and then train a network with four residual blocks and 4×4 kernels. The paper reports 99.29% accuracy and an AUROC of 0.9996 on a held-out test set, presents a confusion matrix and Grad-CAM visualizations, and claims state-of-the-art performance compared with earlier methods.
Significance. If the reported performance were obtained under a valid evaluation protocol, the method would represent a strong result for patch-level IDC classification and might be of practical interest for computer-aided diagnosis. The use of a multi-channel color representation, residual learning, and Grad-CAM visualization are sensible ingredients. However, the significance as presented is severely limited by the evaluation: the effective number of independent units is at most 162 whole-slide images, and the paper does not demonstrate that the train/test split is disjoint at the slide or patient level. Without such a split, the reported 99.29% accuracy and 0.9996 AUROC cannot be interpreted as estimates of generalization to new slides or patients, and the state-of-the-art claim is therefore not supported.
major comments (4)
- [Section IV-A] The evaluation protocol is the load-bearing issue. The dataset consists of 277,524 patches extracted from 162 whole-slide images, and the authors use a 7,500-patch subset. Section IV-A states only that "No images overlap with each other out of the training, testing and the validation set of images," which is compatible with random patch-level splitting. If patches from the same whole-slide image appear in both training and test sets, the model can exploit slide-specific staining and preparation artifacts, inflating the reported 99.29% accuracy and 0.9996 AUROC. The authors must either perform a slide-level or patient-level split, or otherwise explicitly demonstrate that no two patches from the same source WSI are distributed across different splits, before the headline numbers can be accepted as valid performance estimates.
- [Section IV-A and Table I] All performance metrics are reported for a single random split, with no repeated runs, cross-validation, or confidence intervals. Given that the independent units are at most 162 whole-slide images, the point estimates in Table I (e.g., 0.9929 accuracy, 0.9996 AUROC) are not accompanied by any measure of variability. The authors should report mean and standard deviation over multiple slide-disjoint splits or use slide-level cross-validation to establish that the results are stable.
- [Table II and Section IV-C] The comparative analysis in Table II is not valid as presented. The cited prior works use different datasets, different patch-sampling strategies, different class balances, and different evaluation protocols. The claim that the proposed model "outperforms" these methods and is "an one of a kind state-of-the-art-model" cannot be sustained without a common benchmark and identical evaluation conditions. At minimum, the authors should clearly state the incomparability and restrict their claims to their own dataset and protocol.
- [Section III-A and Section IV] The process for selecting the 7,500-image subset is not described: it is not stated whether the subset was chosen randomly, in a stratified manner, or consecutively from particular whole-slide images. Additionally, the hyperparameter search (kernel dimension and number of residual blocks) is reported only as a final choice, and the authors state that models with 1–3 and 5 residual blocks "produced poor results" without reporting the actual values. This makes it impossible to assess overfitting or selection bias. The authors should describe the subset selection and report the full hyperparameter sweep, ideally on a validation set that is separate from the test set.
minor comments (7)
- [Abstract and Section IV-C] The phrase "an one of a kind state-of-the-art-model" should be corrected to "a one-of-a-kind state-of-the-art model."
- [Section III-A] There is a typo: "neagtive" should be "negative."
- [Section III-C] "Kaming He" should be "Kaiming He" in the reference to the residual network paper.
- [Section IV-B] The phrase "over the top accuracy" is informal; please use a neutral formulation such as "very high accuracy" or simply report the numerical value.
- [Section IV-C] Figure 8 is referenced before Figure 6 in the text; please renumber or reorder the figures so that they are cited in numerical order.
- [Section III-C] The architecture description does not specify the number of convolutional filters per layer, the stride, or the input channel dimension after the 7-channel merge. These details are necessary for reproducibility.
- [References] Reference [1] is cited in the abstract as the American Cancer Society, but the actual reference is to breastcancer.org; please align the citation with the intended source.
Circularity Check
No significant circularity: the reported accuracy and AUROC are empirical test-set measurements, not derivations from fitted inputs or self-cited premises.
full rationale
The paper's central claim is an empirical classification performance on a held-out test split of the Breast Histopathology Images benchmark. The 99.29% accuracy and 0.9996 AUROC come from a confusion matrix and ROC curve computed on test predictions, as stated in Section IV. The model is a residual CNN with a 7-channel input formed from RGB, HSV, and CIELAB channels; these are preprocessing choices, not parameters fitted to the test labels. The authors tune kernel sizes and residual-block counts using training/validation performance, which is standard model selection rather than circular reasoning. There are no self-citations to prior work by the same authors, no invoked uniqueness theorem, and no renamed empirical result presented as derivation. The most serious concern is that the train/test split is at the patch level rather than the whole-slide or patient level, so patches from the same source whole-slide image may appear in both training and test sets, potentially inflating the reported numbers through slide-level confounders. That is an evaluation-validity or soundness problem, not circularity: the prediction is not equivalent to the input by construction, and no fitted parameter is relabeled as a prediction. Therefore the circularity score is 0.
Assumptions & free parameters
free parameters (5)
- CNN weights =
Learned from 6,000 training patches
- Training/test subset composition =
7,500 images (3,000 IDC-positive, 4,500 negative) sampled from 277,524 patches
- Residual block count =
4
- Kernel dimension =
4x4
- 7-channel color representation =
RGB plus HSV H,S and CIELAB L*,a*
assumptions (3)
- domain assumption The Kaggle dataset ground-truth labels for IDC are correct as provided.
- domain assumption Patches from the same whole-slide image are independent and can be split randomly into train and test.
- domain assumption Gaussian blur and CLAHE preprocessing preserve the diagnostic signal needed for classification.
Cite this review
Pith. "Pith review of A Novel method for IDC Prediction in Breast Cancer Histopathology images using Deep Residual Neural Networks." pith.science (2026). https://pith.science/paper/HCQEZ344
@misc{pith2026190807362,
  author       = {Pith},
  title        = {Pith review of: A Novel method for IDC Prediction in Breast Cancer Histopathology images using Deep Residual Neural Networks},
  year         = {2026},
  howpublished = {\url{https://pith.science/paper/HCQEZ344}},
  note         = {Machine review of arXiv:1908.07362}
}
read the original abstract
Invasive ductal carcinoma (IDC), which is also sometimes known as the infiltrating ductal carcinoma, is the most regular form of breast cancer. It accounts for about 80% of all breast cancers. According to the American Cancer Society, more than 180,000 women in the United States are diagnosed with invasive breast cancer each year. The survival rate associated with this form of cancer is about 77% to 93% depending on the stage at which they are being diagnosed. The invasiveness and the frequency of the occurrence of these disease makes it one of the difficult cancers to be diagnosed. Our proposed methodology involves diagnosing the invasive ductal carcinoma with a deep residual convolution network to classify the IDC affected histopathological images from the normal images. The dataset for the purpose used is a benchmark dataset known as the Breast Histopathology Images. The microscopic RGB images are converted into a seven channel image matrix, which is then fed to the network. The proposed model produces a 99.29% accurate approach towards the prediction of IDC in the histopathology images with an AUROC score of 0.9996. Classification ability of the model is tested using standard performance metrics.
Figures


Figures from the paper (4 more)


Reference graph
Works this paper leans on
-
[1]
Invasive ductal carcinoma (idc),
Breastcancer.org, “Invasive ductal carcinoma (idc),” Accessed on: 2019, https://www.breastcancer.org/symptoms/types/idc
work page 2019
-
[2]
Invasive ductal carcinoma dataset,
Kaggle, “Invasive ductal carcinoma dataset,” Accessed on: 2019, https://www.kaggle.com/paultimothymooney/ breast-histopathology-images
work page 2019
-
[3]
Invasive ductal carcinoma treatment,
Cancer Treatement Centers of America, “Invasive ductal carcinoma treatment,” Accessed on: 2019, https://www.cancercenter.com/cancer-types/breast-cancer/risk-factors
work page 2019
-
[4]
National Breast Cancer Foundation, INC, “Causes of breast cancer,” Accessed on: 2019, https://www.nationalbreastcancer.org/causes-of-breast-cancer
work page 2019
-
[5]
Gradient-based learning applied to document recognition,
Y . Lecun, L. Bottou, Y . Bengio, and P. Haffner, “Gradient-based learning applied to document recognition,” Proceedings of the IEEE , vol. 86, no. 11, pp. 2278–2324, 1998
1998
-
[6]
Imagenet classification with deep convolutional neural networks,
A. Krizhevsky, I. Sutskever, and G. E. Hinton, “Imagenet classification with deep convolutional neural networks,” in Advances in Neural Infor- mation Processing Systems 25 , F. Pereira, C. J. C. Burges, L. Bottou, and K. Q. Weinberger, Eds., 2012, pp. 1097–1105
work page 2012
-
[7]
Faster r-cnn: Towards real-time object detection with region proposal networks,
S. Ren, K. He, R. Girshick, and J. Sun, “Faster r-cnn: Towards real-time object detection with region proposal networks,” in Advances in neural information processing systems , 2015, pp. 91–99
2015
-
[8]
K. He, G. Gkioxari, P. Doll ´ar, and R. Girshick, “Mask r-cnn,” in Computer Vision (ICCV), 2017 IEEE International Conference on . IEEE, 2017, pp. 2980–2988
work page 2017
Show all 21 references
-
[9]
Digital analysis of microscopic images in medicine,
N. Dey, A. S. Ashour, A. Ashour, and A. Singh, “Digital analysis of microscopic images in medicine,” Journal of Advanced Microscopy Research, vol. 10, pp. 1–13, 06 2015
2015
-
[10]
Deep residual learning for image recognition,
K. He, X. Zhang, S. Ren, and J. Sun, “Deep residual learning for image recognition,” in Proceedings of the IEEE conference on computer vision and pattern recognition , 2016, pp. 770–778
2016
-
[11]
A survey of data mining and deep learning in bioinformatics,
K. Lan, D.-t. Wang, S. Fong, L.-s. Liu, K. K. L. Wong, and N. Dey, “A survey of data mining and deep learning in bioinformatics,” Journal of Medical Systems , vol. 42, no. 8, p. 139, Jun 2018. [Online]. Available: https://doi.org/10.1007/s10916-018-1003-9
2018 doi
-
[12]
Breast cancer histopathology image analysis: A review,
M. Veta, J. P. W. Pluim, P. J. van Diest, and M. A. Viergever, “Breast cancer histopathology image analysis: A review,” IEEE Transactions on Biomedical Engineering , vol. 61, no. 5, pp. 1400–1411, 2014
2014
-
[13]
Automated grading of breast cancer histopathology using spectral clustering with textural and architectural image features,
S. Doyle, S. Agner, A. Madabhushi, M. Feldman, and J. Tomaszewski, “Automated grading of breast cancer histopathology using spectral clustering with textural and architectural image features,” 2008, pp. 496– 499
2008
-
[14]
Automated gland and nuclei segmentation for grading of prostate and breast cancer histopathology,
S. Naik, S. Doyle, S. Agner, A. Madabhushi, M. Feldman, and J. Tomaszewski, “Automated gland and nuclei segmentation for grading of prostate and breast cancer histopathology,” 2008, pp. 284–287
2008
-
[15]
Computerized classification of intraductal breast lesions using histopathological images,
M. M. Dundar, S. Badve, G. Bilgin, V . Raykar, R. Jain, O. Sertel, and M. N. Gurcan, “Computerized classification of intraductal breast lesions using histopathological images,” IEEE Transactions on Biomedical Engineering, vol. 58, no. 7, pp. 1977–1984, 2011
1977
-
[16]
Automated detection of dcis in whole-slide h & e stained breast histopathology images,
B. Ehteshami Bejnordi, M. Balkenhol, G. Litjens, R. Holland, P. Bult, N. Karssemeijer, and J. A. W. M. van der Laak, “Automated detection of dcis in whole-slide h & e stained breast histopathology images,” IEEE Transactions on Medical Imaging , vol. 35, no. 9, pp. 2141–2150, 2016
2016
-
[17]
Deep learning-based assessment of tumor-associated stroma for diagnosing breast cancer in histopathology images,
B. Ehteshami Bejnordi, J. Lin, B. Glass, M. Mullooly, G. L. Gierach, M. E. Sherman, N. Karssemeijer, J. van der Laak, and A. H. Beck, “Deep learning-based assessment of tumor-associated stroma for diagnosing breast cancer in histopathology images,” 2017, pp. 929–932
2017
-
[18]
Imbalanced histopathological breast cancer image classification with convolutional neural network,
M. S. Reza and J. Ma, “Imbalanced histopathological breast cancer image classification with convolutional neural network,” in 2018 14th IEEE International Conference on Signal Processing (ICSP) , 2018, pp. 619–624
2018
-
[19]
Invasive ductal breast carcinoma detector that is robust to image magnification in whole digital slides,
M. Balazsi, P. Blanco, P. Zoroquiain, M. Levine, and M. Burnier Jr, “Invasive ductal breast carcinoma detector that is robust to image magnification in whole digital slides,” Journal of Medical Imaging , vol. 3, p. 027501, 05 2016
2016
-
[20]
Automatic detection of invasive ductal carcinoma in whole slide images with convolutional neural networks,
A. Cruz-Roa, A. Basavanhally, F. Gonzlez, H. Gilmore, M. Feldman, S. Ganesan, N. Shih, J. Tomaszewski, and A. Madabhushi, “Automatic detection of invasive ductal carcinoma in whole slide images with convolutional neural networks,” Progress in Biomedical Optics and Imaging - Pr...
2014
-
[21]
Context- aware stacked convolutional neural networks for classification of breast carcinomas in whole-slide histopathology images,
B. E. Bejnordi, G. Zuidhof, M. Balkenhol, M. Hermsen, P. Bult, B. van Ginneken, N. Karssemeijer, G. Litjens, and J. van der Laak, “Context- aware stacked convolutional neural networks for classification of breast carcinomas in whole-slide histopathology images,” Journal of medi...
2017
Reviewed August 14, 2026 · model on record in the stance chip above.
Discussion (0). Continue with ORCID to comment.