REVIEW 3 major objections 5 minor 23 references
Atmospheric pressure dependance of HAWC scaler system
T0 review · 3 major / 5 minor · reviewed 2026-08-14 · deepseek-v4-flash
Pith's one-line read The HAWC scaler rates' 12-hour oscillation is a barometric signal, giving a per-PMT pressure coefficient of about $-0.34\,\%/\mathrm{hPa}$ and a quantitative malfunction flag for bad PMTs.
desk verdict Solid detector-calibration extension with a useful PMT-health diagnostic, but the 2-cpd barometric isolation needs a control before the health cuts are relied on. read the letter →
The pith
A machine-rendered reading of the paper's core claim, the machinery that carries it, and where it could break.
The reading
What carries the argument
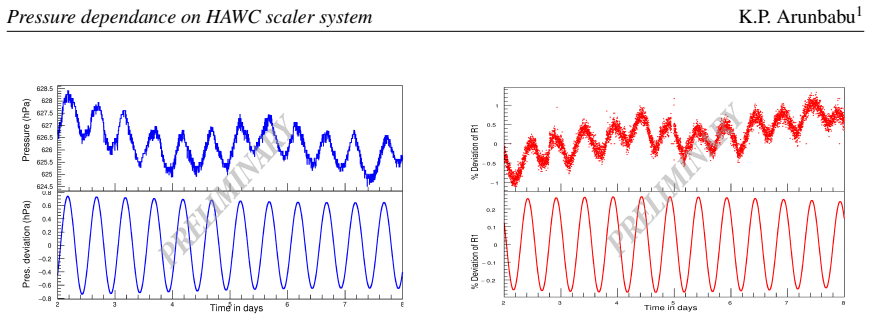
The load-bearing object is the 12-hour solar atmospheric tide at the HAWC site, visible as a dominant 2-cycle-per-day peak in both barometer and scaler-rate power spectra. The paper's tool is a narrow-band frequency filter $W(f)$ with central frequency $f_c=2$ cycles per day and $\Delta f=0.01$: full acceptance from $1.99$ to $2.01$ cycles per day, a sinusoidal roll-off to zero by $1.98$ and $2.02$, and zero outside. Applied to the FFT of pressure and rates and followed by an inverse FFT, the filter reconstructs only the barometric oscillation with zero baseline, so a direct fit of rate against pressure yields $\beta_P$ for each of the 1180 PMTs without contamination from solar diurnal anisotropy or other low-frequency modulations.
What would settle it
Apply the same narrow FFT filter to a multi-day stretch in which the barometer has no 12-hour pressure tide, such as sustained stormy weather; if the reconstructed rate still oscillates at 2 cycles per day with comparable amplitude, the scaler-rate component is not dominantly barometric, and the beta estimate would be contaminated.
Extended reading notes
Core claim
The central claim is that the 2-cycle-per-day component of the HAWC TDC-scaler rates is dominated by atmospheric pressure, and that this fact can be exploited without a long calibration run. The paper filters both pressure and rate data in the Fourier domain with the passband $1.98$-$2.02$ cycles per day, transforms back, and observes a clean 12-hour anti-correlation. Fitting $R(P)=R(P_m)\exp(\beta_P\,\Delta P)$ and its linear approximation gives $\beta_P=-0.337\,\%/\mathrm{hPa}$ (exponential) and $-0.343\,\%/\mathrm{hPa}$ (linear) for the average single-PMT rate for September-November 2016, with multiplicity rates varying by multiplicity. The paper then argues that since the pressure response of the atmosphere is independent of the detector, the spread of $\beta_P$ across PMTs should be small; with $\sigma=1.29\times10^{-2}\,\%/\mathrm{hPa}$ it classifies PMTs and tanks as good, within $3\sigma$-$5\sigma$, or above $5\sigma$, and retains the first group for solar-modulation studies.
Load-bearing premise
The argument assumes that at 2 cycles per day the only significant source of oscillation in the scaler rates is atmospheric pressure, so the narrow FFT filter removes solar and temperature contributions along with the barometric signal.
Editorial extensions
If this is right
- Pressure-corrected R1 shows a drastically reduced 2-cycle-per-day peak while other frequency amplitudes are nearly unchanged, so the remaining data are cleaner inputs for solar-modulation studies.
- PMTs and tanks outside the $3\sigma$ interval of the $\beta_P$ distribution can be rejected as malfunctioning, giving a quantitative, automated quality cut for 1180 PMTs and 295 tanks.
- The $\beta_P$ values for September, October, and November 2016 are consistent within statistics, so the correction can be applied month by month without retuning.
- Multiplicity rates M2, M3, and M4 receive the same correction, allowing tank-level analyses to use the same pressure removal.
Reading between the lines
- A testable extension is to check whether the $3\sigma$ outliers in $\beta_P$ coincide with PMTs flagged by independent diagnostics such as gain drift or dark-noise rate; the paper does not report such cross-validation.
- The same frequency-isolation recipe should transfer to other ground-based detectors at tropical or equatorial latitudes where the 12-hour pressure tide is strong, though the paper only demonstrates it for HAWC.
- The paper leaves open the possibility that temperature or a solar-diurnal harmonic also contributes at 2 cycles per day; correlating the filtered rate component with simultaneous temperature and interplanetary indices would quantify that contamination.
Signed reviews
Editorial analysis
A structured set of objections, weighed in public.
Referee Report
Summary. The paper proposes a method to isolate the atmospheric-pressure modulation in HAWC TDC-scaler rates by exploiting the strong 12-hour (2 cycles per day) periodicity of pressure at the HAWC site. A narrow-band FFT filter around 2 cpd is applied to both the pressure and rate time series, the filtered data are transformed back to the time domain, and the slope of the filtered rate versus filtered pressure yields a pressure coefficient beta_P. The mean beta_P for single-PMT rates is about -0.34%/hPa, with similar values for multiplicity rates. The paper then uses the distribution of per-PMT beta_P values to classify PMTs as healthy or malfunctioning, selecting only PMTs within a 3-sigma range for solar modulation studies. The central claim is that the 2-cpd component of the scaler rates is dominated by pressure, so the filtered signal isolates barometric effects.
Significance. If the causal attribution to pressure is correct, the method provides a simple, data-driven way to estimate beta_P and a potentially useful PMT health diagnostic for HAWC and similar detectors. The paper is a conference proceedings that directly addresses a practical need for solar modulation studies. The manuscript is honest about the data and methods, and the tables of monthly beta_P values are useful. However, the central claim relies on an untested spectral-coincidence argument, and the health classification inherits that assumption, so the significance is limited until the attribution is validated.
major comments (3)
- [Section 3, Eq. (3.1) and text after it] The statement that the narrow-band filter W(f) extracts 'only the 2 cpd barometric effects' is an assumption, not a demonstrated result. The paper shows that both the pressure and rate power spectra exhibit a peak at 2 cpd, but spectral coincidence does not establish that no other physical process contributes coherent power at that frequency. Atmospheric temperature tides and solar semidiurnal cosmic-ray anisotropy are known 2-cpd modulations; if present, they would be absorbed into the fitted beta_P and bias its value. Because beta_P is subsequently used as the PMT health gate in Section 5, this untested causal attribution is load-bearing for the paper's main applications.
- [Section 4, Fig. 9] The demonstration that pressure correction 'reduced drastically' the 2-cpd peak is a consistency check of the fit, not an independent validation. The beta_P used for the correction is estimated from the same filtered 2-cpd band that the correction then removes, so a reduction of that band is expected by construction. The paper does not quantify the residual 2-cpd power after correction or compare it with the level expected from statistical fluctuations. Without such a comparison, the claim that pressure accounts for the bulk of the 2-cpd rate modulation is not supported.
- [Section 5, Fig. 10 and Table 2] The PMT health classification assumes that all healthy PMTs have a common beta_P and that any deviation is due to malfunction, but the paper does not test this against independent diagnostics. For example, beta_P might correlate with PMT gain, operating voltage, or other known characteristics, and electronics or readout differences could produce apparent dispersion in beta_P without indicating a detector fault. To make the health classification convincing, the authors should validate it by showing that flagged PMTs exhibit independent signs of malfunction (e.g., abnormal pulse shapes, rate discontinuities, or poor performance in other analyses) rather than relying on beta_P alone.
minor comments (5)
- [Title and Abstract] The word 'dependance' is misspelled in the title and abstract; it should be 'dependence'.
- [Section 3] The text contains a garbled phrase 'Fast Fourier TransformÂt' (around the FFT definition); this appears to be an encoding artifact and should be corrected.
- [Section 3, Eq. (3.1)] The filter parameters fc and Delta f are introduced without explicitly stating the units of Delta f; the text later says Delta f = 0.01, but it would be clearer to state that this is in cycles per day.
- [Section 4, Fig. 9 caption] The caption does not explain which color corresponds to before and after correction in the power spectrum panel; the text mentions red and blue but the caption relies on the reader to infer the order.
- [Section 5, text after Table 2] The phrase 'The smilar selection process' contains a typo; it should be 'similar'.
Circularity Check
The 2-cpd filter output is labeled 'barometric' by construction, and the fitted beta_P is then used to 'confirm' that the correction removes the 2-cpd peak.
-
fitted input called prediction
[Section 4, 'Pressure correction', Fig. 9; Eqs. (3.2)-(3.3)]
"It is clear from the figure that the amplitude of 2 cpd was reduced drastically which was mainly due to the pressure component, whereas the amplitudes corresponding to other frequencies were almost unaffected."
beta_P was obtained by regressing the 2 cpd filtered R1 on the 2 cpd filtered pressure in Section 3 (Eqs. 3.2-3.3). Subtracting beta_P times pressure from R1 therefore minimizes, by construction, the residual power in that same 2 cpd band. The 'drastic' reduction of the 2 cpd peak is the least-squares objective of the fit, not an independent confirmation that the removed component was generated by pressure. Any coherent non-pressure 2 cpd signal, such as a semidiurnal temperature tide or solar semidiurnal anisotropy, would be absorbed into beta_P and removed as well.
-
self definitional
[Section 3, 'Estimation of pressure coefficient beta_P', Eq. (3.1)]
"To extract only the 2 cpd barometric effects from the data sets we used a narrow-band filter W(f)."
The filter output is labeled 'barometric effects' before any test of exclusivity. The paper later concludes that the 2 cpd peak is 'mainly due to the pressure component' (Section 4), but that conclusion is already assumed in the definition of the filter target. Any 2 cpd signal, whatever its physical origin, is selected by W(f) and attributed to pressure, so the causal claim is built into the choice of the passband rather than derived from the data.
full rationale
The beta_P estimate itself is a legitimate least-squares regression of the 2 cpd filtered rate on the 2 cpd filtered pressure, so the numerical value -0.34 %/hPa has independent content and could be checked against storm data or known muon pressure coefficients. The circularity is in the causal validation, not in the fit. Section 3 defines the narrow-band filter output as 'only the 2 cpd barometric effects,' so any non-pressure 2 cpd modulation is attributed to pressure by construction. Section 4 then shows the 2 cpd peak is 'reduced drastically' after correction; since beta_P was fitted to minimize the residual between the same two filtered time series, that reduction is the expected outcome of the regression, not independent evidence for the pressure origin. The three-month consistency demonstrates stability of the fit but does not test the causal attribution. The PMT-health classification in Section 5 assumes beta_P uniformity and interprets outliers as malfunction without external malfunction records; this is an unsupported assumption and a correctness risk, but it is not a construction-level circularity. The self-citations to refs. [6,7] for 'similar filters' are not load-bearing because the filter W(f) is fully specified in Eq. (3.1) of this paper. Overall, partial circularity: the central coefficient has independent content, but the paper's demonstration that the 2 cpd component is pressure reduces to the filter definition and the fitted correction.
Assumptions & free parameters
free parameters (4)
- Filter half-width delta_f in W(f) =
0.01 cpd
- Pressure bin width =
0.1 hPa
- Outlier cutoff in sigma =
3 sigma, with 2 sigma and 5 sigma also shown
- Linear versus exponential fit choice =
Linear method chosen
assumptions (5)
- domain assumption The 12-hour oscillation at the HAWC site is a solar atmospheric tide with no significant non-pressure contribution at 2 cpd.
- domain assumption TDC-scaler rates respond to pressure according to R(P)=R(Pm) exp(beta_P delta_P) with a single beta_P per PMT.
- domain assumption Pressure modulation is a purely physical atmospheric phenomenon, so all PMTs should exhibit the same percentage pressure coefficient regardless of gain and quantum efficiency.
- domain assumption The pressure measured by the single HAWC barometer represents the air column over every PMT and tank.
- standard math Standard FFT and IFFT narrow-band filtering preserve the phase and amplitude of the 2 cpd component.
Cite this review
Pith. "Pith review of Atmospheric pressure dependance of HAWC scaler system." pith.science (2026). https://pith.science/paper/RREMGWGQ
@misc{pith2026190807473,
  author       = {Pith},
  title        = {Pith review of: Atmospheric pressure dependance of HAWC scaler system},
  year         = {2026},
  howpublished = {\url{https://pith.science/paper/RREMGWGQ}},
  note         = {Machine review of arXiv:1908.07473}
}
abstract
The variation in atmospheric pressure is due to changes in mass of the air column above, which in turn resembles the density variation of atmosphere and will affect the decay of secondary particles of cosmic rays. The ground based cosmic ray detectors observe pressure dependent variation in their flux. The High Altitude Water Cherenkov (HAWC) gamma ray observatory is a great detector of secondary particles because of its high altitude, high uptime, and large area (including total photo-cathode area), which makes the HAWC scaler system an ideal instrument for solar modulation studies. Although, in order to perform these studies it is necessary to isolate and remove the atmospheric modulations. The observed rate in each PMT has signatures of both the solar and atmospheric modulations, which makes it difficult to measure the pressure coefficient ($\beta_P$ ). The pressure at the HAWC site shows a periodic behavior ($\sim$ 12 hours), which also reflects in the scalar rates. This periodic property was used to isolate the pressure modulation and $\beta_P$ were estimated with accuracy. Since the pressure dependence is a physical phenomenon, the estimated coefficients for PMTs should be identical, any deviation from this can be due to malfunction of the PMT. This make this method a useful tool to identify the malfunctioning PMTs and help us to isolate them from the analysis. In this analysis we are presenting the method of estimation of the pressure coefficients and its usage to correct the HAWC scalar data to make it suitable for the solar modulations studies.
Figures


Figures from the paper (3 more)


Reference graph
Works this paper leans on
- [1]
-
[2]
Burlaga, L. F., et. al, 1985, J. Geophys. Res. 90, 12027. doi:10.1029/JA090iA12p1202
-
[3]
P. Subramanian, et al., Astron. Astrophys. 494 (2009) 1107
work page 2009
- [4]
- [5]
- [6]
- [7]
- [8]
Show all 23 references
-
[9]
Greisen, Ann
K. Greisen, Ann. Rev. Nucl. Sci. 10 (1960) 63
1960
-
[10]
Olive, et al., Chinese Phys
K.A. Olive, et al., Chinese Phys. C 38 (2014) 090001
2014
-
[11]
Grieder, Cosmic Rays at Earth, Elsevier Science, (2001)
P.K.F. Grieder, Cosmic Rays at Earth, Elsevier Science, (2001)
2001
-
[12]
Achard, et al., Phys
P. Achard, et al., Phys. Lett. B 598 (2004) 15
2004
-
[13]
of the 33^ rd International Cosmic Ray Conference
Alejandro Lara, 2013, Proc. of the 33^ rd International Cosmic Ray Conference. Rio DE Janeiro, Brasil
2013
-
[14]
Lindzen R. S., Ann. Rev. Planet Sci. (1979), 7
1979
-
[15]
Carrasco E., et al., Mon. Not. R. Astron. Soc. (2009), 398, 407-421
2009
-
[16]
Mohanty, et al., Proceedings of the 34^ th International Cosmic Ray Conference
P.K. Mohanty, et al., Proceedings of the 34^ th International Cosmic Ray Conference. The Hague, The Netherlands , POS(ICRC2015)042
-
[17]
http://root.cern.ch/root/html/TVirtualFFT.html
-
[18]
Harris, Proc
F.J. Harris, Proc. IEEE 66 (1978) 51
1978
-
[19]
S., et al., 2014, Sol
Potgieter, M. S., et al., 2014, Sol. Phys., 289, 391
2014
-
[20]
Giacalone, J., & Jokipii, J. R. 1999, ApJ, 520, 204
1999
-
[21]
Candia, J., & Roulet, E. 2004, J. Cosmol. Astropart. Phys., 10, 007
2004
-
[22]
H., et al., 2003, ApJ, 590, 53
Matthaeus, W. H., et al., 2003, ApJ, 590, 53
2003
-
[23]
2010, ApJ, 720, 127
Shalchi, A. 2010, ApJ, 720, 127
2010
Reviewed August 14, 2026 · model on record in the stance chip above.
Discussion (0). Continue with ORCID to comment.