REVIEW 4 major objections 5 minor 10 references
Galactic Cosmic Ray Sun Shadow during the declining phase of cycle 24 observed by HAWC
T0 review · 4 major / 5 minor · reviewed 2026-08-14 · deepseek-v4-flash
Pith's one-line read The Sun's cosmic-ray shadow weakened steadily from 2016 to 2018 and tracked the photospheric magnetic field linearly, with opposite signs between the active-region belt and polar caps.
desk verdict A useful but undercontrolled dataset: the HAWC Sun Shadow shows a decreasing trend and opposite-sign field correlations, but without a Moon-shadow control or fit uncertainties the solar origin is not yet secured. read the letter →
The pith
A machine-rendered reading of the paper's core claim, the machinery that carries it, and where it could break.
The reading
What carries the argument
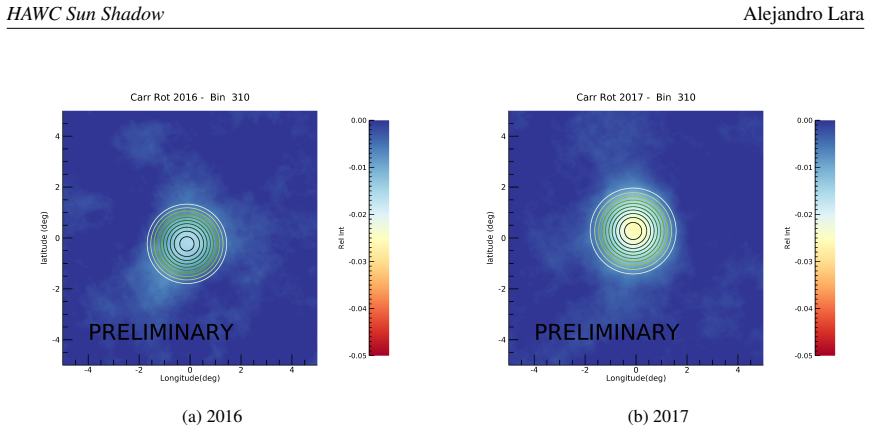
The central object is the Sun Shadow relative intensity $SS_{RI}$, obtained by fitting a circular 2D gaussian $F(x,y) = A_0 + A_{RI} \exp(-(((x-C_x)/W_x)^2 + ((y-C_y)/W_y)^2)/2)$ to HAWC maps of cosmic-ray deficit in the solar direction. $A_{RI}$, the gaussian amplitude, is the time series analyzed. The comparison variable is the median photospheric magnetic field, computed per Carrington rotation in two latitude bands: the active-region belt (−40° to 40°) and polar caps (|lat| ≥ 60°). The argument also relies on the Larmor-radius formula $R_L = (3.3\times 10^{12}\ \mathrm{cm}) \times E(\mathrm{GeV})/B(\mu\mathrm{G})$ with the coronal field modeled as $B_r = B_{\mathrm{phot}}/(r - r_{\mathrm{phot}})^2$ to compute deflection angles. These ingredients together convert a detector-level deficit map into a measurement of solar magnetic field evolution.
What would settle it
Compare the Sun Shadow amplitude with the Moon Shadow amplitude measured with the same HAWC maps over the same time windows. The Moon Shadow is produced by the same detector-level cosmic-ray deficit, but the Moon has no magnetic field. If the Moon Shadow amplitude also declines at a similar rate, the reported Sun Shadow decrease and its field correlations are detector or atmospheric artifacts.
Extended reading notes
Core claim
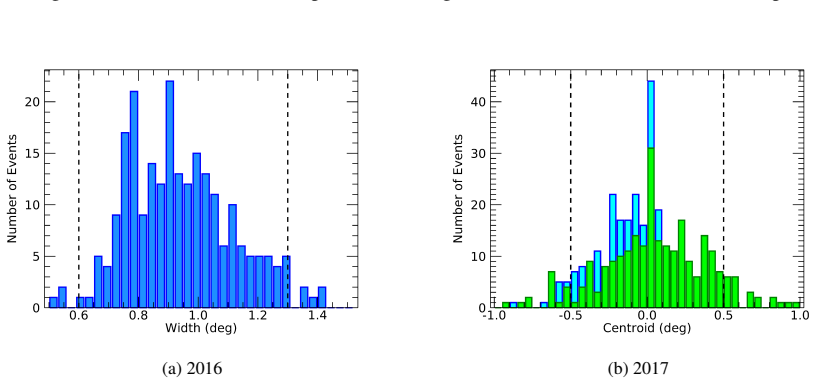
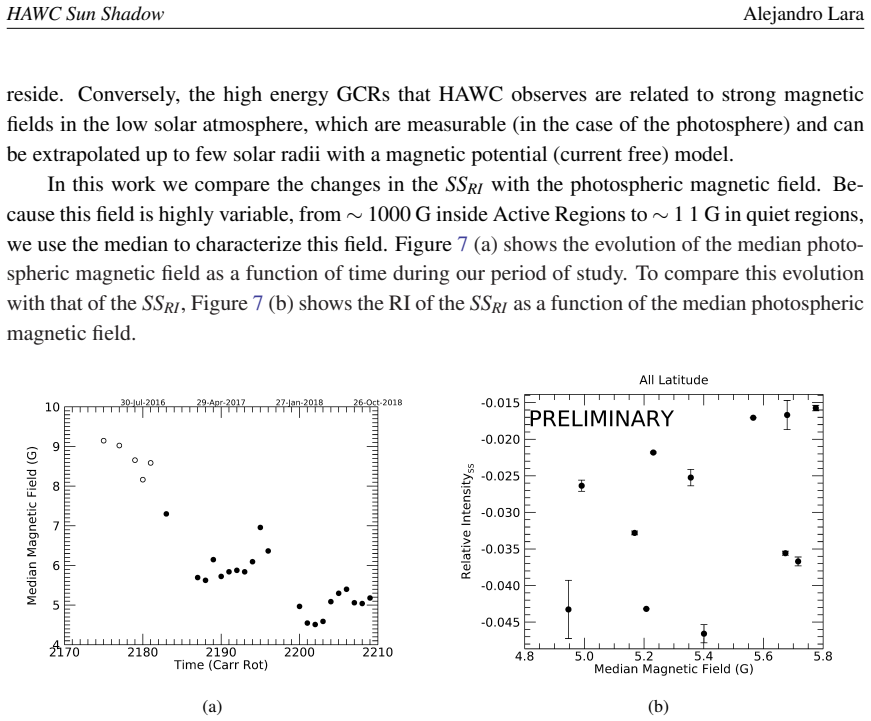
The paper's central claim is that the relative intensity of the Sun Shadow, measured by the amplitude of a 2D gaussian fitted to HAWC sky maps, falls approximately linearly with time from 2016 to 2018 at a rate of about −0.013 to −0.015 per year. Comparing this amplitude with median photospheric magnetic field values per Carrington rotation, the paper finds a positive linear relationship with the active-region belt field and a negative linear relationship with the polar field, reflecting the transition from a multipolar to a dipolar heliospheric field topology. The authors state that these relationships hold only when the median field is below 8 G; during higher-activity rotations the linear correlation breaks. They also present trajectory simulations showing that 10-200 TeV protons are deflected by less than about 2 degrees in a spherically symmetric coronal magnetic field, which they interpret as the mechanism that produces the observed shadow.
Load-bearing premise
The analysis takes the year-to-year decrease in the Sun Shadow amplitude at face value, assuming HAWC's angular reconstruction, acceptance, and atmospheric background model stayed stable from 2016 to 2018, without using a reference source such as the Moon Shadow to separate solar changes from detector drift.
Editorial extensions
If this is right
- If the linear relation holds, the Sun Shadow amplitude measured per Carrington rotation can be used as a remote, continuous monitor of the median photospheric magnetic field during low-activity phases, providing a solar probe at TeV energies.
- The opposite signs of the two slopes imply that the active-region belt and polar fields affect the cosmic-ray deficit in opposite ways, consistent with the claimed shift from a multipolar to a dipolar heliospheric field topology as the cycle declines.
- The 8 G validity threshold means the linear calibration applies only in the declining and minimum phases; using it to infer field strengths during solar maximum or during active rotations would require a different model.
- If 10-200 TeV cosmic rays are deflected by only a few degrees, as the simulation indicates, then the Sun Shadow is created very close to the Sun and is insensitive to interplanetary magnetic structures, distinguishing it from lower-energy cosmic-ray modulation signals.
Reading between the lines
- The authors do not compare the Sun Shadow with the Moon Shadow; doing so would test whether the declining trend is truly solar, since the Moon Shadow carries the same detector-level signature without a magnetic field.
- The reported slopes imply a sensitivity of roughly 1.5% shadow-amplitude change per gauss of active-region field and 1.2% per gauss of polar field; these numbers could be turned into a quantitative test of coronal magnetic-field models by predicting the shadow depth from magnetogram data.
- A natural extension is to continue the same analysis through the cycle 24/25 minimum and into the next rising phase; the paper's 8 G threshold predicts that the linear relations should reappear only when the median field drops back below 8 G and then break again as activity rises.
- Because the analysis uses only the gaussian amplitude, the fitted width and centroid (which the paper describes but does not use) may carry additional information about the angular structure of the deflection; reanalyzing those parameters in the same framework could sharpen the physical interpretation.
Signed reviews
Editorial analysis
A structured set of objections, weighed in public.
Referee Report
Summary. The paper presents three years (2016–2018) of HAWC observations of the Sun Shadow (SS), the deficit of 10–200 TeV cosmic rays from the solar direction. It reports a decreasing trend in the relative intensity of the deficit (SS_RI) over time and claims a linear relationship between SS_RI and the median photospheric magnetic field in the active-region belt, with the opposite sign for the polar fields, valid only when the median field is below 8 G. A simple simulation of cosmic-ray deflection in a radial coronal magnetic field is used to argue that particles in the HAWC energy range are deflected by a few degrees.
Significance. If the empirical relationships hold, the paper would introduce a new remote-sensing diagnostic of solar magnetic fields using TeV cosmic-ray shadows, with the attractive feature of opposite-sign slopes for the toroidal (low-latitude) and poloidal (polar) field components. The use of Carrington-rotation integration to track the shadow on monthly timescales and the explicit separation of low- and high-latitude photospheric fields are valuable steps. However, the quantitative claims currently lack uncertainty estimates, goodness-of-fit information, and any control for instrument or atmospheric stability, so the significance is conditional on addressing these issues.
major comments (4)
- [Sec. 2, Fig. 5] The central decreasing trend of SS_RI over 2016–2018 is presented without a control for detector or atmospheric stability. HAWC's angular reconstruction, acceptance, and background model can vary on annual timescales, and the Sun-shadow deficit is a small relative-intensity modulation. Because the Moon produces the same type of cosmic-ray deficit without a solar magnetic field, a same-pipeline Moon-shadow analysis is the natural control; its absence leaves open the possibility that the observed decline—and therefore the correlations in Sec. 3—are dominated by instrumental drift rather than solar physics. Please add such a control or otherwise demonstrate stability of the relevant HAWC quantities over the period.
- [Sec. 3, Fig. 8] The quoted linear rates, 1.46 × 10^-2 G^-1 for the active-region belt and -1.19 × 10^-2 G^-1 for the polar caps, are given without uncertainties, correlation coefficients, p-values, or goodness-of-fit statistics. These quantities are load-bearing for the paper's main claim, and the reader cannot assess whether the linearity is statistically significant or whether the slopes are determined to even one significant figure. Please report the full regression output, including confidence intervals and a chi-squared or similar measure, for both fits.
- [Sec. 3, Fig. 8] The validity range 'B < 8 G' is defined by excluding Carrington rotations 2179–2181, which the authors state depart from the linear relation. This is a post hoc selection that can artificially create a linear trend. Please show that the linear model is a good fit within the remaining range without the excluded points, and discuss whether the threshold is robust to small variations. For example, test whether the slopes and their significance change if the excluded set is expanded or contracted by one rotation.
- [Abstract vs. Sec. 3] The active-region latitude band is defined inconsistently: the abstract states -40° ≤ lat ≤ 40°, while Sec. 3 and the Summary use -30° to 30° (with the Summary also containing a typo '−30° ≥ Lat ≥ 30°'). Since the median field and the derived slope depend on the chosen band, please specify the exact band used for the fits and use it consistently throughout the paper.
minor comments (5)
- [Sec. 2, uncertainty formula] The uncertainty expression, ε = sqrt(ε_RI² + A_RI cos(9/2 θ_az + π)²), is unclear: the text below it refers to A0 and ε_fit as the fitted amplitude and its error, but these symbols do not appear in the formula. Please define all symbols and verify that the formula is written correctly.
- [Sec. 2.1] The statement that the SS_RI decreases at rates of -0.013 and -0.015 year^-1 is quoted without uncertainties or a measure of scatter. Please provide fit errors and, if possible, the reduced chi-squared for these linear fits.
- [Fig. 8] Figure 8 does not show the fitted lines or confidence bands for the linear relationships. Adding the best-fit lines and, where feasible, the excluded Carr_Rots (2179–2181) in a distinct color would make the claimed linearity and the 8 G threshold much easier to evaluate.
- [Sec. 4, Eq. (4.1)] The Larmor radius formula uses B in µG, but the simulation input Bphot is described as being in the range 0.1 to 20 G. Please clarify the unit conversion used in the numerical integration.
- [Abstract and Sec. 1] There are minor language issues, such as 'form 2016 to 2018' in the abstract and 'order quantify' in Sec. 2. A careful proofread would improve readability.
Circularity Check
No significant circularity: SS_RI is an independently fitted observable; the magnetic-field correlations and bending simulation are outputs, not inputs.
full rationale
The paper's central observable, A_RI, is obtained by fitting a two-dimensional Gaussian to HAWC relative-intensity maps (Sec. 2), and the photospheric magnetic-field medians come from independent magnetogram data (Sec. 3). The claimed linear and inverse-linear relationships are the output of comparing these two independent time series, not parameters that were fed back into the fit. The simulation in Sec. 4 uses an assumed symmetric B_phot and the Larmor-radius formula to compute deflection angles; it is a plausibility check and does not use A_RI to constrain the model, so it does not reduce to the observed slopes. The post-hoc 8 G threshold excludes some Carrington rotations, but this is a data-selection choice rather than a fitted quantity renamed as a prediction. The only self-citation, reference [9] by Enriquez-Rivera and Lara, supports the standard statement that the Sun shadow arises from the Sun's physical presence and magnetic deflection; it is not load-bearing for the paper's quantitative claims. Concerns about detector drift or the absence of a Moon-shadow control are legitimate correctness risks, not circularity, because they do not show that any equation or claimed prediction is equivalent to its inputs by construction.
Assumptions & free parameters
free parameters (6)
- Per-bin Gaussian amplitude A_RI (relative intensity deficit) =
Plotted per year and per Carrington rotation; not tabulated
- Linear slope: SS_RI vs active-region median field =
1.46e-2 G^-1
- Linear slope: SS_RI vs polar median field =
-1.19e-2 G^-1
- Validity threshold on median photospheric field =
8 G
- Time decay rate of SS_RI =
-0.013 yr^-1 and -0.015 yr^-1
- Gaussian selection cuts on width and centroid =
0.6 <= W <= 1.3 and |Cx,y| <= 0.5
assumptions (7)
- domain assumption HAWC standard event reconstruction and sky-map procedures [2,7,8] produce unbiased, stable cosmic-ray deficit estimates over 2016-2018.
- domain assumption The photospheric magnetic field medians come from a reliable, unspecified magnetogram source and correctly represent the active-region belt and polar caps.
- domain assumption The deficit mapped as the Sun Shadow is caused mainly by magnetic deflection of cosmic rays near the Sun rather than by detector artifacts or pure geometric blockage.
- domain assumption A circular 2D Gaussian with Wx=Wy plus a flat background adequately describes each Sun Shadow map.
- ad hoc to paper The simplified field model Br = Bphot/(r-rphot)^2 with integration out to 3 R_sun approximates real coronal magnetic bending for 10-200 TeV particles.
- ad hoc to paper The error formula epsilon = sqrt(epsilon_RI^2 + A_RI cos(9/2 theta_az + pi)^2) correctly describes the uncertainty of each SS_RI measurement.
- standard math The Larmor radius expression RL = (3.3e12 cm) E(GeV)/B(uG) and the small-step bending dTheta = dL/RL apply to the trajectory integration.
Cite this review
Pith. "Pith review of Galactic Cosmic Ray Sun Shadow during the declining phase of cycle 24 observed by HAWC." pith.science (2026). https://pith.science/paper/TVBQ5YID
@misc{pith2026190807509,
  author       = {Pith},
  title        = {Pith review of: Galactic Cosmic Ray Sun Shadow during the declining phase of cycle 24 observed by HAWC},
  year         = {2026},
  howpublished = {\url{https://pith.science/paper/TVBQ5YID}},
  note         = {Machine review of arXiv:1908.07509}
}
abstract
The High Altitude Water Cherenkov (HAWC) array is sensitive to high energy Cosmic Rays (CR) in the $\sim 10$ to $\sim 200$ TeV energy range, making it possible to construct maps of the so called "Sun Shadow" ($SS$), i. e. of the deficit of CR coming from the direction of the Sun. In this work, we present the variation of the Relative Intensity of the deficit ($SS_{RI}$) for three years of HAWC observations form 2016 to 2018 in which we found a clear decreasing trend of the ($SS_{RI}$) over the studied period, corresponding to the declining phase of the solar cycle 24. By comparing the $SS_{RI}$ with the photospheric magnetic field evolution, we show that there is a linear relationship between the $SS_{RI}$ and the median photospheric magnetic field of the Active Region belt (-40$^\circ \le$ lat $\le$ 40$^\circ$) and a inverse linear relationship with the polar photospheric magnetic field (lat $\ge \pm$ 60$^\circ$). The former relationship is due to the magnetic field causing a deviation of the CR, whereas the latter reflects the change of the heliospheric field topology from multipolar to dipolar configurations. These relationships are valid only when the median magnetic field is lower than 8 G, during the declining and minimum phases of the solar cycle 24. Finally, we show that relativistic charged particles, in the 10 to 200 TeV energy range, are deflected a few degrees.
Figures


Figures from the paper (6 more)




Reference graph
Works this paper leans on
-
[1]
Abeysekara, A. U., and 104 colleagues 2014.\ Sensitivity of HAWC to high-mass dark matter annihilations.\ Physical Review D 190 , 122002
work page 2014
-
[2]
Abeysekara, A. U., and 106 colleagues 2017.\ Observation of the Crab Nebula with the HAWC Gamma-Ray Observatory.\ The Astrophysical Journal 843 , 39
work page 2017
-
[3]
Haasbroek, L. J., Potgieter, M. S.\ 1998.\ A new model to study galactic cosmic ray modulation in an asymmetrically bounded heliosphere.\ Journal of Geophysical Research 103 , 2099
work page 1998
-
[4]
Moraal, H., Stoker, P. H.\ 2010.\ Long-term neutron monitor observations and the 2009 cosmic ray maximum.\ Journal of Geophysical Research (Space Physics) 115 , A12109
work page 2010
-
[5]
Braun, I., Engler, J., H \"o randel, J. R., Milke, J.\ 2009.\ Forbush decreases and solar events seen in the 10-20 GeV energy range by the Karlsruhe Muon Telescope.\ Advances in Space Research 43 , 480
work page 2009
-
[6]
K.\ 1992.\ Cosmic ray albedo -rays from the quiet Sun ..\ NASA Conference Publication 542
Seckel, D., Stanev, T., Gaisser, T. K.\ 1992.\ Cosmic ray albedo -rays from the quiet Sun ..\ NASA Conference Publication 542
work page 1992
-
[7]
Abeysekara, A. U., and 102 colleagues 2018.\ Observation of Anisotropy of TeV Cosmic Rays with Two Years of HAWC.\ The Astrophysical Journal 865 , 57
work page 2018
-
[8]
G \'o rski, K. M., and 6 colleagues 2005.\ HEALPix: A Framework for High-Resolution Discretization and Fast Analysis of Data Distributed on the Sphere.\ The Astrophysical Journal 622 , 759
work page 2005
Show all 10 references
-
[9]
Enriquez-Rivera, O., Lara, A.\ 2015.\ The Galactic cosmic-ray Sun shadow observed by HAWC.\ 34th International Cosmic Ray Conference (ICRC2015) 99
2015
-
[10]
J., Potgieter, M
Haasbroek, L. J., Potgieter, M. S.\ 1998.\ A new model to study galactic cosmic ray modulation in an asymmetrically bounded heliosphere.\ Journal of Geophysical Research 103, 2099
1998
Reviewed August 14, 2026 · model on record in the stance chip above.
Discussion (0). Continue with ORCID to comment.