REVIEW 3 major objections 3 minor 1 cited by
XMM-Newton observations of the symbiotic recurrent nova T CrB: evolution of X-ray emission during the active phase
T0 review · 3 major / 3 minor · reviewed 2026-08-14 · deepseek-v4-flash
Pith's one-line read The recurrent symbiotic nova T CrB shows a 6000-6500 s periodic modulation in its soft X-ray emission, which the authors interpret as the rotation period of the accreting white dwarf.
desk verdict Solid spectral evolution study with a promising but statistically underproven rotation period claim. read the letter →
The pith
A machine-rendered reading of the paper's core claim, the machinery that carries it, and where it could break.
The reading
What carries the argument
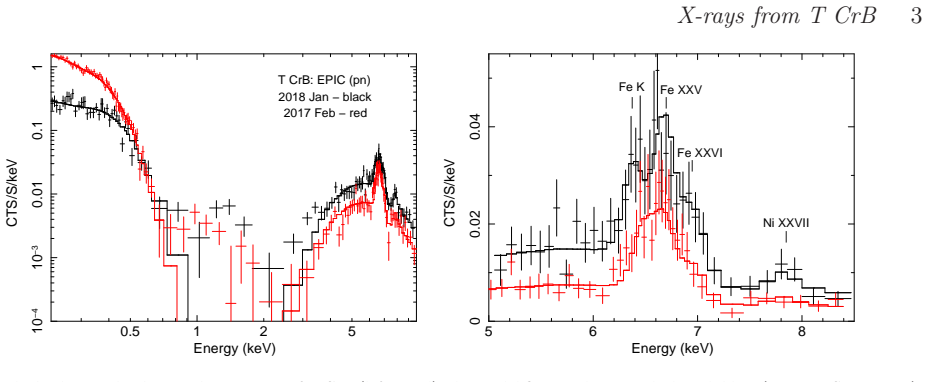
The argument rests on a two-component spectral decomposition: black-body emission for the soft band, an optically thin plasma model with partial-covering absorption for the hard band, and a Gaussian component for the Fe K line. The periodicity search uses the Lomb-Scargle periodogram, a spectral analysis method for unevenly sampled time series, applied to the EPIC-pn light curves, with phase folding and phase-resolved spectral fits as cross-checks. The proposed physical mechanism is that accretion-disk boundary-layer instabilities dump material onto the white dwarf surface, where it radiates as the black-body soft component; the 6000-6500 s modulation is then the white dwarf's rotation carrying this bright surface region in and out of view.
What would settle it
Simulate many red-noise light curves with the observed flickering power spectrum, run the same Lomb-Scargle search, and count how often a 6000-6500 s peak of equal height arises by chance; if that fraction is above a few percent, the periodicity is not established. A direct observational test is a longer, higher-count X-ray observation during the same active phase: the ~1.7 h peak should reappear at a consistent period and phase if it is real.
Extended reading notes
Core claim
During the active phase that began in 2014-2015, T CrB's X-ray spectrum consists of a soft black-body component (0.2-0.6 keV) unique to the active phase and a heavily absorbed optically thin plasma component (2-10 keV) that persists in both phases but is roughly an order of magnitude stronger and about twice as hot ($kT \approx 16$ keV) in quiescence. Between 2017 February and 2018 January, the soft component's luminosity dropped by more than an order of magnitude while its temperature rose by about 28%, and the hard component's flux roughly doubled. The soft X-ray light curve contains a periodic signal at 6036 s (2018) and 6496 s (2017), with false-alarm probabilities below $10^{-5}$ and $10^{-8}$; folded light curves and phase-resolved spectroscopy confirm the modulation, which the authors interpret as the rotation period of the white dwarf.
Load-bearing premise
The 6000-6500 s signal is a genuine periodic modulation of T CrB's soft X-ray emission rather than a chance product of flickering, and the 6036 s and 6496 s periods measured a year apart are the same underlying clock.
Editorial extensions
If this is right
- The soft X-ray component can serve as a phase marker: its presence signals an active phase, and its decay over time traces how fast the deposited surface material is processed or dispersed.
- The hard component tracks the rebuilding of the accretion-disk boundary layer; continued monitoring should show its flux and temperature climbing back toward quiescent values as the active phase ends.
- If the 6000-6500 s modulation is white-dwarf rotation, future X-ray observations can measure spin stability or spin-up from accretion torques, turning T CrB into a laboratory for accretion onto white dwarfs.
- The X-ray-derived upper limit on the M-giant wind mass-loss rate (less than about $5\times10^{-10}\,M_\odot$ yr$^{-1}$) is more stringent than the radio-based limit, constraining wind-fed accretion in the binary.
- The near-unity partial-covering factor and the weak 0.6-2 keV emission require a special geometry, such as a clumpy disk wind or a sight line over the disk edge, which future multi-wavelength observations could test.
Reading between the lines
- If the rotation identification holds, phase-resolved X-ray spectroscopy across many cycles could map the surface hotspot geometry of the white dwarf, in the spirit of what is done for magnetic cataclysmic variables; the paper does not attempt such a map.
- The same two-component behavior - a soft black body appearing and decaying during an active phase while the hard boundary-layer component weakens - might be a general signature of disk instabilities in symbiotic recurrent novae, and other members of the delta X-ray class could be searched for analogous soft periodicity.
- A natural test of the interpretation is to check whether the period drifts between the current active phase and the next one: if the white dwarf is being spun up by accreted material, even a small period change would distinguish rotation from a disk or wind oscillation; this test is not made in the paper.
- The paper's suggestion that the soft component's gravitational energy could imply a much higher accretion rate (up to about $10^{-7}\,M_\odot$ yr$^{-1}$) has implications for the nova recurrence timescale; if the soft component is powered by surface burning, the recurrence interval could be shorter than the 80-year estimate.
Signed reviews
Editorial analysis
A structured set of objections, weighed in public.
Referee Report
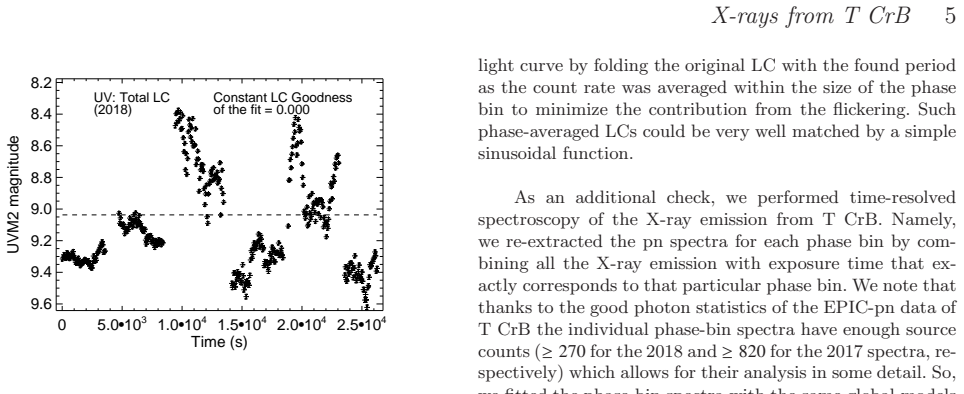
Summary. The paper presents XMM-Newton EPIC and OM observations of the symbiotic recurrent nova T CrB obtained on 2017 February 23 and 2018 January 30 during its active phase. The authors fit the 0.2-10 keV spectra with a partly covered blackbody plus hot plasma model, compare the results with Suzaku and Swift data from the quiescent phase, and report that the soft (0.2-0.6 keV) component faded while the hard (2-10 keV) component brightened between the two epochs. They confirm strong stochastic variability (flickering) in both X-ray and UV light curves, and claim the detection of a periodic modulation of 6000-6500 s in the soft X-ray light curves, which they interpret as the white-dwarf rotational period.
Significance. If the periodicity is real, it is a valuable new constraint on the spin and accretion geometry of the white dwarf in T CrB, and it is the first such periodic signal reported in the active-phase X-ray emission. The comparison of active and quiescent X-ray properties, including the long-term light curve and the tentative Ni overabundance, provides useful context for the ongoing activity of this recurrent nova. The spectral modeling is standard and carefully executed, and the authors are appropriately cautious about the qualitative nature of their physical interpretation and the statistical weakness of the Ni abundance result.
major comments (3)
- [§3.3, Fig. 5] The claimed detection of 6000-6500 s periodicity in the soft X-ray light curves rests on Lomb-Scargle false-alarm probabilities computed under white-noise assumptions, while the authors themselves state that flickering is present in all light curves and can create false periodogram signals. No red-noise model is fitted or simulated, so the quoted FAPs (<1e-5 in 2018, <1e-8 in 2017) likely overstate the significance. Because the periodicity is the central new claim, this is a load-bearing weakness; the authors should estimate significance under a realistic red-noise model (e.g., by fitting a power-law or quasi-periodic process to the periodogram, or by Monte Carlo simulations with red-noise light curves) and quote the resulting FAPs.
- [§3.3, Fig. 5] The two epochs yield periods of 6036 s and 6496 s, a ~7.6% difference, which the paper describes as repeatability because the values "differ by less than 10%". The paper does not quantify whether this difference is consistent with the expected peak width or frequency resolution; for the 2018 observation the formal frequency resolution (~1/20.1 ks) corresponds to a period uncertainty of roughly a thousand seconds at 6000 s, so the difference is not obviously significant, but without a stated uncertainty budget the claim of repeatability is not established. The folded light curves and time-resolved spectroscopy also use the same data and the same period, so they are consistency checks rather than independent confirmations. The authors should quantify the period uncertainties and address the probability that two independent red-noise realizations would produce peaks this close.
- [§3.3, fourth row of Fig. 5] The time-resolved spectroscopy shows flux modulation consistent with the period, but because the period and phase bins are derived from the same observations, this check does not independently rule out a stochastic or quasi-periodic alternative. The text in Section 3.3 presents this as part of the "accumulative evidence" for periodicity; the authors should explicitly acknowledge that the phase-folded and time-resolved checks are not independent tests, and should base the detection claim primarily on a red-noise-corrected significance estimate.
minor comments (3)
- [Throughout] The manuscript contains numerous typographical errors and misspellings (e.g., "Febuary" in Section 2, "peioric" and "Lomb-Sargle" in Section 3.3, "sold sign" in the conclusions, "forth row" in the Fig. 5 caption, "berfore" and "qiiescent" in Appendix A, "veloicity" and "cosiderably" in Section 4); a careful proofread is needed.
- [Fig. 5 caption] The caption states that the dashed lines mark false-alarm probability levels of 10^-5 (2018) and 10^-8 (2017), but the lines are not labeled inside the panels; adding the values directly on the periodogram panels would improve readability.
- [§3.3] The sentence "the light curves folded with the suggested period do confirm its presence" is grammatically awkward ("do confirm"); rephrasing would clarify the meaning.
Circularity Check
No significant circularity: the 6000-6500 s periodicity is measured directly from the light curves, and the white-dwarf rotation association is a post-hoc interpretation.
full rationale
The central new claim, the 6000-6500 s periodic variability in the soft X-ray emission, is derived directly from the XMM-Newton pn light curves using the Lomb-Scargle periodogram, phase folding, and phase-resolved spectroscopy. The period is not set by any model or by the white-dwarf rotation interpretation; the rotation is introduced only after the detection, in the statement 'We associate this periodic variability with the rotational period of the white dwarf in this symbiotic binary.' The spectral decomposition (Section 3.2, Table 1) uses standard XSPEC models (black-body plus absorbed optically-thin plasma), with parameters fitted to the data, and none of the paper's main conclusions is defined in terms of a fitted parameter. The 2017 and 2018 observations are independent data sets, and the repeatability of the period across them is presented as supporting evidence, not as a consequence of the analysis setup. The authors explicitly acknowledge the red-noise caveat ('presence of flickering may result in suggesting some false signals from periodogram analysis'), which is a statistical-significance concern rather than a circular reduction. The citations to Luna et al. (2018) are for the earlier detection of the soft component in the same 2017 observation and for a partial-covering spectral model; they are not load-bearing for the periodicity claim. No self-definitional step, no fitted input presented as a prediction, and no uniqueness-imported-from-authors argument is present. The derivation chain is therefore self-contained with respect to its inputs.
Assumptions & free parameters
free parameters (8)
- N_H,1 (interstellar absorption column) =
5.19e20 cm^-2 (2017); 5.27e20 cm^-2 (2018)
- CF (partial-covering factor) =
0.997 (2017); 0.995 (2018)
- N_H,2 (local absorption column) =
4.33e23 cm^-2 (2017); 3.31e23 cm^-2 (2018)
- kT_BB (black-body temperature) =
0.035 keV (2017); 0.045 keV (2018)
- R_BB (black-body radius) =
2285 km (2017); 281 km (2018)
- kT (plasma temperature of hard component) =
7.53 keV (linked in Model D); 8.26 keV (Model C 2018)
- EM (emission measure) =
1.18-2.35e55 cm^-3 depending on model/epoch
- Fe and Ni abundances =
Fe ~0.8-0.97, Ni ~3.8-4.6 (solar units)
assumptions (5)
- standard math XSPEC models (wabs, partial covering, bbodyrad, vapec/vmcflow) correctly describe interstellar absorption and thermal plasma emission.
- domain assumption The soft component is optically-thick black-body emission from the white dwarf surface, and the hard component is optically-thin plasma in the accretion disk boundary layer.
- domain assumption The partial-covering absorption geometry with CF ~0.995 is the correct description of the 0.6-2 keV emission.
- domain assumption Distance to T CrB is 806 pc (Bailer-Jones et al. 2018) and WD mass/radius are M=1.2 M_sun, R=5000 km (Belczynski & Mikolajewska 1998; Luna et al. 2018).
- domain assumption Solar abundances (Anders & Grevesse 1989) with free Fe and Ni.
Cite this review
Pith. "Pith review of XMM-Newton observations of the symbiotic recurrent nova T CrB: evolution of X-ray emission during the active phase." pith.science (2026). https://pith.science/paper/73I5OK4X
@misc{pith2026190807722,
  author       = {Pith},
  title        = {Pith review of: XMM-Newton observations of the symbiotic recurrent nova T CrB: evolution of X-ray emission during the active phase},
  year         = {2026},
  howpublished = {\url{https://pith.science/paper/73I5OK4X}},
  note         = {Machine review of arXiv:1908.07722}
}
read the original abstract
We present an analysis of the XMM-Newton observations of the symbiotic recurrent nova T CrB, obtained during its active phase that started in 2015. The XMM-Newton spectra of T CrB have two prominent components: a soft one (0.2 - 0.6 keV), well represented by black-body emission, and a heavily absorbed hard component (2 - 10 keV), well matched by optically-thin plasma emission with high temperature (kT ~ 8 keV). The XMM-Newton observations reveal evolution of the X-ray emission from T CrB in its active phase. Namely, the soft component in its spectrum is decreasing with time while the opposite is true for the hard component. Comparison with data obtained in the quiescent phase shows that the soft component is typical only for the active phase, while the hard component is present in both phases but it is considerably stronger in the quiescent phase. Presence of stochastic variability (flickering) on time-scales of minutes and hours is confirmed both in X-rays and UV (UVM2 filter of the XMM-Newton optical monitor). On the other hand, periodic variability of 6000-6500 s is found for the first time in the soft X-ray emission (0.2 - 0.6 keV) from T CrB. We associate this periodic variability with the rotational period of the white dwarf in this symbiotic binary.
Figures


Figures from the paper (3 more)


Forward citations
Cited by 1 Pith paper
-
When will T Coronae Borealis next erupt as a nova? Constraints from recurrence, orbital phase, and accretion-state evolution
T CrB's next eruption is not uniquely predictable; conditional scenarios point to a possible 2026 December eruption if the current decline mimics 1946, or a lower limit near 2029 May if the recent high state left an a...
Reference graph
Works this paper leans on
-
[1]
Anders E., Grevesse N., 1989, @doi [ ] 10.1016/0016-7037(89)90286-X , http://adsabs.harvard.edu/abs/1989GeCoA..53..197A 53, 197
-
[2]
A., 1996, in Jacoby G
Arnaud K. A., 1996, in Jacoby G. H., Barnes J., eds, Astronomical Society of the Pacific Conference Series Vol. 101, Astronomical Data Analysis Software and Systems V. p. 17
1996
-
[3]
Bailer-Jones C. A. L., Rybizki J., Fouesneau M., Mantelet G., Andrae R., 2018, @doi [ ] 10.3847/1538-3881/aacb21 , https://ui.adsabs.harvard.edu/abs/2018AJ....156...58B 156, 58
-
[4]
Belczynski K., Mikolajewska J., 1998, @doi [ ] 10.1046/j.1365-8711.1998.01301.x , http://adsabs.harvard.edu/abs/1998MNRAS.296...77B 296, 77
arXiv 1998
-
[5]
N., Zuckerman B., 2005, @doi [ ] 10.1051/0004-6361:20053340 , http://adsabs.harvard.edu/abs/2005A
Berger L., Koester D., Napiwotzki R., Reid I. N., Zuckerman B., 2005, @doi [ ] 10.1051/0004-6361:20053340 , http://adsabs.harvard.edu/abs/2005A
-
[6]
Bollimpalli D. A., Hameury J.-M., Lasota J.-P., 2018, @doi [ ] 10.1093/mnras/sty2555 , http://adsabs.harvard.edu/abs/2018MNRAS.481.5422B 481, 5422
-
[7]
Cordova F. A., Mason K. O., Nelson J. E., 1981, @doi [ ] 10.1086/158836 , https://ui.adsabs.harvard.edu/abs/1981ApJ...245..609C 245, 609
doi:10.1086/158836 1981
-
[8]
Dickey J. M., Lockman F. J., 1990, @doi [ ] 10.1146/annurev.aa.28.090190.001243 , http://adsabs.harvard.edu/abs/1990ARA
arXiv 1990
Show all 32 references
-
[9]
C., Joyce R
Fekel F. C., Joyce R. R., Hinkle K. H., Skrutskie M. F., 2000, @doi [ ] 10.1086/301260 , http://adsabs.harvard.edu/abs/2000AJ....119.1375F 119, 1375
2000 doi
-
[10]
V., Feigelson E
Getman K. V., Feigelson E. D., Grosso N., McCaughrean M. J., Micela G., Broos P., Garmire G., Townsley L., 2005, @doi [ ] 10.1086/432097 , http://adsabs.harvard.edu/abs/2005ApJS..160..353G 160, 353
2005 doi
-
[11]
Gorenstein P., 1975, @doi [ ] 10.1086/153579 , http://adsabs.harvard.edu/abs/1975ApJ...198...95G 198, 95
1975 doi
-
[12]
I kiewicz K., Miko ajewska J., Stoyanov K., Manousakis A., Miszalski B., 2016, @doi [ ] 10.1093/mnras/stw1837 , http://adsabs.harvard.edu/abs/2016MNRAS.462.2695I 462, 2695
2016 doi
-
[13]
Kalberla P. M. W., Burton W. B., Hartmann D., Arnal E. M., Bajaja E., Morras R., P \"o ppel W. G. L., 2005, @doi [ ] 10.1051/0004-6361:20041864 , http://adsabs.harvard.edu/abs/2005A
2005 doi
-
[14]
A., Napiwotzki R., Heber U., Dreizler S., Koester D., Reid I
Karl C. A., Napiwotzki R., Heber U., Dreizler S., Koester D., Reid I. N., 2005, @doi [ ] 10.1051/0004-6361:20041437 , http://adsabs.harvard.edu/abs/2005A
2005 doi
-
[15]
A., Mukai K., Sokoloski J
Kennea J. A., Mukai K., Sokoloski J. L., Luna G. J. M., Tueller J., Markwardt C. B., Burrows D. N., 2009, @doi [ ] 10.1088/0004-637X/701/2/1992 , http://adsabs.harvard.edu/abs/2009ApJ...701.1992K 701, 1992
2009 doi
-
[16]
R., 1976, @doi [ ] 10.1007/BF00648343 , http://adsabs.harvard.edu/abs/1976Ap
Lomb N. R., 1976, @doi [ ] 10.1007/BF00648343 , http://adsabs.harvard.edu/abs/1976Ap
1976 doi
-
[17]
Luna G. J. M., Sokoloski J. L., Mukai K., 2008, in Evans A., Bode M. F., O'Brien T. J., Darnley M. J., eds, Astronomical Society of the Pacific Conference Series Vol. 401, RS Ophiuchi (2006) and the Recurrent Nova Phenomenon. p. 342
2006
-
[18]
Luna G. J. M., Sokoloski J. L., Mukai K., Nelson T., 2013, @doi [ ] 10.1051/0004-6361/201220792 , http://adsabs.harvard.edu/abs/2013A
2013 doi
-
[19]
Luna G. J. M., et al., 2018, @doi [ ] 10.1051/0004-6361/201833747 , http://adsabs.harvard.edu/abs/2018A
2018 doi
-
[20]
Luna G. J. M., Nelson T., Mukai K., Sokoloski J. L., 2019, arXiv e-prints, https://ui.adsabs.harvard.edu/abs/2019arXiv190604770L p. arXiv:1906.04770
2019 arXiv
-
[21]
Munari U., Dallaporta S., Cherini G., 2016, @doi [ ] 10.1016/j.newast.2016.01.002 , http://adsabs.harvard.edu/abs/2016NewA...47....7M 47, 7
2016 doi
-
[22]
M., 1999, @doi [ ] 10.1051/aas:1999105 , https://ui.adsabs.harvard.edu/abs/1999A&AS..137..473M 137, 473
M \"u rset U., Schmid H. M., 1999, @doi [ ] 10.1051/aas:1999105 , https://ui.adsabs.harvard.edu/abs/1999A&AS..137..473M 137, 473
1999 doi
-
[23]
Nelson T., Mukai K., Orio M., Luna G. J. M., Sokoloski J. L., 2011, @doi [ ] 10.1088/0004-637X/737/1/7 , http://adsabs.harvard.edu/abs/2011ApJ...737....7N 737, 7
2011 doi
-
[24]
V., Zharikov S., Tovmassian G., Shearer A., 2005, @doi [ ] 10.1111/j.1365-2966.2005.09423.x , https://ui.adsabs.harvard.edu/abs/2005MNRAS.362.1472N 362, 1472
Neustroev V. V., Zharikov S., Tovmassian G., Shearer A., 2005, @doi [ ] 10.1111/j.1365-2966.2005.09423.x , https://ui.adsabs.harvard.edu/abs/2005MNRAS.362.1472N 362, 1472
2005
-
[25]
H., Teukolsky S
Press W. H., Teukolsky S. A., Vetterling W. T., Flannery B. P., 1992, Numerical recipes in FORTRAN. The art of scientific computing . Cambridge: University Press, |c1992, 2nd ed
1992
-
[26]
D., 1982, @doi [ ] 10.1086/160554 , http://adsabs.harvard.edu/abs/1982ApJ...263..835S 263, 835
Scargle J. D., 1982, @doi [ ] 10.1086/160554 , http://adsabs.harvard.edu/abs/1982ApJ...263..835S 263, 835
1982 doi
-
[27]
R., Krogulec M., Taylor A
Seaquist E. R., Krogulec M., Taylor A. R., 1993, @doi [ ] 10.1086/172742 , https://ui.adsabs.harvard.edu/abs/1993ApJ...410..260S 410, 260
1993 doi
-
[28]
Stanishev V., Zamanov R., Tomov N., Marziani P., 2004, @doi [ ] 10.1051/0004-6361:20034623 , https://ui.adsabs.harvard.edu/abs/2004A&A...415..609S 415, 609
2004 doi
-
[29]
H., Montmerle T., Grosso N., Feigelson E
Vuong M. H., Montmerle T., Grosso N., Feigelson E. D., Verstraete L., Ozawa H., 2003, @doi [ ] 10.1051/0004-6361:20030942 , http://adsabs.harvard.edu/abs/2003A
2003 doi
-
[30]
J., Kallman T
Wheatley P. J., Kallman T. R., 2006, @doi [ ] 10.1111/j.1365-2966.2006.10959.x , http://adsabs.harvard.edu/abs/2006MNRAS.372.1602W 372, 1602
2006
-
[31]
F., O'Brien T
Wynn G., 2008, in Evans A., Bode M. F., O'Brien T. J., Darnley M. J., eds, Astronomical Society of the Pacific Conference Series Vol. 401, RS Ophiuchi (2006) and the Recurrent Nova Phenomenon. p. 73
2006
-
[32]
M., Kovetz A., 2005, @doi [ ] 10.1086/428435 , https://ui.adsabs.harvard.edu/abs/2005ApJ...623..398Y 623, 398
Yaron O., Prialnik D., Shara M. M., Kovetz A., 2005, @doi [ ] 10.1086/428435 , https://ui.adsabs.harvard.edu/abs/2005ApJ...623..398Y 623, 398
2005 doi
Reviewed August 14, 2026 · model on record in the stance chip above.
Discussion (0). Continue with ORCID to comment.