REVIEW 3 major objections 6 minor 37 references
Modeling Time Dependent Water Chemistry Due to Powerful X-ray Flares from T-Tauri Stars
T0 review · 3 major / 6 minor · reviewed 2026-08-14 · deepseek-v4-flash
Pith's one-line read Rare, powerful X-ray flares from a young T Tauri star can temporarily raise gas-phase water near the disk surface by factors of 3–5 or more, with a smaller but potentially observable change in water column density.
desk verdict Useful time-dependent water chemistry model with a likely robust qualitative prediction; the 'detectable bursts' claim needs line modeling before it is trusted. read the letter →
The pith
A machine-rendered reading of the paper's core claim, the machinery that carries it, and where it could break.
The reading
What carries the argument
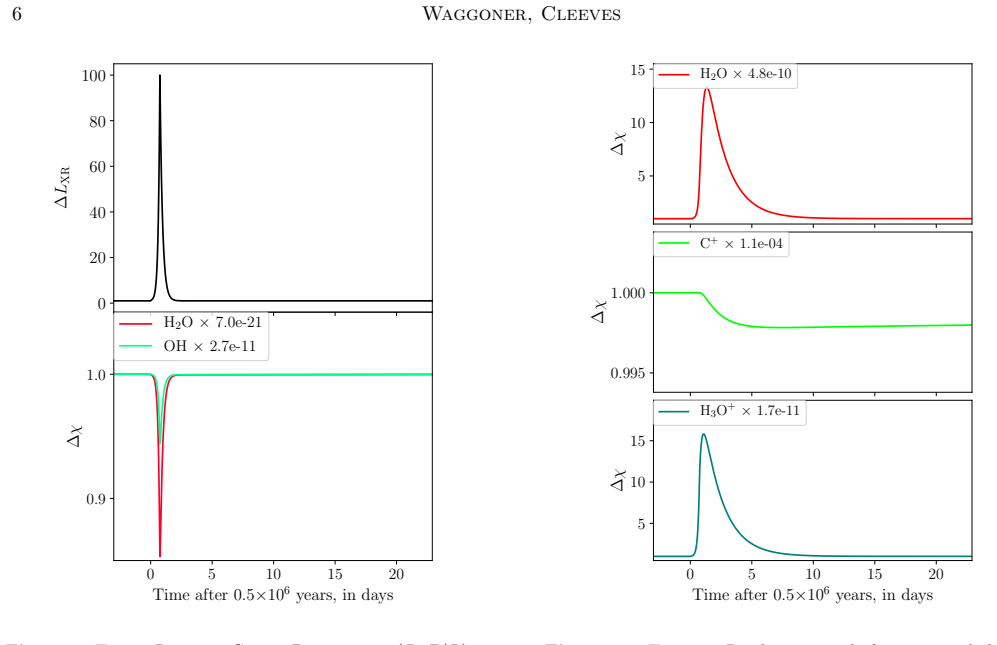
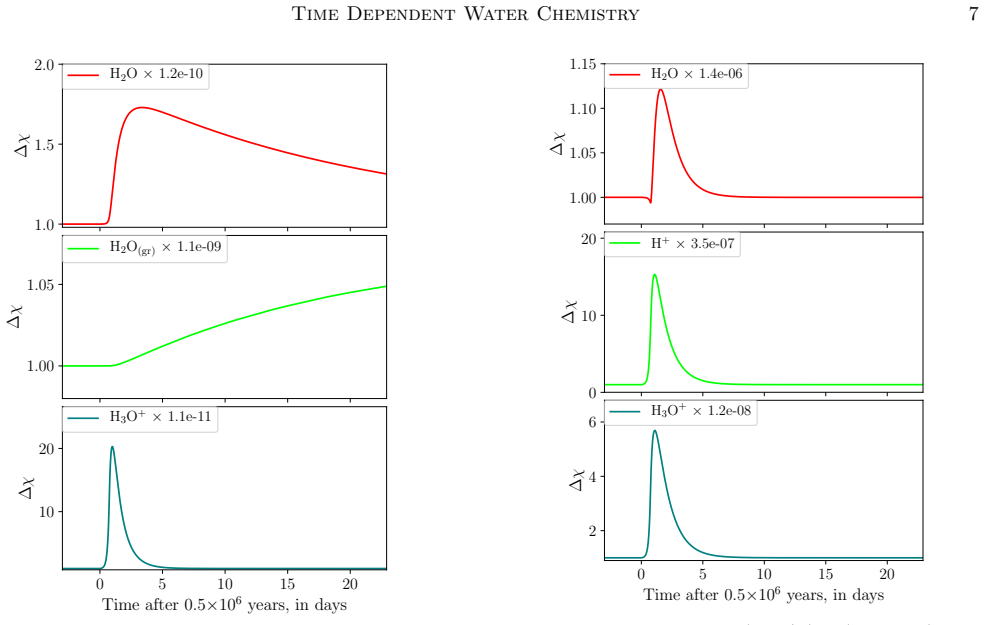
The carrying mechanism is a time-dependent gas-grain chemical network—647 species and 5,944 reactions—run at 35 independent points in a model protoplanetary disk after first reaching a pseudo-steady state, then followed through a synthetic flare. The paper identifies the load-bearing chemical channels by ranking reaction rates at representative times before, during, and after the flare: water is produced mainly by dissociative recombination of $\mathrm{H_3O^+}$ ($\mathrm{H_3O^+} + e^- \rightarrow \mathrm{H_2O} + \mathrm{H}$), and removed by ultraviolet photolysis of $\mathrm{H_2O}$, adsorption of $\mathrm{H_2O}$ onto grains, and ion-neutral reactions with $\mathrm{C^+}$. These channels, together with water adsorption and desorption, determine which of five response curve shapes appears at each disk location.
What would settle it
Observe a known T Tauri disk in the far-infrared water lines at 557 GHz or 1113 GHz, catch a flare with a peak X-ray ionization rate near 100 times baseline, and measure the 5–30 au region before, during, and about 1–3 days after peak; failing to see roughly a factor-of-two rise in water column density would contradict the prediction.
Extended reading notes
Core claim
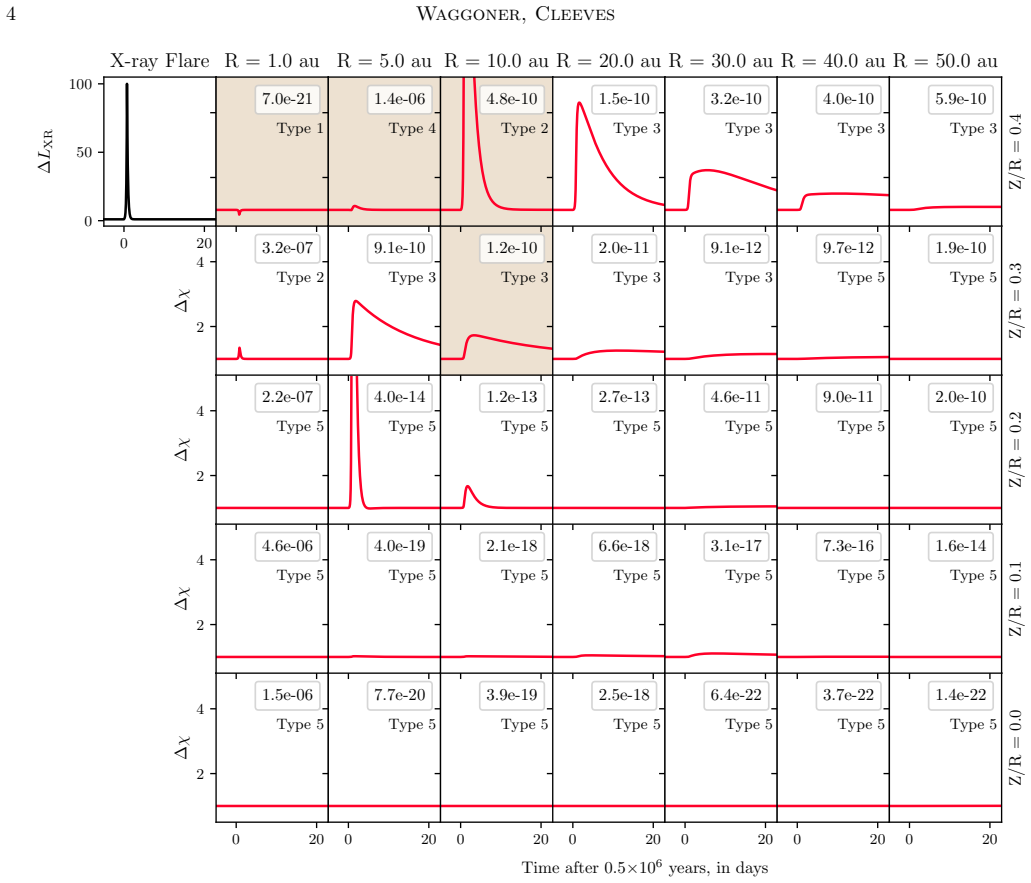
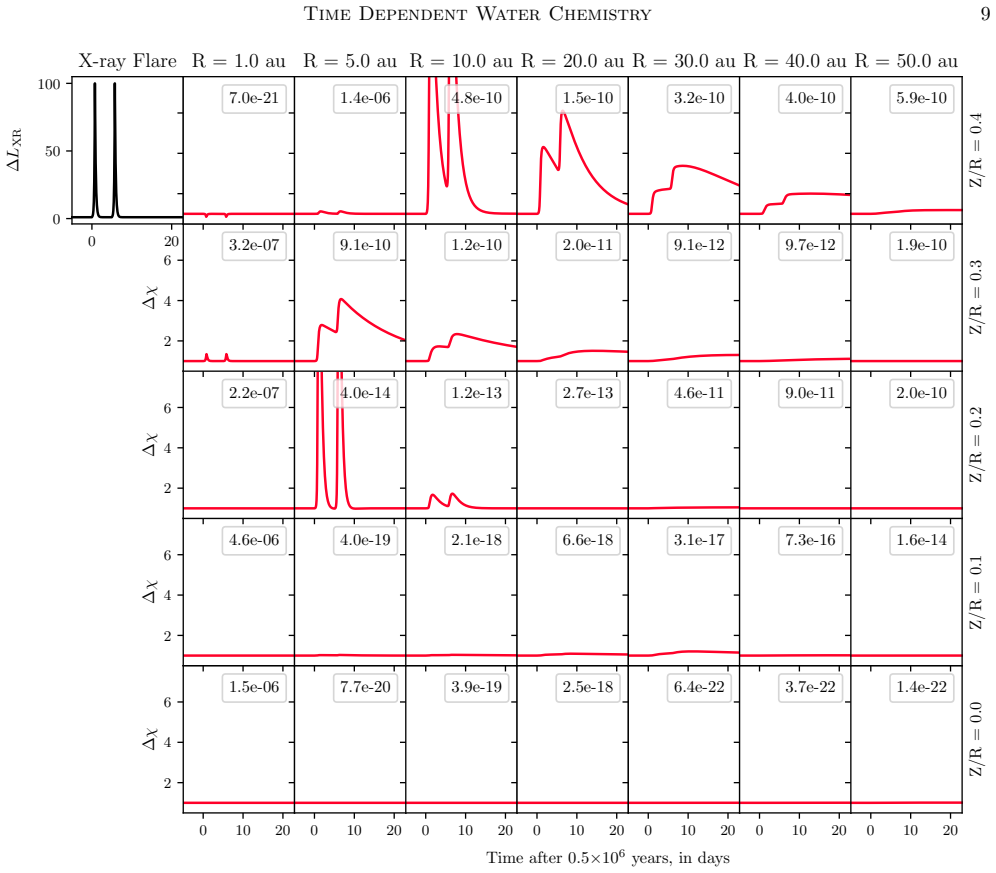
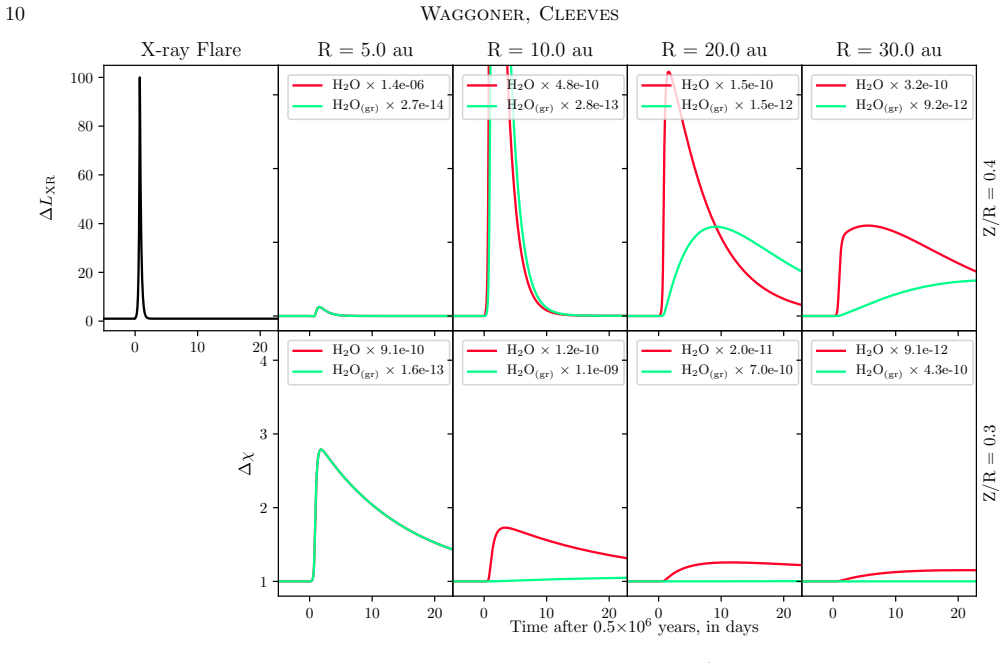
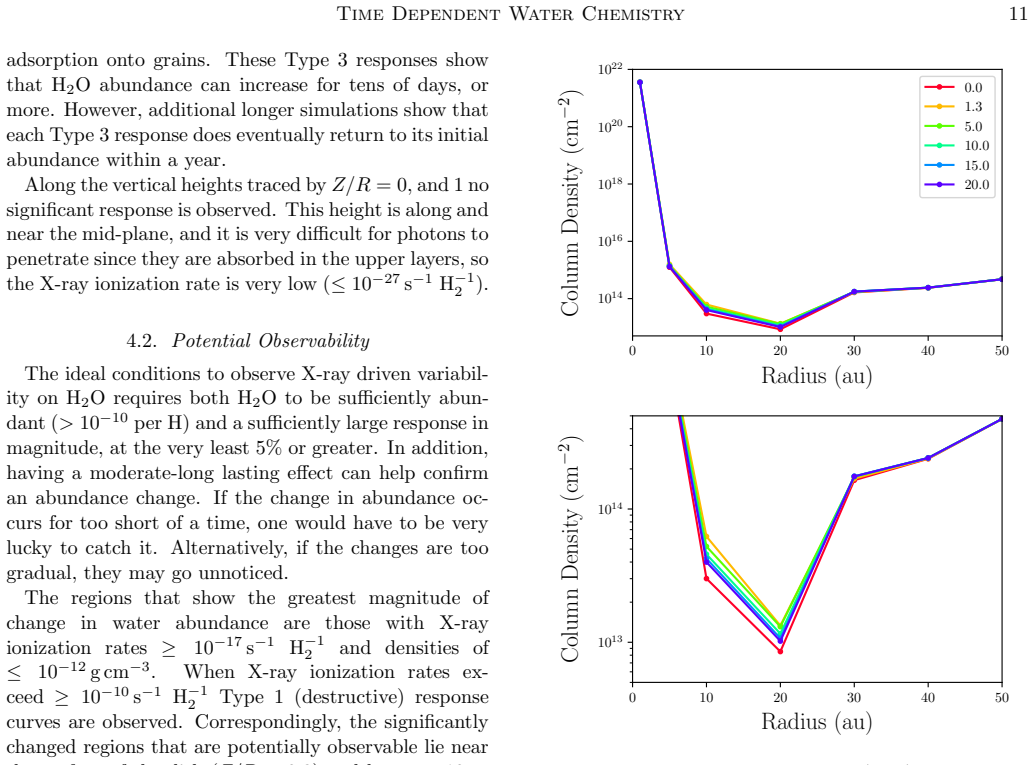
The central claim is that a strong X-ray flare—one whose unattenuated ionization rate reaches 100 times the baseline, an event expected every few years—can temporarily increase the gas-phase water abundance relative to hydrogen by factors of more than about 3–5 along the disk surface at $Z/R \ge 0.3$, out to tens of au. The effect is short-lived, with most locations returning to pre-flare water levels within days, though some surface points retain enhanced water for more than ten days. When integrated vertically, the flare changes the gas-phase water column density by just over a factor of two between 5 and 30 au, which the paper argues is the most promising observable signature in far-infrared ground-state water lines. Typical flares, a factor of a few above baseline every few weeks, do not produce significant observable changes. The chemistry is dominated by dissociative recombination of $\mathrm{H_3O^+}$ producing water, balanced by X-ray-induced ultraviolet photolysis, adsorption of water onto grains, and reactions with $\mathrm{C^+}$ destroying it.
Load-bearing premise
The load-bearing premise is that the 35 modeled disk locations evolve independently; if gas mixing moves water between layers on the relevant day-to-week timescales, the predicted localized bursts would be diluted and could become unobservable.
Editorial extensions
If this is right
- A 100-fold flare should appear as a days-long water burst in the 5–30 au region, with the vertical gas-phase water column density changing by just over a factor of two.
- Common flares of only a few times the baseline ionization rate predict no significant observable water variability, so detections should be tied to rare super-flares.
- Because gas-phase water returns to pre-flare levels within days at most locations, any observation made during a major flare would sample a temporarily enhanced water abundance rather than the disk's typical state.
- Since the excess water is split between gas and ice with little net long-term change, flare chemistry alters short-term gas abundance more than the disk's total water reservoir.
- Multiple flares in quick succession produce stacked responses rather than new curve shapes, so the timing between flares matters but the qualitative chemistry does not change.
Reading between the lines
- If the bursts are real, far-infrared water-line monitoring could double as a flare detector for disks, since the same ionization spike should also move other ionization-sensitive molecules such as $\mathrm{HCO^+}$.
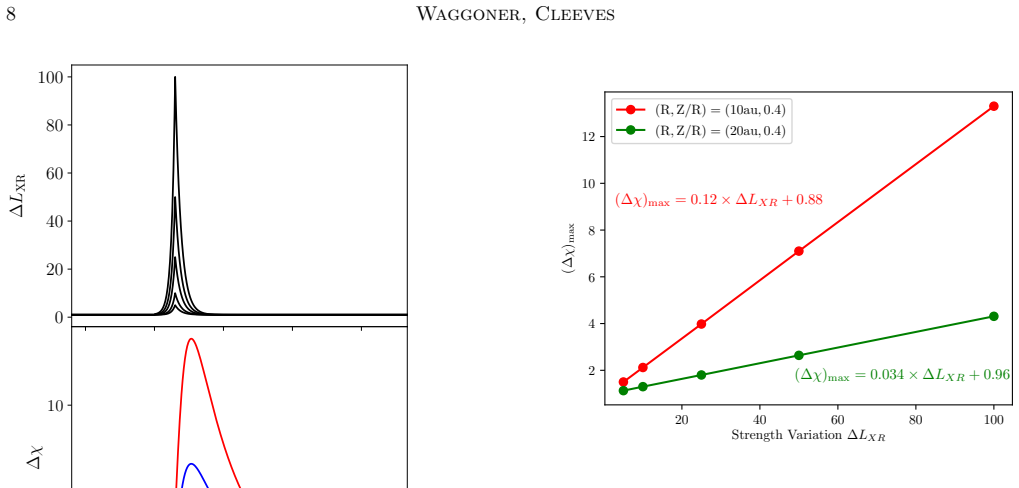
- The roughly linear scaling between flare strength and peak water response suggests an observational calibration strategy: measure water during flares of known X-ray strength and then use water as a proxy for flare history.
- Disks with lower gas mass or gaps let X-rays penetrate deeper, so the same flare may boost water closer to the midplane and produce a larger column-density signal than in the disk modeled here; this is an untested extrapolation.
- Repeated rare super-flares across the disk lifetime could cumulatively add modest amounts of water ice in the 5–30 au zone, potentially shifting where water freezes out; the paper leaves this question to future work.
Signed reviews
Editorial analysis
A structured set of objections, weighed in public.
Referee Report
Summary. The paper models the time-dependent gas-phase water chemistry of the IM Lup protoplanetary disk during X-ray flares, using the Fogel/Cleeves chemical network with 647 species and 5944 reactions at 35 independent point locations between 1 and 50 au. For a fiducial flare that increases the unattenuated X-ray ionization rate by a factor of 100, with a 3-hour rise and 5-hour decay, the authors find temporary H2O abundance enhancements of up to roughly a factor of 13 at surface layers with Z/R greater than about 0.3, peaking at 1-2 days and decaying over days to weeks. They attribute the production to dissociative recombination of H3O+ and the main losses to photolysis, adsorption onto grains, and reactions with C+. They conclude that strong, rare flares may produce time-varying water column-density enhancements of about a factor of 2 between 5 and 30 au that could be observed in future far-infrared 557/1113 GHz observations, while weaker, more frequent flares will not lead to significant observable changes.
Significance. If the central chemistry result holds, the paper provides a concrete mechanism linking stellar X-ray flaring to time-variable water emission in protoplanetary disks, and it makes a falsifiable prediction about the magnitude and duration of H2O column-density changes. The model is clearly specified: Table 2 lists the relevant H2O production and destruction processes, Table 3 provides the physical conditions at all 35 modeled grid points, and the authors categorize the time-dependent responses into five distinct curve types. The paper is also explicit about the main limitations of the model, including the independent-point treatment of the disk and the absence of horizontal transport. These strengths make the chemical part of the work reproducible and useful, while the observational claim requires additional steps beyond the column-density calculation.
major comments (3)
- [Section 4.2 and Figure 10] The claim that the factor-of-about-2 changes in N(H2O) 'may be detectable' as 557/1113 GHz water bursts is not established, because the paper computes only abundances and vertical column densities. At the burst locations (e.g., R=10 au, Z/R=0.4, rho=2.86e-16 g cm^-3, n_H2 approximately 6e7 cm^-3), water rotational lines can be subthermally excited and can become optically thick, so line flux is not generally proportional to column density. No non-LTE excitation calculation, line transfer, or instrument sensitivity estimate is presented, so the observability claim in the abstract and Section 4.2 is unsupported even if the chemistry is otherwise correct.
- [Section 2.1 and Section 4.2] The model treats the 35 point locations independently and does not include vertical or radial mixing, as stated in Section 2.1. The predicted H2O bursts have day-to-week timescales (Section 3.2), and if transport mixes the flare-produced water on comparable timescales, the localized column-density peaks in Figure 10 would be diluted and could fall below detectability. The manuscript does not estimate mixing timescales or justify neglecting this process for the observability claim, so the central observational prediction is not robust against a plausible and unmodeled physical effect.
- [Sections 3.3 and 5] The conclusion that 'typical' flares, i.e., increases by factors of a few, will not significantly impact H2O is in tension with the paper's own linear fit at (10 au, 0.4), namely (Delta chi)_max = 0.12 Delta L_XR + 0.88 (Figure 7). For a factor-of-5 flare this gives Delta chi_max approximately 1.48, corresponding to a 48% abundance increase, which exceeds the 5% observability threshold quoted in Section 4.2. Because no column-density or line-flux calculation is presented for weak flares, the summary statement in Section 5 that common flares 'do not significantly impact H2O in the disk' is not supported by the reported results and should be reconciled with the strength-variation fits.
minor comments (6)
- [Section 2.2, equation (1)] The definition 'Delta chi = Delta chi_with flare / Delta chi_without flare' is dimensionally ill-defined; presumably the intended quantity is the ratio of the water abundance with the flare to that without the flare. Please correct the notation so the plotted quantity is unambiguous.
- [Abstract] The sentence 'can temporarily increase the gas-phase H2O abundance relative to H can by more than a factor of about 3-5' is missing a word; it should read something like 'relative to H can change by more than a factor of about 3-5.'
- [Section 3.1] The text says 'Table 2 lists the key reactions and processes at the twenty points of the disk considered here,' but Table 2 lists reactions and the model considers 35 points; please correct the number.
- [Section 4.1] The parenthetical '(R, Z/R) = (1.0 au, 3)' should read Z/R = 0.3; the missing decimal point is confusing given the otherwise normalized heights.
- [Table 3] The entry '1.48E x 10^7' for the UV flux contains a typographical artifact ('E x'), and the X-ray ionization rate column header 's-1 H-1 2' should be typeset as s^-1 (H2)^-1.
- [Section 3.2.2] The text states that H2O increases by 'about 1340%' at (10 au, 0.4), while Delta chi = 13.4 corresponds to a 1240% increase relative to the pre-flare abundance; please make the percentage and the plotted ratio consistent.
Circularity Check
No material circularity: the water-abundance response is emergent from a pre-existing chemical network and disk model, and no water observation is used to tune the prediction.
full rationale
The central claim — that a 100x X-ray flare can transiently raise surface gas-phase H2O by factors of ~3–5 (Z/R ≥ 0.3) and produce factor-of-~2 column-density changes between 5 and 30 au — is obtained by time-integrating a published 647-species, 5944-reaction network (Fogel et al. 2011; Cleeves et al. 2014) at 35 disk points whose physical conditions are taken from the Cleeves et al. (2016) IM Lup disk model. The initial abundances (Table 1) come from interstellar cloud modeling, and the flare amplitude and timescales are set before the calculation as "typical of observed X-ray flares," cited to Preibisch & Feigelson (2005). Nothing in the water prediction is fitted to H2O observations; the self-citations supply the chemical network, disk structure, and motivation, but none of them encodes the predicted H2O response. The paper's explicit caveat that points are treated independently and horizontal mixing is ignored is a modeling limitation, not a circular reduction, and the lack of line excitation or radiative-transfer calculations weakens the observability claim as a correctness matter, not a circularity matter. Accordingly, no load-bearing step reduces to its own input by construction.
Assumptions & free parameters
free parameters (3)
- Peak flare strength factor (ΔL_XR) =
100 (fiducial); also 5, 10, 25, 50 explored
- Flare rise time and exponential decay time =
3 hr rise, 5 hr decay
- Typical flare frequency and strength =
factor of a few increase every few weeks
assumptions (5)
- domain assumption The Fogel et al. (2011) and Cleeves et al. (2014) chemical network (647 species, 5944 reactions) is complete and its rate coefficients are accurate.
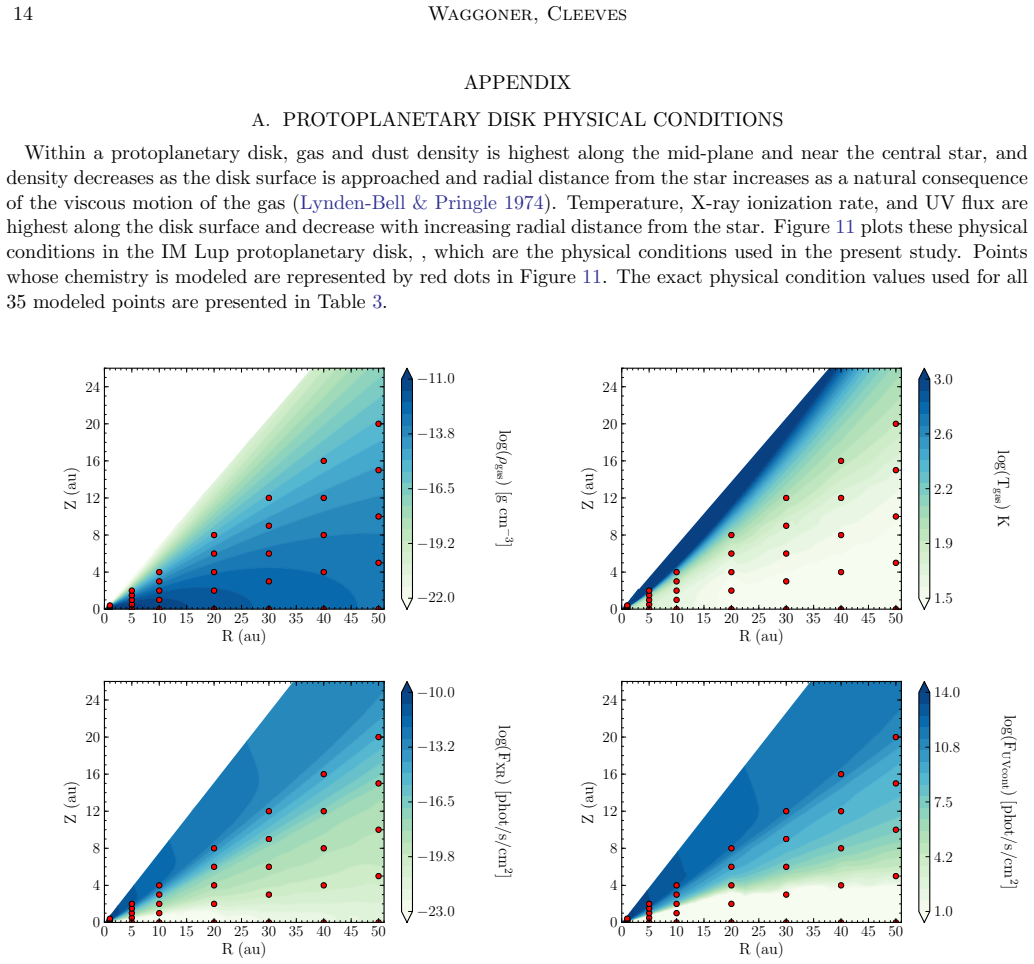
- domain assumption The IM Lup disk physical structure from Cleeves et al. (2016) is representative of protoplanetary disks.
- ad hoc to paper A flare is modeled purely as a multiplicative increase of the X-ray ionization rate, with no change in X-ray spectrum or attenuation depth.
- domain assumption Each of the 35 modeled points evolves independently with no mixing or transport between zones.
- domain assumption Initial chemical abundances (Table 1) from cloud models represent the disk starting conditions.
Cite this review
Pith. "Pith review of Modeling Time Dependent Water Chemistry Due to Powerful X-ray Flares from T-Tauri Stars." pith.science (2026). https://pith.science/paper/2TCADVLR
@misc{pith2026190808048,
  author       = {Pith},
  title        = {Pith review of: Modeling Time Dependent Water Chemistry Due to Powerful X-ray Flares from T-Tauri Stars},
  year         = {2026},
  howpublished = {\url{https://pith.science/paper/2TCADVLR}},
  note         = {Machine review of arXiv:1908.08048}
}
abstract
Young stars emit strong flares of X-ray radiation that penetrate the surface layers of their associated protoplanetary disks. It is still an open question as to whether flares create significant changes in disk chemical composition. We present models of the time-evolving chemistry of gas-phase water during X-ray flaring events. The chemistry is modeled at point locations in the disk between 1 and 50 au at vertical heights ranging from the mid-plane to the surface. We find that strong, rare flares, i.e., those that increase the unattenuated X-ray ionization rate by a factor of 100 every few years, can temporarily increase the gas-phase water abundance relative to H can by more than a factor of $\sim3-5$ along the disk surface (Z/R $\ge$ 0.3). We report that a "typical" flare, i.e., those that increase the unattenuated X-ray ionization rate by a factor of a few every few weeks, will not lead to significant, observable changes. Dissociative recombination of H$_3$O$^+$, water adsorption and desorption onto dust grains, and ultraviolet photolysis of water and related species are found to be the three dominant processes regulating the gas-phase water abundance. While the changes are found to be significant, we find that the effect on gas phase water abundances throughout the disk is short-lived (days). Even though we do not see a substantial increase in long term water (gas and ice) production, the flares' large effects may be detectable as time varying inner disk water 'bursts' at radii between 5 and 30 au with future far infrared observations.
Figures
Figures from the paper (5 more)
Reference graph
Works this paper leans on
-
[1]
2003, PASJ, 55, 11, doi: 10.1093/pasj/55.1.11
Aikawa, Y., Momose, M., Thi, W.-F., et al. 2003, PASJ, 55, 11, doi: 10.1093/pasj/55.1.11
-
[2]
Aikawa, Y., Umebayashi, T., Nakano, T., & Miyama, S. M. 1999, ApJ, 519, 705, doi: 10.1086/307400
-
[3]
2002, A&A, 386, 622, doi: 10.1051/0004-6361:20020037
Herbst, E. 2002, A&A, 386, 622, doi: 10.1051/0004-6361:20020037
-
[4]
Johns-Krull, C. M. 2002, ApJ, 567, 1013, doi: 10.1086/338586
-
[5]
Avenhaus, H., Quanz, S. P., Garufi, A., et al. 2018, ApJ, 863, 44, doi: 10.3847/1538-4357/aab846
-
[6]
Bergin, E. A., Aikawa, Y., Blake, G. A., & van Dishoeck, E. F. 2007, Protostars and Planets V, 751
work page 2007
-
[7]
Bethell, T. J., & Bergin, E. A. 2011, ApJ, 739, 78, doi: 10.1088/0004-637X/739/2/78 Time Dependent W ater Chemistry 13
-
[8]
Cleeves, L. I., Adams, F. C., & Bergin, E. A. 2013, ApJ, 772, 5, doi: 10.1088/0004-637X/772/1/5
Show all 37 references
-
[9]
I., Bergin, E
Cleeves, L. I., Bergin, E. A., Alexander, C. M. O. ., et al. 2014, Science, 345, 1590, doi: 10.1126/science.1258055
2014 doi
-
[10]
I., Bergin, E
Cleeves, L. I., Bergin, E. A., ¨Oberg, K. I., et al. 2017, ArXiv e-prints. https://arxiv.org/abs/1706.00833
2017 arXiv
-
[11]
I., ¨Oberg, K
Cleeves, L. I., ¨Oberg, K. I., Wilner, D. J., et al. 2016, ApJ, 832, 110, doi: 10.3847/0004-637X/832/2/110
2016 doi
-
[12]
1997, A&A, 317, L55
Dutrey, A., Guilloteau, S., & Guelin, M. 1997, A&A, 317, L55
1997
-
[13]
2007, A&A, 464, 615, doi: 10.1051/0004-6361:20065385
Dutrey, A., Henning, T., Guilloteau, S., et al. 2007, A&A, 464, 615, doi: 10.1051/0004-6361:20065385
2007 doi
-
[14]
Jayawardhana, R., & Oliveira, J. M. 2010, A&A, 510, A72, doi: 10.1051/0004-6361/200912810
2010 doi
-
[15]
2011, ApJ, 726, 29, doi: 10.1088/0004-637X/726/1/29
Semenov, D. 2011, ApJ, 726, 29, doi: 10.1088/0004-637X/726/1/29
2011 doi
-
[16]
Garmire, G. P. 2008, ApJ, 688, 418, doi: 10.1086/592033
2008 doi
-
[17]
E., Feigelson, E
Glassgold, A. E., Feigelson, E. D., Montmerle, T., & Wolk, S. 2005, in Astronomical Society of the Pacific Conference
2005
-
[18]
E., Najita, J., & Igea, J
Glassgold, A. E., Najita, J., & Igea, J. 1997, ApJ, 480, 344, doi: 10.1086/303952
1997 doi
-
[19]
1998, ApJ, 492, 323, doi: 10.1086/305032
Gullbring, E., Hartmann, L., Brice˜ no, C., & Calvet, N. 1998, ApJ, 492, 323, doi: 10.1086/305032
1998 doi
-
[20]
E., Lada, E
Haisch, Jr., K. E., Lada, E. A., & Lada, C. J. 2001, ApJL, 553, L153, doi: 10.1086/320685
2001 doi
-
[21]
I., Herbst, E., & Leung, C
Hasegawa, T. I., Herbst, E., & Leung, C. M. 1992, ApJS, 82, 167, doi: 10.1086/191713
1992 doi
-
[22]
Johns-Krull, C. M. 2004, ApJ, 607, 369, doi: 10.1086/383340
2004 doi
-
[23]
M., P´ erez, L
Huang, J., Andrews, S. M., P´ erez, L. M., et al. 2018, ApJL, 869, L43, doi: 10.3847/2041-8213/aaf7a0
2018 doi
-
[24]
Ilgner, M., & Nelson, R. P. 2006, A&A, 455, 731, doi: 10.1051/0004-6361:20065308
2006 doi
-
[25]
Lynden-Bell, D., & Pringle, J. E. 1974, MNRAS, 168, 603
1974
-
[26]
2019, MNRAS, 486, 1094, doi: 10.1093/mnras/stz902
Mackey, J., Walch, S., Seifried, D., et al. 2019, MNRAS, 486, 1094, doi: 10.1093/mnras/stz902
2019 doi
-
[27]
R., Hollenbach, D
Maloney, P. R., Hollenbach, D. J., & Tielens, A. G. G. M. 1996, ApJ, 466, 561, doi: 10.1086/177532
1996 doi
-
[28]
1996, in IAU Colloq
Montmerle, T., & Casanova, S. 1996, in IAU Colloq. 153: Magnetodynamic Phenomena in the Solar Atmosphere - Prototypes of Stellar Magnetic Activity, ed. Y. Uchida, T. Kosugi, & H. S. Hudson, 247 ¨Oberg, K. I., Guzm´ an, V. V., Furuya, K., et al. 2015, Nature, 520, 198, doi: 10....
1996 doi
-
[29]
L., M´ enard, F., et al
Pinte, C., Padgett, D. L., M´ enard, F., et al. 2008, A&A, 489, 633, doi: 10.1051/0004-6361:200810121
2008 doi
-
[30]
B., Hubickyj, O., Bodenheimer, P., et al
Pollack, J. B., Hubickyj, O., Bodenheimer, P., et al. 1996, Icarus, 124, 62, doi: 10.1006/icar.1996.0190
1996
-
[31]
Preibisch, T., & Feigelson, E. D. 2005, ApJS, 160, 390, doi: 10.1086/432094
2005 doi
-
[32]
Smith, I. W. M., Herbst, E., & Chang, Q. 2004, MNRAS, 350, 323, doi: 10.1111/j.1365-2966.2004.07656.x
2004
-
[33]
Skrutskie, M. F. 1989, AJ, 97, 1451, doi: 10.1086/115085
1989 doi
-
[34]
A., ¨Oberg, K
Walsh, C., Loomis, R. A., ¨Oberg, K. I., et al. 2016, ApJL, 823, L10, doi: 10.3847/2041-8205/823/1/L10
2016 doi
-
[35]
Cowin, J. P. 2005, ApJ, 620, 1027, doi: 10.1086/427072
2005 doi
-
[36]
P., & Cieza, L
Williams, J. P., & Cieza, L. A. 2011, ARA&A, 49, 67, doi: 10.1146/annurev-astro-081710-102548
2011 doi
-
[37]
J., Harnden, Jr., F
Wolk, S. J., Harnden, Jr., F. R., Flaccomio, E., et al. 2005, ApJS, 160, 423, doi: 10.1086/432099 14 W aggoner, Cleeves APPENDIX A. PROTOPLANETARY DISK PHYSICAL CONDITIONS Within a protoplanetary disk, gas and dust density is highest along the mid-plane and near the central st...
2005 doi
Reviewed August 14, 2026 · model on record in the stance chip above.
Discussion (0). Continue with ORCID to comment.