REVIEW 2 major objections 4 minor 182 references
Diversity in Biology: definitions, quantification, and models
T0 review · 2 major / 4 minor · reviewed 2026-08-14 · deepseek-v4-flash
Pith's one-line read This review shows that most diversity metrics are special cases of the Hill-number family and that sampling bias, not the choice of index, carries most of the practical error.
desk verdict Useful cross-disciplinary diversity review with one real sampling error in Eq. (37) that needs fixing before it can be trusted. read the letter →
The pith
A machine-rendered reading of the paper's core claim, the machinery that carries it, and where it could break.
The reading
What carries the argument
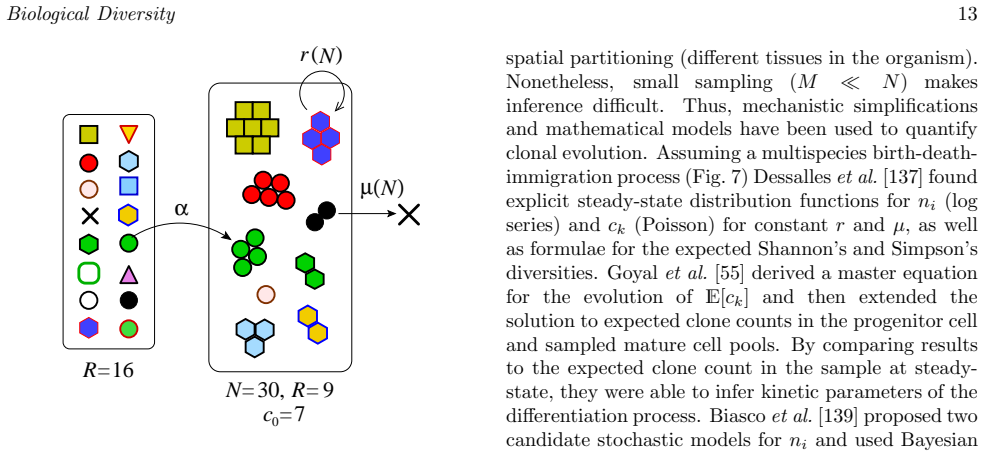
The load-bearing object is the Hill number $qD=(\sum_i f_i^q)^{1/(1-q)}$, a one-parameter family indexed by the order $q$: $q\to0^+$ gives richness, $q\to1$ gives the exponential of Shannon entropy, $q=2$ gives Simpson's diversity, and $q\to\infty$ gives the reciprocal of the Berger-Parker index. The paper pairs this with the clone-count representation $c_k=\sum_i \mathbf{1}(n_i,k)$, which counts how many types appear in exactly $k$ copies and lets diversity be computed without species identities. The sampling machinery consists of the two probability distributions $P_{1\times M}$ and $P_{M\times1}$ for drawing a sample, whose expectation values show which diversity indices are biased, plus Chao-type estimators that invert the sampling map and recover population diversity from a sample.
What would settle it
Take a community with known species abundances and clone counts (for example, a fully sequenced synthetic microbial community), sample it under a deliberately clustered protocol, and compare the observed average Simpson's index without replacement with the paper's prediction that the sample expectation equals the population value; a systematic deviation would show exactly where the perfectly random sampling assumption, rather than the diversity framework itself, has broken down.
Extended reading notes
Core claim
The central discovery is a unification and a warning. Nearly every widely used diversity measure—species richness, the Shannon index, evenness, Simpson's index, the Berger-Parker dominance measure—is a special case of the Hill numbers $qD=(\sum_i f_i^q)^{1/(1-q)}$, where $f_i$ is the relative abundance of type $i$ and $q$ tunes the sensitivity to rare versus common types. Under two standard random-sampling protocols (repeated draws with replacement, and one draw of a fraction of the population), the expected value of Simpson's diversity without replacement in the sample equals the population value, whereas richness and Shannon-based measures are systematically underestimated. The paper therefore warns that no single metric is universally appropriate: at different $q$, different aspects of the distribution are being measured, and the same data can support opposing conclusions. Its recommended practice is to match the index to the scientific question, correct for sampling with estimators such as Chao1 where the sampling model applies, and cross-check several indices.
Load-bearing premise
The load-bearing premise is that sampling is perfectly random and well-mixed, with every species or clone equally likely to be captured; under spatial clustering, PCR amplification bias, or non-uniform capture, the quantitative sample-to-population relations in Section 5 do not hold, and the paper acknowledges these limitations only qualitatively.
Editorial extensions
If this is right
- The order $q$ is a question-selection dial: $q=0$ counts types, $q=1$ weights by frequency, $q=2$ emphasizes dominant types, and two communities can be ranked oppositely at different $q$.
- Sample-based richness is always a lower bound and is the most sampling-sensitive common measure; Simpson's diversity at $q=2$ is far more stable, and its without-replacement form is unbiased under both sampling protocols the paper analyzes.
- Chao1/Chao2 and related estimators can correct sample-to-population diversity when sampling is perfectly random, but Chao1 is only a lower bound and is reliable only when the population is not much larger than the sample.
- Diversity values are resolution-dependent: changing how a continuous trait is binned changes both number counts and clone counts, so a reported diversity index is only meaningful together with the species or trait definition that produced it.
- Because different diversity indices can move in opposite directions in the same dataset, a single-index conclusion is fragile; the paper recommends cross-checking metrics.
Reading between the lines
- The paper does not push this, but its own ordering structure implies that reporting the whole profile $qD(q)$ over a range of $q$ is more informative than any single Hill number, and it would make index-choice debates less necessary.
- The same sampling-bias logic should apply to socioeconomic inequality measures such as the Gini or Theil index: any subsampling of income data will bias them in an order-dependent way, and Chao-style corrections could in principle be adapted there.
- The polarization index $P[f]\propto\iint f^{1+\alpha}(x)f(y)|x-y|\,dx\,dy$ looks like a two-parameter generalization of Hill numbers with a distance kernel; testing that connection could unify inequality and diversity measurement, but the paper does not make this claim.
- Resolution dependence suggests a practical convention: report diversity at multiple trait-bin widths, since any single bin width is arbitrary and the paper shows the numbers shift with resolution.
Signed reviews
Editorial analysis
A structured set of objections, weighed in public.
Referee Report
Summary. This topical review surveys quantitative measures of diversity for biological and sociological applications. It introduces information-theoretic concepts (entropy, KL divergence, mutual information, KS statistic), defines common diversity indices (richness, Shannon index, evenness, Simpson indices, Berger-Parker) and unifies them through Hill numbers of order q, and introduces a clone-count representation. The core technical section derives how expected sample diversity relates to population diversity under two sampling protocols: 1×M sampling with replacement (multinomial) and M×1 sampling without replacement (hypergeometric). The remainder reviews applications in ecology, the gut microbiome, stem-cell barcoding, T- and B-cell repertoires, and wealth distributions, and concludes that there is no single universal diversity metric, recommending cross-checking of multiple indices with attention to sampling effects.
Significance. If corrected, the review would be a useful synthesis for a physical-biology audience: it collects Hill-number theory, information-theoretic identities, clone-count representations, and sampling formulas in one place, and connects them to concrete applications in ecology, hematopoiesis, immunology, and economics. The Hill-number limit derivations in Eqs. (15)-(25) are clear, and the hypergeometric moment calculation leading to Eq. (39) is correct. The paper is also honest about the well-mixed random-sampling assumption and about the absence of a universally best metric. However, because the paper is a definitions-and-methods review, its value rests on technical accuracy, and the errors described below affect central definitions and one of the two sampling conclusions.
major comments (2)
- [Section 5, Eq. (37) and text after Eq. (39)] The claim that the expected sample Simpson index without replacement equals the population value under both sampling protocols is not correct for the 1×M protocol. Under multinomial sampling, E[m_i(m_i−1)] = M(M−1) f_i^2, so E_{1×M}[S] = Σ_i f_i^2 = Sr (Eq. (23)), not S (Eq. (24)). The sentence after Eq. (39) must therefore be restricted to the M×1 protocol, for which Eq. (39) is correct. The discrepancy is not negligible in the small-population regime the paper itself highlights: for N=2 with one individual of each of two species, S=0 while Sr=0.5. A reader using the 1×M result would systematically mis-estimate the population Simpson index. Please correct Eq. (37), the surrounding text, and any downstream statements implying that both sampling protocols preserve the without-replacement index.
- [Table 1 and Section 7] Table 1 labels the evenness row as "Evenness (1D)", and Section 7 refers to "richness (q=0) and evenness (q=1)" as measures more prone to sampling effects. This conflates evenness with the order-q=1 Hill number. Equation (21) defines Shannon equitability as JE = Sh/ln R, while Eq. (19) shows that 1D = exp(Sh) is the effective number of species (Shannon diversity). Evenness is a normalized quantity derived from a Hill number, not itself a Hill number of order 1. Please relabel the table row and correct the Section 7 sentence, since the paper's organizing message is that common indices are special cases of Hill numbers.
minor comments (4)
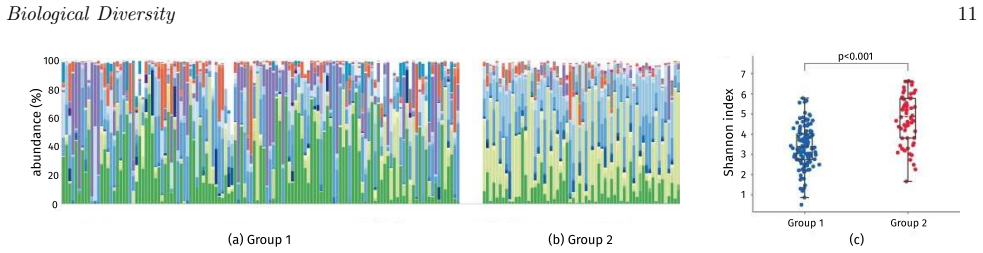
- [Section 6.2, Figure 3] The linear regression in Fig. 3 is presented without error bars, confidence intervals, or goodness-of-fit statistics; because the text cites z=0.29 as an illustration of the species-area exponent, please add at least R² or a standard error and state how the regression was performed.
- [Equation (21)] Shannon equitability JE = Sh/ln R is undefined for R=1 because ln R=0; a brief caveat or a limiting definition for the single-species case would avoid confusion.
- [Equation (33)] The indicator notation 1(M, Σ_i m_i) is used before the Fourier representation 1(x,y) is introduced; please define the discrete indicator function at first use in Eq. (33) to avoid ambiguity.
- [Section 6.6, Eq. (52)] The phrase "is the Legendre transform at f*" is imprecise for the Hoover index: H is the supremum of |f−W(f)|, and for convex Lorenz curves the maximizing point is characterized by dW/df=1. Please rephrase to avoid suggesting that H itself is a Legendre transform.
Circularity Check
No circularity: the review derives diversity indices and sampling relations from definitions and external results, not from fitted inputs or self-citation.
full rationale
This is a topical review whose load-bearing content (Hill numbers qD = (Σ f_i^q)^{1/(1-q)} unify richness, Shannon, Simpson; clone counts c_k satisfy N = Σ k c_k and R = Σ c_k; sampling moments follow from multinomial and hypergeometric combinatorics) is derived from explicit definitions and standard external results. The cited prior work by the authors (e.g., Goyal et al. 2015, Dessalles et al. 2018, Xu et al. 2018) is used only as application examples of BDI models and clone-count inference, not as justification for the diversity definitions, the Hill-number synthesis, or the concluding claim that there is no golden rule in choosing a unique metric. That conclusion rests on the stated examples of contradictory indices (Nagendra 2002) and on sampling sensitivity (Soetaert and Heip 1990). The paper also explicitly acknowledges the limitation that the P_{1×M} and P_{M×1} results require perfectly random sampling, so the assumption is stated rather than hidden. The sampling section contains a notational slip: Eq. (37) writes E_{1×M}[S] = Σ f_i^2 ≡ S, which conflicts with Eq. (24) where S = Σ n_i(n_i−1)/(N(N−1)); this is a mathematical inconsistency, not a circular reduction of a predicted quantity to a fitted input. No step in the derivation chain is equivalent by construction to its own input, and no load-bearing conclusion is imported from the authors' prior work. Hence the circularity score is 0.
Assumptions & free parameters
free parameters (1)
- Species-area power-law parameters (c, z) =
z = 0.29; c not reported
assumptions (4)
- domain assumption The point-density P0(x) in Eq. (4) exists and the limit in Eq. (5) is well-behaved.
- domain assumption Sampling is perfectly random and well-mixed for the reviewed applications.
- domain assumption Species/types are discrete and distinguishable after binning, so number counts n_i and clone counts c_k are well-defined.
- standard math Standard probability calculus and information-theoretic identities (Shannon entropy, KL divergence, Jensen-Shannon divergence).
Cite this review
Pith. "Pith review of Diversity in Biology: definitions, quantification, and models." pith.science (2026). https://pith.science/paper/3HGBOUDY
@misc{pith2026190808190,
  author       = {Pith},
  title        = {Pith review of: Diversity in Biology: definitions, quantification, and models},
  year         = {2026},
  howpublished = {\url{https://pith.science/paper/3HGBOUDY}},
  note         = {Machine review of arXiv:1908.08190}
}
read the original abstract
Diversity indices are useful single-number metrics for characterizing a complex distribution of a set of attributes across a population of interest. The utility of these different metrics or sets of metrics depend on the context and application, and whether a predictive mechanistic model exists. In this topical review, we first summarize the relevant mathematical principles underlying heterogeneity in a large population before outlining the various definitions of `diversity' and providing examples of scientific topics in which its quantification plays an important role. We then review how diversity has been a ubiquitous concept across multiple fields including ecology, immunology, cellular barcoding experiments, and socioeconomic studies. Since many of these applications involve sampling of populations, we also review how diversity in small samples is related to the diversity in the entire population. Features that arise in each of these applications are highlighted.
Figures


Figures from the paper (6 more)



Reference graph
Works this paper leans on
-
[1]
Nei M 1973 Proceedings of the National Academy of Sciences 70 3321–3323
1973
-
[2]
1995 Global biodiversity assessment vol 1140 (Cambridge University Press Cambridge)
Heywood V H, W atson R T et al. 1995 Global biodiversity assessment vol 1140 (Cambridge University Press Cambridge)
1995
-
[3]
Purvis A and Hector A 2000 Nature 405 212
2000
-
[4]
Whittaker R J, Willis K J and Field R 2001 Journal of Biogeography 28 453–470
2001
-
[5]
2000 Science 287 1770–1774
Sala O E, Chapin F S, Armesto J J, Berlow E, Bloomfield J, Dirzo R, Huber-Sanwald E, Huenneke L F, Jackson R B, Kinzig A et al. 2000 Science 287 1770–1774
2000
-
[6]
Fisher R A, Corbet A S and Williams C B 1943 The Journal of Animal Ecology 42–58
1943
-
[7]
Magurran A E 1988 Ecological diversity and its measure- ment (Princeton University Press)
1988
-
[8]
Benton M J 1995 Science 268 52–58
1995
Show all 182 references
-
[9]
Courtillot V and Gaudemer Y 1996 Nature 381 146
1996
-
[10]
Alroy J 2004 Evolutionary Ecology Research 6 1–32
2004
-
[11]
Stollmeier F, Geisel T and Nagler J 2014 Physical Review Letters 112 228101
2014
-
[12]
Blume M E, Crockett J and Friend I 1974 Survey of Current Business 54 16–40
1974
-
[13]
Blume M E and Friend I 1975 The Journal of Finance 30 585–603
1975
-
[14]
Rajan R, Servaes H and Zingales L 2000 The Journal of Finance 55 35–80
2000
-
[15]
Goetzmann W N and Kumar A 2008 Review of Finance 12 433–463
2008
-
[16]
Haldane A G and May R M 2011 Nature 469 351
2011
-
[17]
Greenberg J H 1956 Language 32 109–115
1956
-
[18]
Yule C U 2014 The statistical study of literary vocabulary (Cambridge University Press)
2014
-
[19]
Bailey K D 1990 Social entropy theory (SUNY Press, Albany, NY)
1990
-
[20]
Balch T 2000 Autonomous Robots 8 209–238
2000
-
[21]
Neckerman K M and Torche F 2007 Annu. Rev. Sociol. 33 335–357
2007
-
[22]
Ostrom E 2009 Understanding Institutional Diversity (Princeton University Press)
2009
-
[23]
M¨ as M, Flache A, Tak´ acs K and Jehn K A 2013 Organization Science 24 716–736
2013
-
[24]
Domina T, Penner A and Penner E 2017 Annual Review of Sociology 43 311–330
2017
-
[25]
Sepkoski J J 1988 Paleobiology 14 221–234
1988
-
[26]
Ricotta C 2005 Acta Biotheoretica 53 29–38
2005
-
[27]
Simpson E H 1949 Nature 163 688
1949
-
[28]
Hurlbert S H 1971 Ecology 52 577–586
1971
-
[29]
Sarkar S 2006 Acta Biotheoretica 54 133–140
2006
-
[30]
Series B: Biological Sciences 353 315–326
John Sepkoski Jr J 1998 Philosophical Transactions of the Royal Society of London. Series B: Biological Sciences 353 315–326
1998
-
[31]
Margules C R and Pressey R L 2000 Nature 405 243
2000
-
[32]
Herrnstein R J and Murray C 1994 The Bell Curve (Free Press)
1994
-
[33]
Lorenz M O 1905 Publications of the American Statistical Association 9 209–219
1905
-
[34]
Edgar Malone Hoover J 1936 Review of Economics and Statistics 18 162–171
1936
-
[35]
Esteban J M and Ray D 1994 Econometrica 62 819–851
1994
-
[36]
Duclos J Y, Esteban J and Ray D 2004 Econometrica 72 1737–1772
2004
-
[37]
Grubb M, Butler L and Twomey P 2006 Energy Policy 34 4050–4062
2006
-
[38]
Cover T M and Thomas J A 2012 Elements of information theory (John Wiley & Sons)
2012
-
[39]
Jaynes E T 1963 Information Theory and Statistical Mechanics Statistical Physics ed Ford K (Benjamin, New York) p 181 Biological Diversity 20
1963
-
[40]
Lazo A and Rathie P 1978 IEEE Transactions on Information Theory 24 120–122
1978
-
[41]
Spellerberg I F and Fedor P J 2003 Global Ecology and Biogeography 12 177–179
2003
-
[42]
Lin J 1991 IEEE Transactions on Information theory 37 145–151
1991
-
[43]
Hill M O 1973 Ecology 54 427–432
1973
-
[44]
Tuomisto H 2010 Oecologia 164 853–860
2010
-
[45]
Tuomisto H 2010 Ecography 33 2–22
2010
-
[46]
Jost L 2007 Ecology 88 2427–2439
2007
-
[47]
R´ enyi A et al. 1961 On measures of entropy and infor- mation Proceedings of the Fourth Berkeley Symposium on Mathematical Statistics and Probability, Volume 1: Contributions to the Theory of Statistics (The Regents of the University of California)
1961
-
[48]
Jost L 2006 Oikos 113 363–375
2006
-
[49]
Heip C 1974 Journal of the Marine Biological Association of the United Kingdom 54 555–557
1974
-
[50]
Sethian J A 1999 Level Set Methods and Fast Marching Methods: Evolving Interfaces in Computational Geom- etry, Fluid Mechanics, Computer Vision, and Materi- als Science (Cambridge University Press)
1999
-
[51]
Kittel C 1996 Introduction to Solid State Physics, 7 th Edition (Wiley)
1996
-
[52]
W attis J A D and King J R 1998 Journal of Physics A 31 7169
1998
-
[53]
D’Orsogna M R, Lakatos G and Chou T 2012 The Journal of Chemical Physics 136 084110
2012
-
[54]
D’Orsogna M R, Lei Q and Chou T 2015 Journal of Chemical Physics 139 014112
2015
-
[55]
Goyal S, Kim S, Chen I S Y and Chou T 2015 BMC Biology 13 85
2015
-
[56]
Villela D A M, Garcia G d A and Maciel-de Freitas R 2017 PLOS Neglected Tropical Diseases 11 1–20
2017
-
[57]
Epopa P S, Millogo A A, Collins C M, North A, Tripet F, Benedict M Q and Diabate A 2017 Parasites & vectors 10 376
2017
-
[58]
Cianci D, Broek J V D, Caputo B, Marini F, Torre A D, Heesterbeek H and Hartemink N 2013 Journal of Medical Entomology 50 533–542
2013
-
[59]
Gotelli N J and Chao A 2013 Measuring and estimating species richness, species diversity, and biotic similarit y from sampling data Encyclopedia of Biodiversity vol 5 (Academic Press) pp 195–211
2013
-
[60]
Chao A, Gotelli N J, Hsieh T, Sander E L, Ma K, Colwell R K and Ellison A M 2014 Ecological Monographs 84 45–67
2014
-
[61]
Fisher R A, Corbet A S and Williams C B 1943 The Journal of Animal Ecology 12 42–58
1943
-
[62]
Bunge J and Fitzpatrick M 1993 Journal of the American Statistical Association 88 364–373
1993
-
[63]
Hsieh T C and Chao A 2016 Systematic Biology 66 100– 111
2016
-
[64]
Cox K D, Black M J, Filip N, Miller M R, Mohns K, Mortimor J, Freitas T R, Greiter Loerzer R, Gerwing T G, Juanes F and Dudas S E 2017 Ecology and Evolution 7 11213–11226
2017
-
[65]
Budka A, Lacka A and Szoszkiewicz K 2019 Biodiversity and Conservation 28 385–400
2019
-
[66]
Chao A, W ang Y and Jost L 2013 Methods in Ecology and Evolution 4 1091–1100
2013
-
[67]
Efron B and Thisted R 1976 Biometrika 63 435–447
1976
-
[68]
Orlitsky A, Suresh A T and W u Y 2016 Proceedings of the National Academy of Sciences 113 13283–13288
2016
-
[69]
Willis A and Bunge J 2015 Biometrics 71 1042–1049
2015
-
[70]
Willis A 2016 Proceedings of the National Academy of Sciences 113 E5096–E5096
2016
-
[71]
Chao A 1984 Scandinavian Journal of Statistics 265–270
1984
-
[72]
Chao A 1987 Biometrics 783–791
1987
-
[73]
Shen T J, Chao A and Lin C F 2003 Ecology 84 798–804
2003
-
[74]
Hsieh T C, Ma K H and Chao A 2016 Methods in Ecology and Evolution 7 1451–1456
2016
-
[75]
Curtis T P, Sloan W T and Scannell J W 2002 Proceedings of the National Academy of Sciences 99 10494–10499
2002
-
[76]
Locey K J and Lennon J T 2016 Proceedings of the National Academy of Sciences 113 5970–5975
2016
-
[77]
Locey K J and Lennon J T 2016 Proceedings of the National Academy of Sciences 113 E5097–E5097
2016
-
[78]
Hutchinson G E 1961 The American Naturalist 95 137– 145
1961
-
[79]
Hardin G 1960 Science 131 1292–1297
1960
-
[80]
MacArthur R H 1965 Biological Reviews 40 510–533
1965
-
[81]
Whittaker R H 1960 Ecological Monographs 30 279–338
1960
-
[82]
Whittaker R H 1977 Evolutionary Biology 10 1–67
1977
-
[83]
Lande R 1996 Oikos 76 5–13
1996
-
[84]
Contoli L and Luiselli L 2015 Web Ecology 15 33–37
2015
-
[85]
Hui C and McGeoch M A 2014 American Naturalist 184 684–694
2014
-
[86]
Jaccard P 1900 Bull Soc Vaudoise Sci Nat 36 87–130
1900
-
[87]
Margalef D R 1957 Memorias de la Real Academica de ciencias y artes de Barcelona 32 374–559
1957
-
[88]
Menhinick E F 1964 Ecology 45 859–861
1964
-
[89]
Bray J and Curtis J 1957 An ordination of upland forest communities of southern Wisconsin.-ecological Monographs
1957
-
[90]
Berger W H and Parker F L 1970 Science 168 1345–1347
1970
-
[91]
Fager E W 1957 Ecology 38 586–595
1957
-
[92]
Keefe T J and Bergersen E P 1977 Water Research 11 689–691
1977
-
[93]
McIntosh R P 1967 Ecology 48 392–404
1967
-
[94]
Patil G and Taillie C 1982 Journal of the American Statistical Association 77 548–561
1982
-
[95]
Gleason H A 1922 Ecology 3 158–162
1922
-
[96]
MacArthur R and Wilson E O 1967 The Theory of Island Biogeography (Princeton University Press, Princeton, NJ)
1967
-
[97]
Browne J and Peck S B 1996 Canadian Journal of Zoology 74 2154–2169
1996
-
[98]
Volkov I, Banavar J R, Hubbell S P and Maritan A 2003 Nature 424 1035–1037
2003
-
[99]
Connor E F and McCoy E D 1979 American Naturalist 113 791–833
1979
-
[100]
He F and Legendre P 2002 Ecology 83 1185–1198
2002
-
[101]
Mart ´ ın H G and Goldenfeld N 2006 Proceedings of the National Academy of Sciences 103 10310–10315
2006
-
[102]
Park S Y, Nanda S, Faraci G, Park Y and Lee H Y 2019 Journal of Biomedical Informatics: X 2 100040
2019
-
[103]
Wilson B C, Vatanen T, Cutfield W S and O’Sullivan J M 2019 Frontiers in Cellular and Infection Microbiology 9 2
2019
-
[104]
Tian H, Ge X, Nie Y, Yang L, Ding C, McFarland L V, Zhang X, Chen Q, Gong J and Li N 2017 PLoS ONE 12 e0171308
2017
-
[105]
Proctor L M, Sechi S, DiGiacomo N D, Fettweis J M, Jefferson K K, III J F S, Rubens C E, Brooks J P, Girerd P P, Huang B, Serrano M G, Sheth N U, Vivadelli S C, Asmussen N C, Borzelleca J F, Bradley S P, Brooks J L, Chalfant C E, Dickinson M R, Drake J I, Edwards D J, Khoury J ...
2014
-
[106]
Human Microbiome Project URL https://hmpdacc.org/
-
[107]
Qin J, Li R, Raes J, Arumugam M, Burgdorf K S, Manichanh C, Nielsen T, Pons N, Levenez F, Yamada T, Mende D R, Li J, Xu J, Li S, Li D, Cao J, W ang B, Liang H, Zheng H, Xie Y, Tap J, Lepage P, Bertalan M, Batto J M, Hansen T, Paslier D L, Linneberg A, Nielsen H B, Pelletier E,...
2010
-
[108]
Nelson ed.) (Springer Science+Business Media) chap 15
Ehrlich S D and the MetaHIT Consortium 2011 MetaHIT: The European Union Project on Metagenomics of the Human Intestinal Tract Metagenomics of the human body (K. Nelson ed.) (Springer Science+Business Media) chap 15
2011
-
[109]
MetaHIT W ebsite URL http://www.metahit.eu
-
[110]
Li J, Jia H, Cai X, Zhong H, Feng Q, Sunagawa S, Arumugam M, Kultima J R, Prifti E, Nielsen T, Juncker A S, Manichanh C, Chen B, Zhang W, Levenez F, W ang J, Xu X, Xiao L, Liang S, Zhang D, Zhang Z, Chen W, Zhao H, Al-Aama J Y, Edris S, Yang H, W ang J, Hansen T, Nielsen H B, ...
2014
-
[111]
Vetrovsk´ y T and Baldrian P 2013 PLoS ONE 8 e57923
2013
-
[112]
Metabolomic W orkbench URL https://www.metabolomicsworkbench.org/
-
[113]
Ribosome Database Project URL http://rdp.cme.msu.edu/
-
[114]
EZBioCloud URL https://www.ezbiocloud.net/
-
[115]
Shreiner A B, Kao J Y and Young V B 2015 Current Opinion in Gastroenterology 31 69–75
2015
-
[116]
Thursby E and Juge N 2017 Biochemical Journal 474 1823–1836
2017
-
[117]
Kim S, Kim N, Presson A P, Metzger M E, Bonifacino A C, Sehl M, Chow S A, Crooks G M, Dunbar C E, An D S, Donahue R E and Chen I S 2014 Cell Stem Cell 14 473–485
2014
-
[118]
W u C, Li B, Lu R, Koelle S J, Yang Y, Jares A, Krouse A E, Metzger M, Liang F, Lor´ e K, W u C O, Donahue R E, Chen I S Y, W eissman I and Dunbar C E 2014 Cell Stem Cell 14 486–499
2014
-
[119]
Belderbos M E, Koster T, Ausema B, Jacobs S, Sowdagar S, Zwart E, de Bont E, de Haan G and Bystrykh L V 2017 Blood 129 3210–3220
2017
-
[120]
Series B: Biological Sciences 270 313–321
Hebert P D, Cywinska A, Ball S L and deW aard J R 2003 Proceedings of the Royal Society of London. Series B: Biological Sciences 270 313–321
2003
-
[121]
Hebert P D N, Stoeckle M Y, Zemlak T S and Francis C M 2004 PLoS Biology 2 e312
2004
-
[122]
Ratnasingham S and Hebert P D N 2007 Molecular Ecology Notes 7 355–364
2007
-
[123]
The Barcode of Life Data System URL http://www.barcodinglife.org
-
[124]
Kress W J, W urdack K J, Zimmer E A, W eigt L A and Janzen D H 2005 Proceedings of the National Academy of Sciences 102 8369–8374
2005
-
[125]
Sgamma T, Masiero E, Mali P, Mahat M and Slater A 2018 Frontiers in Plant Science 9 1828
2018
-
[126]
Bruno A, Sandionigi A, Agostinetto G, Bernabovi L, Frigerio J, Casiraghi M and Labra M 2019 Genes 10 248
2019
-
[127]
Hawkins J A, Jones S K, Finkelstein I J and Press W H 2018 Proceedings of the National Academy of Sciences 115 E6217–E6226
2018
-
[128]
Thielecke L, Aranyossy T, Dahl A, Tiwari R, Roeder I, Geiger H, Fehse B, Glauche I and Cornils K 2017 Scientific Reports 7 43249
2017
-
[129]
Tambe A and Pachter L 2019 BMC Bioinformatics 20 32
2019
-
[130]
Sun J, Ramos A, Chapman B, Johnnidis J B, Le L, Ho Y J, Klein A, Hofmann O and Camargo F D 2014 Nature 514 322–327
2014
-
[131]
Peri´ e L and Duffy K R 2016 FEBS letters 590 4068–4083
2016
-
[132]
Blundell J R and Levy S F 2014 Genomics 104 417 – 430
2014
-
[133]
Rogers Z N, McFarland C D, Winters I P, Seoane J A, Brady J J, Yoon S, Curtis C, Petrov D A and Winslow M M 2018 Nature Genetics 50 483–486
2018
-
[134]
Akimov Y, Bulanova D, Abyzova M, W en- nerberg K and Aittokallio T 2019 bioRxiv https://doi.org/10.1101/622506
2019 doi
-
[135]
Koelle S J, Espinoza D A, W u C, Xu J, Lu R, Li B, Donahue R E and Dunbar C E 2017 Blood 129 1448– 1457
2017
-
[136]
Xu S, Kim S, Chen I S and Chou T 2018 PLoS Computational Biology 14 e1006489
2018
-
[137]
Dessalles R, D’Orsogna M and Chou T 2018 J. Stat. Phys. 173 182–221
2018
-
[138]
thesis UCLA
Xu S 2018 Mathematical Modeling of Clonal Dynamics in Primate Hematopoiesis Ph.D. thesis UCLA
2018
-
[139]
2016 Cell Stem Cell 19 107–119
Biasco L, Pellin D, Scala S, Dionisio F, Basso-Ricci L, Leonardelli L, Scaramuzza S, Baricordi C, Ferrua F, Cicalese M P et al. 2016 Cell Stem Cell 19 107–119
2016
-
[140]
Alt F W, Oltz E M, Young F, Gorman J, Taccioli G and Chen J 1992 Immunology Today 13 306–314
1992
-
[141]
Lythe G, Callard R E, Hoare R L and Molina-Par ´ ıs C 2016 Journal of Theoretical Biology 389 214–224 ISSN 0022-5193
2016
-
[142]
Zarnitsyna V, Evavold B, Schoettle L, Blattman J and Antia R 2013 Frontiers in Immunology 4 485
2013
-
[143]
Hoehn K B, Fowler A, Lunter G and Pybus O G 2016 Molecular Biology and Evolution 33 1147–1157
2016
-
[144]
Yates A J 2014 Frontiers in Immunology 5 13
2014
-
[145]
Casrouge A, Beaudoing E, Dalle S, Pannetier C, Kanellopoulos J and Kourilsky P 2000 Journal of Immunology 164 5782–5787
2000
-
[146]
DeWitt W S, Lindau P, Snyder T M, Sherwood A M, Vignali M, Carlson C S, Greenberg P D, Duerkopp N, Emerson R O and Robins H S 2016 PLoS One 11 e0160853
2016
-
[147]
Rosenfeld A M, Meng W, Chen D Y, Zhang B, Granot T, Farber D L, Hershberg U and Luning Prak E T 2018 Frontiers in Immunology 9 1472
2018
-
[148]
Keane C, Gould C, Jones K, Hamm D, Talaulikar D, Ellis J, Vari F, Birch S, Han E, W ood P, Le-Cao K A, Green M R, Crooks P, Jain S, Tobin J, Steptoe R J and Gandhi M K 2017 Clinical Cancer Research 23 1820–1828
2017
-
[149]
Sethna Z, Elhanati Y, Dudgeon C R, Callan C G, Levine A J, Mora T and W alczak A M 2017 Proceedings of the National Academy of Sciences 114 2253–2258
2017
-
[150]
Oakes T, Heather J M, Best K, Byng-Maddick R, Husovsky C, Ismail M, Joshi K, Maxwell G, Nour- sadeghi M, Riddell N, Ruehl T, Turner C T, Uddin I and Chain B 2017 Frontiers in Immunology 8 1267
2017
-
[151]
Aguilera-Sandoval C R, OYang O, Jojic N, Lovato P, Chen D Y, Boechat M I, Cooper P, Zuo J, Ramirez C, Belzer M, Church J A, and Krogstad P 2017 AIDS 30 701–711
2017
-
[152]
Lythe G and Molina-Par ´ ıs C 2018 Immunological Reviews 285 206–217
2018
-
[153]
Xu S and Chou T 2018 Journal of Physics A: Mathematical and Theoretical 51 425602 Biological Diversity 22
2018
-
[154]
Marcou Q, Mora T and W alczak A M 2018 Nature Communications 9 561
2018
-
[155]
Sethna Z, Elhanati Y, Callan Curtis G J, W alczak A M and Mora T 2019 Bioinformatics 35 2974–2981 ISSN 1367-4803
2019
-
[156]
Dessalles R, D’Orsogna M and Chou T 2019 submitted to: PLoS Computational Biology
2019
-
[157]
Johnson P, Yates A, Goronzy J and Antia R 2012 Proceedings of The National Academy of Sciences USA 109 21432–21437
2012
-
[158]
Rane S, Hogan T, Seddon B and Yates A J 2018 PLoS Computational Biology 16 e2003949
2018
-
[159]
Lewkiewicz S, Chuang Y L and Chou T 2018 Bulletin of Mathematical Biology 81 2783–2817
2018
-
[160]
Egorov E S, Kasatskaya S A, Zubov V N, Izraelson M, Nakonechnaya T O, Staroverov D B, Angius A, Cucca F, Mamedov I Z, Rosati E, Franke A, Shugay M, Pogorelyy M V, Chudakov D M and Britanova O V 2018 Frontiers in Immunology 9 1618
2018
-
[161]
den Braber I, Mugwagwa T, Vrisekoop N, W estera L, M¨ ogling R, Bregje de Boer A, Willems N, Schrijver E H R, Spierenburg G, Gaiser K, Mul E, Otto S A, Ruiter A F C, Ackermans M T, Miedema F, Borghans J A M, de Boer R J and Tesselaar K 2012 Immunity 36 288–297
2012
-
[162]
Maignan C, Ottaviano G, Pinelli D and Rullani F 2003 Fondazione Eni Enrico Mattei
2003
-
[163]
Pizetti E, Salvemini, T)
Gini C 1912 Reprinted in Memorie di metodologica statistica (Ed. Pizetti E, Salvemini, T). Rome: Libreria Eredi Virgilio Veschi
1912
-
[164]
Gastwirth J L 1972 The Review of Economics and Statistics 54 306–316
1972
-
[165]
Atkinson A B and Micklewright J 1992 Economic transformation in Eastern Europe and the distribution of income (Cambridge University Press)
1992
-
[166]
Kennedy B P, Kawachi I and Prothrow-Stith D 1996 British Medical Journal 312 1004–1007
1996
-
[167]
Galichon A 2017 Optimal Transport Methods in Eco- nomics (Princeton University Press)
2017
-
[168]
Theil H 1972 Statistical decomposition analysis; wit h applications in the social and administrative sciences Tech. rep
1972
-
[169]
Novotn` y J 2007 The Annals of Regional Science 41 563– 580
2007
-
[170]
2014 Decomposition of regional income inequality and neighborhood com- ponent: A spatial Theil Index Tech
Lasarte E, Paniagua M A M et al. 2014 Decomposition of regional income inequality and neighborhood com- ponent: A spatial Theil Index Tech. rep. Instituto Va- lenciano de Investigaciones Econ´ omicas, SA (Ivie)
2014
-
[171]
Maio F G D 2007 Journal of Epidemiology and Community Health 61 849–852
2007
-
[172]
B¨ ottcher L, Montealegre P, Goles E and Gersbach H 2019 Physica A: Statistical Mechanics and its Applications 123713
2019
-
[173]
Kawada Y, Nakamura Y and Sunada K 2018 Economics Letters 169 35–27
2018
-
[174]
D’Ambrosio C and W olff E N 2006 Is W ealth Becoming More Polarized in the United States? International Perspectives on Household Wealth Chapters (Edward Elgar Publishing) chap 12
2006
-
[175]
D’Ambrosio C 2001 Review of Income and Wealth 47 43– 64
2001
-
[176]
W ang Y Q and Tsui K Y 2000 Journal of Public Economic Theory 2 349–363
2000
-
[177]
W olfson M C 1994 American Economic Review 84 353– 358
1994
-
[178]
Bailey K D 1990 Systems Practice 3 365–382
1990
-
[179]
Venturi V, Kedzierska K, Turner S J, Doherty P C and Davenport M P 2007 Journal of Immunological Methods 321 182–195
2007
-
[180]
Soetaertl K and Heip C 1990 Mar. Ecol. Prog. Ser 59 305–307
1990
-
[181]
Lewis J E, DeGusta D, Meyer M R, Monge J M, Mann A E and Holloway R L 2011 PLoS Biology 9 1–6
2011
-
[182]
Nagendra H 2002 Applied Geography 22 175–186
2002
Reviewed August 14, 2026 · model on record in the stance chip above.
Discussion (0). Continue with ORCID to comment.