REVIEW 3 major objections 5 minor 18 references
Studies of helium poisoning of a Hamamatsu R5900-00-M16 photomultiplier
T0 review · 3 major / 5 minor · reviewed 2026-08-14 · deepseek-v4-flash
Pith's one-line read The paper argues that four months in pure helium raises a compact photomultiplier's after-pulse rate linearly while its gain slips by only a few percent, concluding the M16 is resilient to helium poisoning.
desk verdict A useful single-tube empirical result on helium tolerance of the R5900-00-M16, with a clear qualitative conclusion but a causation chain that stays a bit soft around the edges. read the letter →
The pith
A machine-rendered reading of the paper's core claim, the machinery that carries it, and where it could break.
The reading
What carries the argument
The argument is carried by a permeation-and-ionization chain that turns helium exposure into a calculable after-pulsing probability. Steady-state Fick's law, $dV/dt = K A \Delta P / D$, is applied to the 0.8 mm borosilicate window with a permeation constant $K \approx 6.1\times10^{-13}$ cm$^3$ mm/(s cm$^2$ cm Hg), giving an influx of about $3.3\times10^{-10}$ cm$^3$/s of helium at STP and a partial pressure inside the tube of roughly 0.3 Pa per day, reaching about 35 Pa after 120 days. The helium density is then converted into an ionization mean free path $\lambda = 1/(n_{\mathrm{He}}\sigma)$ using $\sigma \approx 3\times10^{-17}$ cm$^2$, and the ratio of an effective 0.5 mm path length to $\lambda$ gives the after-pulsing probability. The timing of the prompt after-pulses is estimated by the ion time of flight, $t = d\sqrt{2m_{\mathrm{He}}/(\Delta V_1 e)}$, with $d=1.5$ mm and $\Delta V_1=135$ V, yielding about 27 ns, which matches the observed fast component. This chain is what lets the authors connect the measured dark-noise waveforms to the environmental helium dose.
What would settle it
Expose a second identical M16 tube to flowing nitrogen or argon under the same conditions for the same four-month period; if after-pulsing grows at the same rate without helium, the helium attribution fails, while a flat rate in the control would confirm it. A more direct check would be to measure the internal helium partial pressure with a residual gas analyzer during exposure and compare it with the Fick's-law estimate.
Extended reading notes
Core claim
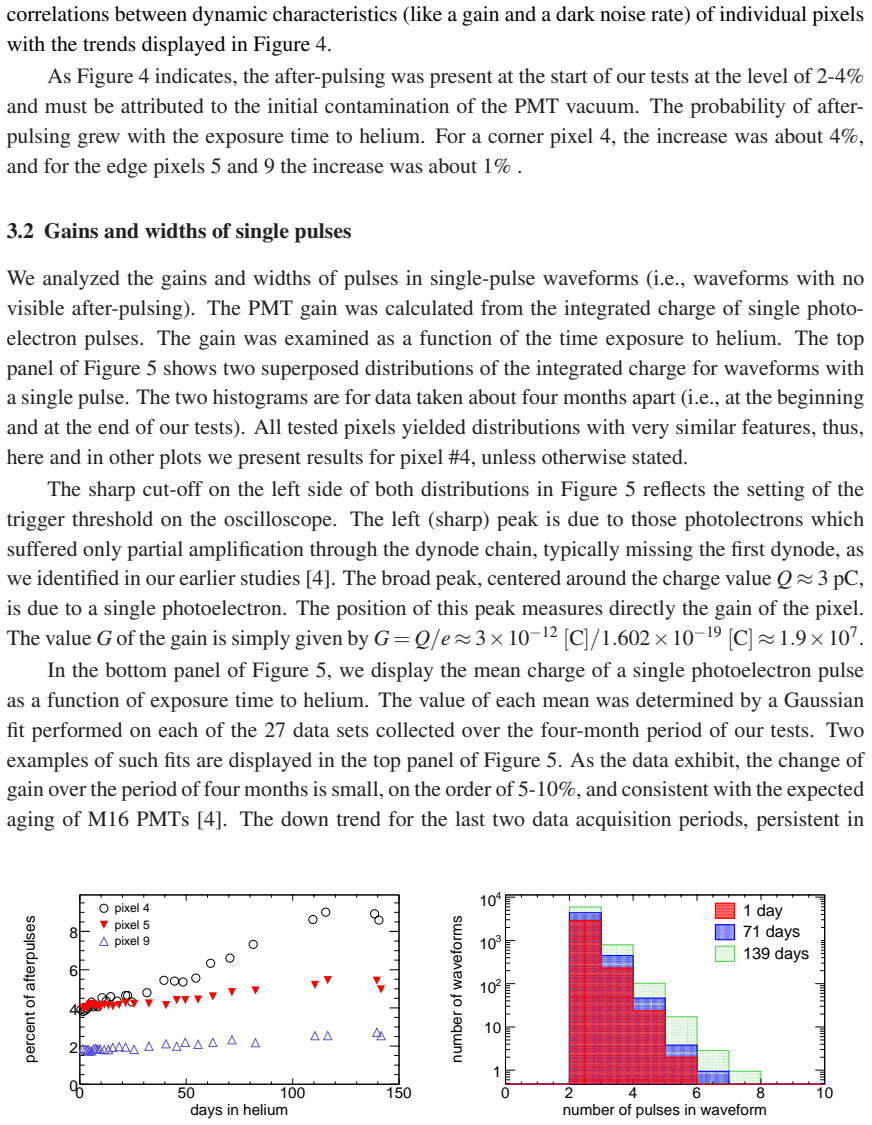
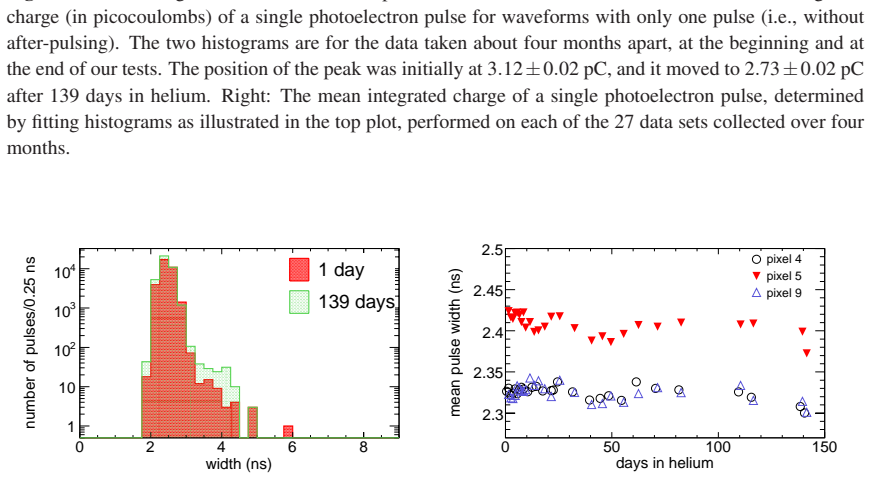
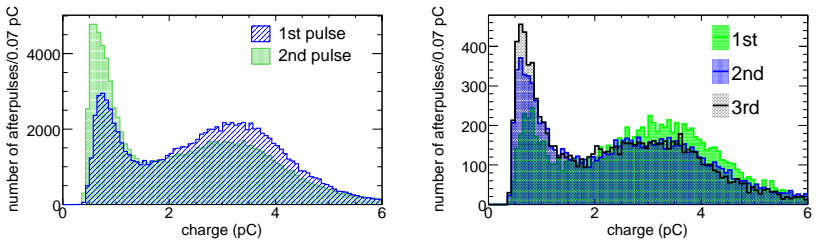
The central claim is that the M16 photomultiplier's response to helium poisoning is dominated by a slowly increasing probability of after-pulses, not by degradation of gain or pulse shape. Over four months of continuous immersion in pure helium at near-atmospheric pressure, the fraction of dark-noise waveforms containing two pulses grew from an initial 2 to 4 percent by roughly 1 percent for edge pixels and up to 4 percent for a corner pixel, while the single-photoelectron charge moved from about 3.12 pC to 2.73 pC. After-pulses have nearly the same charge and width as primary pulses, and their time separation shows two components: a prompt peak around 10 to 70 ns and a broader peak at 150 to 400 ns. The authors interpret the prompt peak as helium ions formed between the photocathode and first dynode, with a calculated ion flight time of about 27 ns, and the delayed peak as ionization deeper in the dynode channel. They argue that the compact geometry and low inter-dynode voltages, 56 to 135 V, keep the ionization probability small and make the tube resilient to helium poisoning.
Load-bearing premise
The weakest step is the assumption that the measured rise in after-pulsing is caused specifically by helium permeating through the glass window, based on a single tube with no control, so ordinary aging, electronic drift, or helium entering through the epoxy seals could in principle produce the same small changes.
Editorial extensions
If this is right
- After-pulsing probability grows linearly with helium exposure time, so the after-pulse rate can serve as a monitor of cumulative helium intake inside the tube.
- The tube's gain and pulse width remain stable during four months of pure helium, meaning detectors using this PMT can tolerate helium-rich environments without immediate loss of energy resolution.
- The two-component after-pulse timing identifies two distinct ionization regions, which can guide the design of future compact photomultipliers to further suppress ion feedback.
- Because after-pulses have similar gain and width to primary pulses, they will contribute to rate and pileup in low-light applications, making after-pulsing the main operational concern from helium contamination.
- These results are directly relevant to MINOS-like detectors operating at low light levels and moderate gain, while high-rate or high-intensity applications are not covered by this test.
Reading between the lines
- The authors' permeation model implies that the measured after-pulsing probability could be inverted into an internal helium pressure estimate, turning a dark-noise waveform measurement into a non-invasive helium dosimeter for PMT lifetime monitoring.
- The reported test was performed at single-photoelectron dark-noise levels; at higher light intensities the same helium ions may cause proportionally more ion-feedback noise, so the resilience claim should be rechecked at the signal amplitudes of the intended application.
- The absence of strong gain loss may reflect the low ionization probability in the compact dynode structure; a longer exposure or an artificially higher internal helium pressure would test whether the linear regime eventually saturates or transitions to more severe degradation.
- A control tube run in an inert gas would separate helium-specific effects from ordinary aging, and a version with the epoxy seal shielded would isolate whether the glass window is truly the dominant permeation path.
Signed reviews
Editorial analysis
A structured set of objections, weighed in public.
Referee Report
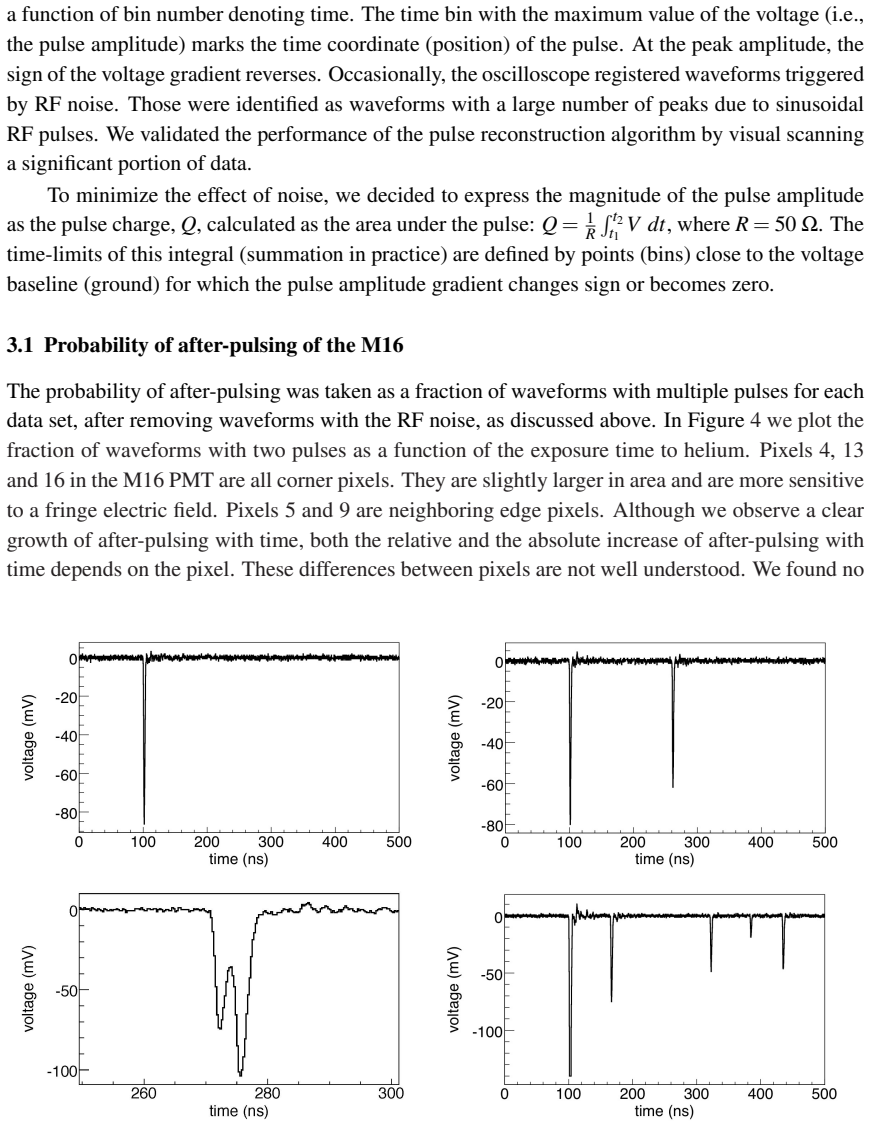
Summary. The paper reports a four-month single-tube experiment in which a Hamamatsu R5900-00-M16 multianode photomultiplier was immersed in flowing pure helium and monitored via dark-noise waveforms on a digital oscilloscope. The authors measure the fraction of waveforms containing a second pulse (after-pulsing probability), the gain and width of single-photoelectron pulses, and the time structure of after-pulses. They find that the after-pulsing fraction increases over time (by about 1–4 percentage points depending on pixel), that the single-photoelectron gain decreases by only about 5–10%, and that after-pulses arrive predominantly at 10–70 ns and 150–400 ns after the primary pulse. They interpret the early peak as helium ions created between the photocathode and first dynode and the broad late peak as ions created deeper in the dynode chain or heavier residual-gas ions. A simple permeation-and-ionization model, using literature values for helium permeation in borosilicate glass, an assumed cathode–first-dynode distance of 1.5 mm, and an assumed effective ionization path of d/3, predicts an after-pulsing probability of about 1.4% after 120 days, in rough agreement with the observed increases. The authors conclude that the M16 PMT is strongly resilient to helium poisoning and that the observed small gain drift is consistent with normal aging.
Significance. If the central claim holds, the result is useful for lifetime and environmental assessments of these specific PMTs, which were used in MINOS and are deployed in other experiments; it provides a quantitative estimate that months of helium exposure at atmospheric pressure produces only a few percent gain loss and a modest increase in after-pulsing. The paper also validates a simple permeation model that could be applied to other small PMTs. Strengths include the use of a well-characterized PMT from prior work [4], a clear waveform-analysis procedure validated by visual scanning, and explicit reporting of the proprietary-parameter caveats. The main limitations are the absence of a control tube or a pre-exposure baseline, the lack of error bars or a statistical fit on the after-pulsing time series, and the reliance on hand-estimated model parameters for the helium attribution.
major comments (3)
- [Secs. 2, 3.1, and 5] The central claim that the observed growth in after-pulsing is caused specifically by helium permeation is not supported by a control measurement. The experiment used a single PMT continuously immersed in helium for 141 days, and the 'initial contamination' at day 1 (2–4% after-pulsing) is asserted without an exposure-time-zero baseline. Because the after-pulsing increase is only 1–4 percentage points and the gain drift is explicitly attributed to aging and to 2–3°C temperature changes at the end of the run, the time trend could in principle be produced by tube aging, electronics drift, or environmental covariates. A control tube kept in air over the same period, or at least a documented zero-exposure measurement, is needed to isolate the helium effect.
- [Sec. 4, esp. 4.2 and 4.3] The quantitative model used to link the observed after-pulsing increase to helium relies on at least four hand-estimated or proprietary parameters: the cathode–first-dynode distance d = 1.5 mm (called 'our best estimate' in footnote 1), the effective ionization path of d/3, the helium ionization cross-section σ = 3×10⁻¹⁷ cm² (described as 'somewhat arbitrarily' chosen), and the internal tube volume of 10 cm³. The model also neglects permeation through the epoxy-sealed pin holes and the Kovar casing. Consequently, the agreement between the predicted 1.4% after-pulsing probability after 120 days and the measured increase of 1–4% is not a strong independent confirmation of the helium attribution; a model with different residual-gas species or different permeation paths could plausibly give similar numbers. The authors should either bound these uncertainties or soften the causal claims accordingly.
- [Fig. 4 and Sec. 3.1] The abstract and conclusions state that the probability of after-pulsing 'increased linearly' with exposure time, but Figure 4 shows only a scatter of points without error bars, and no linear fit or goodness-of-fit statistic is presented. The increase is pixel-dependent (about 4% for pixel 4, about 1% for pixels 5 and 9), which is not explained. Given that the last two gain points in Figure 5 are attributed to uncontrolled temperature changes, the same environmental sensitivity could affect the after-pulsing points. A quantitative fit with uncertainties, or a more guarded wording such as 'increased monotonically within the statistical scatter,' would be more accurate.
minor comments (5)
- [Sec. 4.3] In the expression for P120 days, the units are inconsistent: the text reads '0.05 mm / 3.6 cm' but the numerator should be 0.05 cm (or equivalently 0.5 mm). Please correct the unit.
- [Sec. 4.3 heading] The subsection title 'Estimate of the probability of M6 after-pulsing' appears to contain a typo; it should likely read 'M16'.
- [Fig. 10 caption] The caption contains a typographical error: 'seprated' should be 'separated'.
- [Sec. 3.2 and Fig. 5] The two histograms in the top panel of Figure 5 and the corresponding Gaussian fits are described, but it would be helpful to state the number of waveforms used and the statistical uncertainty of the fitted mean, since the quoted ±0.02 pC appears to be only the fit uncertainty.
- [Sec. 4.1] The permeation calculation uses the glass window area and thickness, but the text earlier in Sec. 2 and Figure 2 note that helium can also permeate through the epoxy sealing pins. A sentence explaining why the epoxy path is neglected in the estimate would improve the transparency of the model.
Circularity Check
No significant circularity: the measured after-pulsing and gain trends are independent of the Section 4 phenomenological model, whose parameters come from literature or labeled estimates rather than from the data.
full rationale
The paper's central claim—that after-pulsing probability grows approximately linearly with helium exposure while gain drops only slightly—rests on direct waveform measurements rather than on a fitted model. Section 4's estimates (Fick's-law permeation through the 0.8 mm window, helium ionization cross-sections from Shah et al. and Montague et al., an assumed effective path length of d/3 = 0.5 mm, and a cathode-to-first-dynode distance d = 1.5 mm explicitly called 'our best estimate') use literature values or hand-assigned parameters and are not fitted to the measured after-pulse rates. The predicted ~1.4% after-pulsing after 120 days is compared with, not reverse-engineered from, the observed 1–4% increase; the predicted 27 ns ion time-of-flight is likewise a computed scale checked against the observed 10–70 ns peak. The only self-citation of note, reference [4], is used to identify the partial-amplification peak and to argue that the 5–10% gain drift is consistent with normal M16 aging; this is an interpretive cross-check, not the source of the measured trend. Concerns about n=1, the absence of an unexposed control tube, and proprietary internal dimensions are experimental and correctness risks, not circularity. No load-bearing step reduces by construction to its own input, so the derivation is self-contained.
Assumptions & free parameters
free parameters (4)
- effective ionization path length =
0.5 mm (d/3, with d = 1.5 mm)
- helium ionization cross-section =
3e-17 cm^2
- cathode-to-first-dynode distance =
1.5 mm
- internal gas volume of M16 =
10 cm^3
assumptions (7)
- domain assumption Steady-state Fick's law governs helium permeation through the glass window.
- domain assumption Helium permeation through the KOVAR metal casing and epoxy seals is negligible.
- domain assumption Photocathode and first dynode are infinite parallel plates.
- domain assumption After-pulsing is caused by helium ions ionized by photoelectrons.
- standard math Published helium ionization cross-section data apply to electrons in the tube.
- domain assumption The photocathode layer's effect on helium permeation is negligible.
- domain assumption The permeation constant for glass 7056 from literature applies to the M16 window.
Cite this review
Pith. "Pith review of Studies of helium poisoning of a Hamamatsu R5900-00-M16 photomultiplier." pith.science (2026). https://pith.science/paper/PFRRIN32
@misc{pith2026190808869,
  author       = {Pith},
  title        = {Pith review of: Studies of helium poisoning of a Hamamatsu R5900-00-M16 photomultiplier},
  year         = {2026},
  howpublished = {\url{https://pith.science/paper/PFRRIN32}},
  note         = {Machine review of arXiv:1908.08869}
}
read the original abstract
We report results from studies of the helium poisoning of a 16-anode photomultiplier tube R5900-00-M16 manufactured by Hamamatsu Photonics. A tube was immersed in pure helium for a period of about four months and was periodically monitored using a digital oscilloscope. Our results are based on the analysis of waveforms triggered by the dark noise pulses. Collected data yield evidence of after-pulses due to helium contamination of the tube. The probability of after-pulsing increased linearly with the exposure time to helium but the phototube suffered only a small drop in gain, indicating generally strong resilience to helium poisoning.
Figures


Figures from the paper (8 more)



Reference graph
Works this paper leans on
- [4]
-
[1]
P875: A Long-baseline Neutrino Oscillation Experiment at Fermilab, The MINOS Collaboration, Fermilab, February, 1995
work page 1995
-
[2]
The MINOS Detectors, Technical Design Report, Fermilab, NuMI-L-337, Fermilab, October, 1998
work page 1998
-
[3]
Lang [for MINOS Collaboration], Nucl
K. Lang [for MINOS Collaboration], Nucl. Instrum. Meth. A 461, 290 (2001)
work page 2001
-
[5]
First beam paper: D. G. Michael et al. [MINOS Collaboration], Phys. Rev. Lett. 97, 191801 (2006); the most recent paper: P. Adamson et al. [MINOS+ Collaboration], Phys. Rev. Lett. 122, no. 9, 091803 (2019)
work page 2006
- [6]
-
[7]
The cavern is neighboring the new MINOS cavern also excavated 705m underground
The CDMS-II (Cryogenic Dark Matter Search) Experiment is located in the Soudan-2 cavern in the Soudan Underground Laboratory in Minnesota. The cavern is neighboring the new MINOS cavern also excavated 705m underground
-
[8]
LabView is a product of National Instruments Corporation, 11500 N Mopac Expwy, Austin, TX 78759-3504, USA
Show all 18 references
-
[9]
Private communication from Hamamatsu Photonics. – 14 –
-
[10]
We used a digital oscilloscope model 584L made by LeCroy Corporation, 700 Chestnut Ridge Rd., Chestnut Ridge, NY 10977-6499, USA
-
[11]
We speculate that the photocathode is a bialkali layer of thickness of 2,000 to 10,000nm (i.e., a few hundred of atomic layers)
The thickness and exact composition of the photocathode constitutes proprietary information. We speculate that the photocathode is a bialkali layer of thickness of 2,000 to 10,000nm (i.e., a few hundred of atomic layers)
-
[12]
R. M. Barrer, Diffusion in and through Solids , Cambridge University Press, New York, 1941
1941
-
[13]
According to Hamamatsu Photonics, the composition of the M16 borosilicate glass front window is very close to Glass Designation 7056 with Si02(68.0%), Al2O3(3.0%), B2O3(18.0%), LiO2(1.0%), Na2O(1.0%), BaO(0.0%), K2O(9.0%) which we used to find the value of the permeation consta...
-
[14]
J. E. Shelby, Handbook of Gas Diffusion in Solids and Melts” , ASM International, Materials Park, OH, 1996 (ISBN: 0-87170-566-4)
1996
-
[15]
V . O. Altemose, J. Appl. Phys. 32(7), 1309 (1961)
1961
-
[16]
M. B. Shah, D. S. Elliot, P. McCallion and H. B. Gilbody, J. Phys. B. At. Mol. Opt. Phys. 21, 2751 (1988)
1988
-
[17]
R. G. Montague, M. F. A. Harrison and A. C. H. Smith, J. Phys. B. At. Mol. Opt. Phys. 17, 3295 (1984)
1984
-
[18]
J. R. Incandela et al., Nucl. Instrum. Meth. A269, 237 (1988). – 15 –
1988
Reviewed August 14, 2026 · model on record in the stance chip above.
Discussion (0). Continue with ORCID to comment.