REVIEW 3 major objections 5 minor 37 references
Region Tracking in an Image Sequence: Preventing Driver Inattention
T0 review · 3 major / 5 minor · reviewed 2026-08-14 · deepseek-v4-flash
Pith's one-line read The eye region is tracked by minimizing a designed functional, with the final design reaching 82% desired-region coverage
desk verdict Coherent undergraduate thesis with a standard level-set functional, but the headline 82% accuracy is a tuning artifact on an undocumented small set. read the letter →
The pith
A machine-rendered reading of the paper's core claim, the machinery that carries it, and where it could break.
The reading
What carries the argument
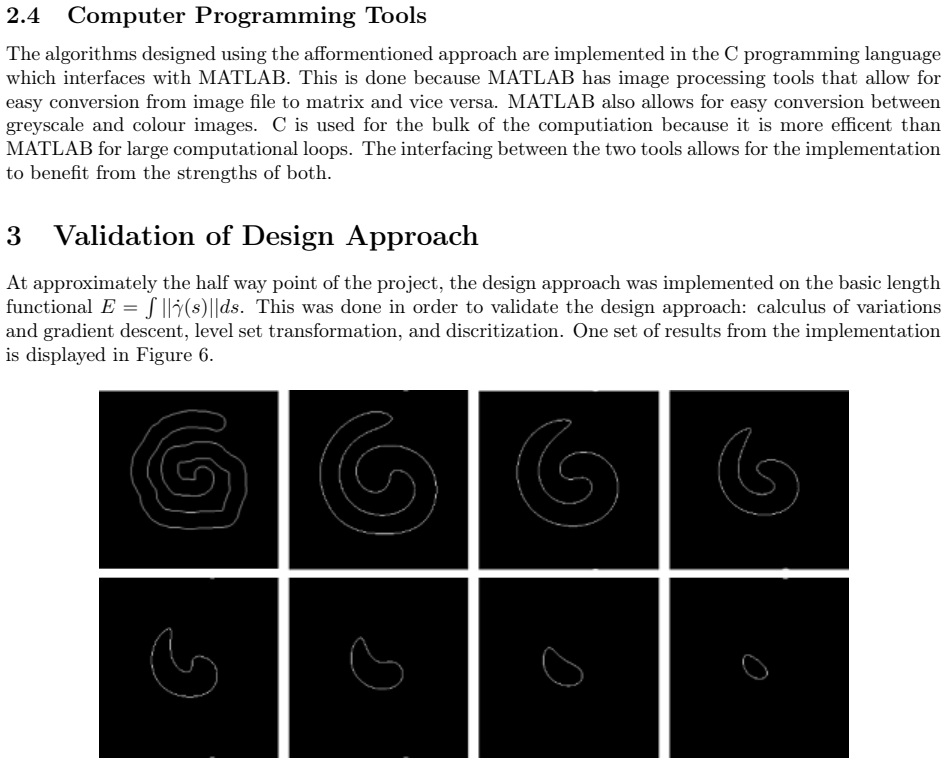
The load-bearing object is the energy functional $E_{4B} = E_4 + \lambda_4(\text{area}(R_1) - \text{area}(R_0))^2$, where $E_4$ is the sum of three per-channel distribution-divergence terms (red, green, blue) plus a curve-length penalty. The curve is represented implicitly as the zero level set of a function $u$ on the image domain, and the minimization is carried out by gradient descent following the Euler–Lagrange equations, with the level-set update $\partial u/\partial t = F\|\nabla u\|$. This representation gives numerical stability and lets the curve change topology freely, and the divergence terms let the functional compare regional appearance without tracking feature points or requiring a static background. The functional's role is to make the eye region a minimum that survives across frames despite shadows and illumination changes.
What would settle it
Run the final Design #4B functional on a frame in which a shadowed patch of skin or clothing has the same per-channel RGB distribution and approximate area as the iris-pupil region; if the minimized curve locks onto that patch instead of the eye, the central claim that the functional distinguishes the eye from similar-looking regions fails.
Extended reading notes
Core claim
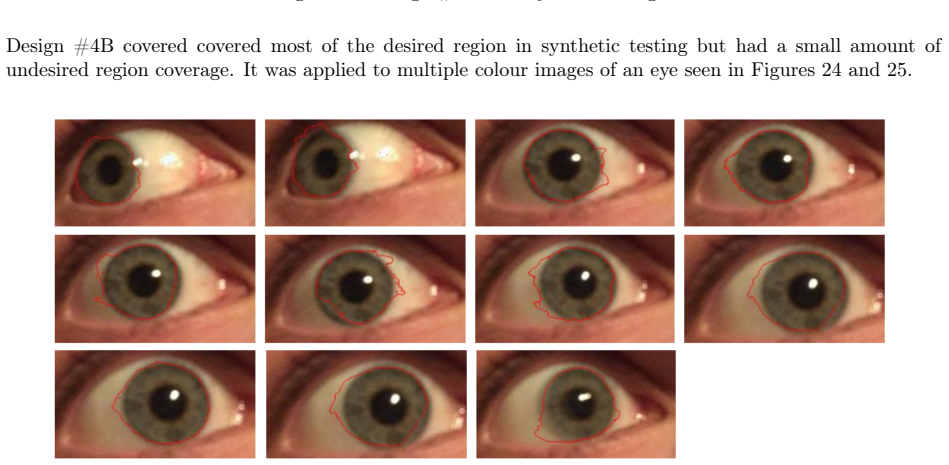
The paper's discovery is a variational formulation of eye tracking: given a region R0 chosen in the first image, find the curve in a later image whose interior best matches R0 according to a functional that rewards similar appearance and penalizes boundary length. The final functional, Design #4B, compares the per-channel RGB intensity distributions of the tracked region with those of the original region using divergence terms, adds a squared difference in area, and includes a length-regularization term. Minimizing this functional by gradient descent yields a level-set curve whose zero level set approximates the iris and pupil boundary. In the paper's reported experiments this functional outperformed earlier intensity-only, relative-entropy, and gradient-based versions, giving an average desired-region coverage of 82% and undesired coverage of 20%.
Load-bearing premise
The load-bearing premise is that the iris and pupil are the only region in the image whose RGB distribution and area match the initial eye region closely enough, for every driver and lighting condition; the paper's own note that all multipliers must be customized per eye shows this invariance does not hold automatically.
Editorial extensions
If this is right
- With this functional, eye position can be estimated without computing motion or requiring a fixed background, which suits a moving driver's head.
- The RGB-distribution terms are the main source of accuracy; intensity-only versions repeatedly failed on shadowed regions.
- The area term prevents the optimizer from shrinking to a subset of the eye region with the same average appearance.
- The reported 82%/20% figures mean the output is a coarse eye-location estimate, not precise gaze, so the larger alert system must tolerate some false region.
- Computation time remains too high for real-time deployment; parallelizing per-pixel updates is suggested as a path forward.
Reading between the lines
- A natural extension is to replace per-channel divergences with the joint RGB distribution; the paper chose the faster per-channel sum for speed, so the accuracy cost of that trade-off is untested.
- Because the multipliers must be customized for each eye, practical deployment would likely need a calibration step at ignition, such as using detected eye color to select parameters.
- The same variational machinery could be tested on other colored anatomical regions or on driver gaze direction rather than just iris and pupil location.
- The 20% undesired coverage suggests a downstream distraction detector should be trained on the tracker's actual output rather than on perfectly labeled eye regions, since the errors are systematic.
Signed reviews
Editorial analysis
A structured set of objections, weighed in public.
Referee Report
Summary. The manuscript presents a variational level-set method for tracking the iris and pupil in an image sequence, motivated by a driver-inattention warning system. The authors propose a series of functionals, culminating in Design #4B, which combines per-channel RGB Kullback-Leibler divergences with an area-preservation term and a length regularization term, minimized by gradient descent on a level-set representation. They report average accuracy metrics of 82% desired-region coverage and 20% undesired-region coverage on a small set of synthetic and real eye images, and they discuss next steps and broader societal impacts. The paper is an MTHE 493 undergraduate thesis posted to arXiv, not a peer-reviewed archival contribution.
Significance. The paper provides a clear pedagogical exposition of the variational level-set tracking pipeline and a sensible design progression from intensity-based to RGB-distribution-based functionals. The observation that color information helps disambiguate shadowed regions from the eye is a useful qualitative insight. However, the central empirical claim--the 82%/20% accuracy figures--is not supported by controlled evidence. The authors explicitly state in Sections 5.5.1 and 6 that the final design requires per-eye customization of all multipliers and that this is 'not acceptable for an implementable solution.' The evaluation set is unspecified, no fixed-parameter protocol is described, and no error bars or statistical details are given. As a controlled validation, the paper falls short of the standard required for a journal publication; its value is primarily as a proof-of-concept description of a functional design.
major comments (3)
- [Section 5.5.1 and Section 6] The reported averages of 82% desired-region coverage and 20% undesired-region coverage are obtained after customizing all multipliers for each eye, as stated in Section 5.5.1 ('This final design also requires customization of all multipliers in order to function of different eyes') and repeated in Section 6 ('The algorithm currently requires tooling to each individual eye that it operates on'). Because the parameters are tuned on the same small set of images that is used to compute the averages, the headline result may be an artifact of parameter fitting rather than a property of the fixed functional. No evidence is provided that a single parameter vector was held fixed across frames or subjects, or that the reported numbers are robust to parameter choices. The central accuracy claim is therefore not supported by controlled experimentation.
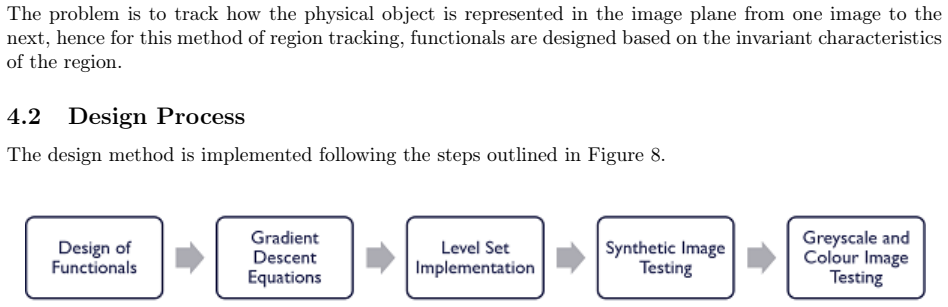
- [Section 4.2 and Section 5.5.1] The evaluation protocol is underspecified to the point of non-reproducibility. The two metrics are described only informally around Figure 9, with no exact formulas, no statement of how ground-truth desired regions were obtained, no count of image sequences or frames, no per-frame versus per-sequence aggregation rule, and no error bars or variance estimates. To justify the claim that the final functional 'on average' yields 82%/20%, the authors must report the data set, the annotation procedure, the exact parameter vector(s) used, and the statistical summary. Without this information, the reader cannot assess the reliability of the empirical result.
- [Section 6 and Section 8] The conclusion that the algorithm 'gives an approximation of the location of a subject's iris and pupil' is in tension with the manuscript's own statement that the algorithm is not acceptable for an implementable solution because it must be tooled to each individual eye. Since the stated application is a driver-inattention system intended to work for all drivers, the reported accuracy is not sufficient to support the claimed practical relevance. The paper should either demonstrate that the customization requirement can be removed or reframe the contribution as an initial design study with clearly limited generalizability.
minor comments (5)
- [Section 2.4] There are typographical errors in the text, e.g., 'efficent' should be 'efficient' and 'computiation' should be 'computation.'
- [Section 5.5.1] In the paragraph describing Figure 23, the phrase 'covered covered' should read 'covered.'
- [Section 5.3] The term 'Kullback-Liebler' should be spelled 'Kullback-Leibler.'
- [Section 7.4] The sentence 'With 10% accuracy, the system could save up to 183 lives per year' introduces a '10% accuracy' figure that is not derived from the 82%/20% reported metrics; the connection should be explained or the statement should be removed.
- [Section 2.3] The finite-difference notation is inconsistent, with δx used in some definitions of D+x and D−x and ∆x used in others; this should be harmonized for clarity.
Circularity Check
The 82% coverage claim is an in-sample tuned-parameter result, not an independent prediction of the fixed functional.
-
fitted input called prediction
[Section 5.5.1 (Design #4B: Final Design), accuracy metrics; see also Section 6]
"There is a trade-off present in tuning the parameters of this design between region coverage and undesired region coverage. Higher λ4 relative to the other multipliers resulted in more desired region coverage, but also resulted in more undesired region coverage. This final design also requires customization of all multipliers in order to function of different eyes. The average accuracy metrics for the above results were: Desired Region Coverage = 82% Undesired Region Coverage = 20%"
The headline 82%/20% numbers are reported immediately after saying that all multipliers need per-eye customization and that tuning trades off the two metrics. Because the same images used for tuning are the ones summarized by the average, the accuracy is an in-sample evaluation of the hand-tuned λs, not a test of a fixed functional. Section 6 confirms this: "The algorithm currently requires tooling to each individual eye that it operates on. This is not acceptable for an implementable solution." Thus the central empirical claim reduces to a fitted-parameter report; no held-out or fixed-parameter evaluation is presented to show the functional itself tracks previously unseen eyes.
full rationale
The variational derivation itself is self-contained: the functional E4B is minimized by gradient descent on a level-set representation, and the objective is not defined in terms of the reported coverage metric. The self-citation [11] to the supervisor's earlier level-set tracking work is used only as a general statement about numerical stability and topology independence, and it is not load-bearing for the paper's central derivation. The only significant circularity is in the empirical performance claim. The paper states that all multipliers must be customized per eye, and Section 6 explicitly says the algorithm requires tooling to each individual eye and that this is unacceptable for an implementable solution. Reporting the average coverage over the same tuned sequences therefore presents a fitted, in-sample result as if it were the accuracy of the final functional. This is a fitted-input-called-prediction pattern: the numbers are statistically forced by the tuning process, not independent evidence for the fixed algorithm. Score 6 reflects partial circularity in the headline claim; the underlying functional design still has independent content and is not definitionally equivalent to its output.
Assumptions & free parameters
free parameters (5)
- lambda_1 (RGB divergence weight, red channel) =
not reported; hand-tuned
- lambda_2 (RGB divergence weight, green channel) =
not reported; hand-tuned
- lambda_3 (RGB divergence weight, blue channel) =
not reported; hand-tuned
- lambda_4 (area preservation weight) =
not reported; hand-tuned
- lambda (length regularization weight) =
not reported; hand-tuned
assumptions (5)
- domain assumption The regions of interest contain no holes and have smooth boundaries.
- domain assumption The energy E has a minimizer.
- domain assumption The iris and pupil are identifiable by static intensity or color statistics that differ from surrounding regions.
- standard math The first variation of E can be written as F N, with tangential components ignored.
- domain assumption The implemented upwind discretization is stable and converges to the continuous gradient descent.
Cite this review
Pith. "Pith review of Region Tracking in an Image Sequence: Preventing Driver Inattention." pith.science (2026). https://pith.science/paper/JDTQEAUE
@misc{pith2026190808914,
  author       = {Pith},
  title        = {Pith review of: Region Tracking in an Image Sequence: Preventing Driver Inattention},
  year         = {2026},
  howpublished = {\url{https://pith.science/paper/JDTQEAUE}},
  note         = {Machine review of arXiv:1908.08914}
}
read the original abstract
Driver inattention is a large problem on the roads around the world. The objective of this project was to develop an eye tracking algorithm with sufficient computational efficiency and accuracy, to successfully realize when the driver was looking away from the road for an extended period. The method of tracking involved the minimization of a functional, using the gradient descent and level set methods. The algorithm was then discretized and implemented using C and MATLAB. Multiple synthetic images, grey-scale and colour images were tested using the final design, with a desired region coverage of 82%. Further work is needed to decrease the computation time, increase the robustness of the algorithm, develop a small device capable of running the algorithm, as well as physically implement this device into various vehicles.
Figures


Figures from the paper (21 more)





Reference graph
Works this paper leans on
-
[11]
Region tracking via level set pdes without motion computation,
A.-R. Mansouri, “Region tracking via level set pdes without motion computation,”IEEE Transactions on Pattern Analysis and Machine Intelligence , vol. 24, no. 7, pp. 947–961, 2002
work page 2002
-
[1]
Driver’s lane keeping ability with eyes off road: Insights from a naturalistic study,
Y. Peng, L. N. Boylea, and S. L. Hallmark, “Driver’s lane keeping ability with eyes off road: Insights from a naturalistic study,”Accident Analysis and Prevention , vol. 50, pp. 628–634, 2013
work page 2013
-
[2]
Automatic feature point extraction and tracking in image sequences for unknown camera motion,
Q. Zheng and R. Chellappa, “Automatic feature point extraction and tracking in image sequences for unknown camera motion,”IEEE, 1993
work page 1993
-
[3]
A combined corner and edge detector,
C. Harris and M. Stephens, “A combined corner and edge detector,”Alvey vision conference, vol. 15, no. 50, 1988
work page 1988
-
[4]
A. Yilmaz, O. Javed, and M. Shah, “Object tracking: A survey,”ACM Computing Surveys , vol. 38, no. 4, 2006
work page 2006
-
[5]
Active contours for video object tracking using region, boundary and shape information,
M. S. Allili and D. Ziou, “Active contours for video object tracking using region, boundary and shape information,”Signal, Image and Video Processing , vol. 1, no. 2, pp. 101–117, 2007
work page 2007
-
[6]
Eye-tracking: Characteristics and methods,
D. Richardson and M. Spivey, “Eye-tracking: Characteristics and methods,”Encyclopedia of biomaterials and biomedical engineering , vol. 3, pp. 1028–1042, 2004
work page 2004
-
[7]
Optimal approximations by piecewise smooth functions and associated variational problems,
D. Mumford and J. Shah, “Optimal approximations by piecewise smooth functions and associated variational problems,”Communications on Pure and Applied Mathematics , vol. 42, no. 5, pp. 577–685, 1989
work page 1989
Show all 37 references
-
[8]
Gelfand and S
I. Gelfand and S. Fomin,Calculus of Variations. Englewood Cliffs, New Jersey: Prentice-Hall, 1963
1963
-
[9]
Sethian, Level Set Methods and Fast Marching Methods
J. Sethian, Level Set Methods and Fast Marching Methods . Cambridge, United Kingdom: Cambridge University Press, 1996
1996
-
[10]
Level set method for motion by mean curvature,
T. Colding and W. Minicozzi, “Level set method for motion by mean curvature,”Notices of the AMS , vol. 63, no. 10, pp. 1148–1153, 2016
2016
-
[12]
Visualizing projections
S. Lebron, “Visualizing projections.”http://shaunlebron.github.io/visualizing-projections/
-
[13]
The relationship between road safety and congestion on motorways,
P. Marchesini and W. Weijermars, “The relationship between road safety and congestion on motorways,” 2010.https://www.swov.nl/rapport/R-2010-12.pdf
2010
-
[14]
Real-world co2 impacts of traffic congestion,
M. Barth and K. Boriboonsomsin, “Real-world co2 impacts of traffic congestion,” 2008
2008
-
[15]
Cell phone use while driving statistics,
“Cell phone use while driving statistics,” Edgar Snyder and Associates, 2016.https://www. edgarsnyder.com/car-accident/cause-of-accident/cell-phone/cell-phone-statistics.html
2016
-
[16]
How much energy does it take to make a car?,
D. Fridley, “How much energy does it take to make a car?,” 2009.http://energyskeptic.com/2015/ how-much-energy-does-it-take-to-make-a-car-by-david-fridley-lbl/
2009
-
[17]
How much electricity does an american home use?,
U.S. Energy Information Administration, “How much electricity does an american home use?,” 2016. https://www.eia.gov/tools/faqs/faq.cfm?id=97&t=3
2016
-
[18]
Sensitivity of eye-movement measures to in-vehicle task difficulty,
T. W. Victor, J. L. Harbluk, and J. A. Engstrom, “Sensitivity of eye-movement measures to in-vehicle task difficulty,” 2005
2005
-
[19]
The economic and societal impact of motor vehicle collisions,
National Highway Traffic Safety Administration, “The economic and societal impact of motor vehicle collisions,” 2010.https://crashstats.nhtsa.dot.gov/Api/Public/ViewPublication/812013
2010
-
[20]
Road Safety in Canada,
Transport Canada, “Road Safety in Canada,” 2011. http://www.tc.gc.ca/eng/motorvehiclesafety/tp-tp15145-1201.htm
2011
-
[21]
GDP current US Dollars,
The World Bank, “GDP current US Dollars,” 2015. http://data.worldbank.org/indicator/NY.GDP.MKTP.CD. 21
2015
-
[22]
Facts and stats,
National Sleep Foundation, “Facts and stats,”http://drowsydriving.org/about/facts-and-stats
-
[23]
Eye-tracking system monitors driver fatigue, prevents sleeping at wheel,
O. Solon, “Eye-tracking system monitors driver fatigue, prevents sleeping at wheel,” 2013. http://www.wired.co.uk/article/eye-tracking-mining-system
2013
-
[24]
Canadian Motor Vehicle Traffic Collision Statistics,
Transport Canada, “Canadian Motor Vehicle Traffic Collision Statistics,” 2014. https://www.tc.gc.ca/media/documents/roadsafety/cmvtcs2014_eng.pdf
2014
-
[25]
GDB Profile Canada,
Health Metrics and Evaluation, “GDB Profile Canada,” 2012.https://www.healthdata.org/sites/ default/files/files/country_profiles/GBD/ihme_gbd_country_report_canada.pdf
2012
-
[26]
The economic burden of injury in canada,
SmartRisk, “The economic burden of injury in canada,” 2009. http://www.parachutecanada.org/downloads/research/reports/EBI2009-Eng-Final.pdf
2009
-
[27]
National health expenditure trends, 1975 to 2014,
Canadian Institute for Health Information, “National health expenditure trends, 1975 to 2014,” 2014. https://www.cihi.ca/en/nhex_2014_report_en.pdf
1975
-
[28]
The economic and societal impact of motor vehicle crashes, 2010 (revised),
L. Blincoe and T. Miller, “The economic and societal impact of motor vehicle crashes, 2010 (revised),” 2015
2010
-
[29]
Law would allow cops to search phones after crashes,
M. Derer, “Law would allow cops to search phones after crashes,” NBC News, 2013. http://usnews.nbcnews.com/_news/2013/06/12/ 18921600-law-would-allow-cops-to-search-phones-after-crashes?lite
2013
-
[30]
Hackers remotely kill a jeep on the highway,
Wired, “Hackers remotely kill a jeep on the highway,” 2015. https://www.wired.com/2015/07/hackers-remotely-kill-jeep-highway/
2015
-
[31]
Trump signs repeal of u.s. broadband privacy rules,
Reuters, “Trump signs repeal of u.s. broadband privacy rules,” 2017. http://www.reuters.com/article/us-usa-internet-trump-idUSKBN1752PR?il=0
2017
-
[32]
Human drivers could soon be banned from the roads,
Dailymail, “Human drivers could soon be banned from the roads,” 2016. http://www.dailymail.co.uk/sciencetech/article-3802760/ Human-drivers-soon-BANNED-roads-Proposal-aims-areas-designated-self-driving-cars-five-years. html
2016
-
[33]
Seatbelt reminders,
European Commission, “Seatbelt reminders,” 2017. https://ec.europa.eu/transport/road_safety/specialist/knowledge/esave/esafety_ measures_known_safety_effects/seat_belt_reminders_en
2017
-
[34]
Ignition interlock 101,
R. Stim, “Ignition interlock 101,” Nolo, 2014.http://dui.drivinglaws.org/interlock.php#
2014
-
[35]
Distracted driving - frequently asked questions,
Ontario Ministry of Transportation, “Distracted driving - frequently asked questions,” http://www.mto.gov.on.ca/english/safety/distracted-driving-faq.shtml
-
[36]
Distracted driving,
Government of Ontario, “Distracted driving,” https://www.ontario.ca/page/distracted-driving/#section-2
-
[37]
Greenhouse gas emissions by economic sector,
The Government of Canada, “Greenhouse gas emissions by economic sector,” 2014. https://www.ec.gc.ca/indicateurs-indicators/default.asp?lang=en&n=F60DB708-1. 22
2014
Reviewed August 14, 2026 · model on record in the stance chip above.
Discussion (0). Continue with ORCID to comment.