REVIEW 4 major objections 4 minor 21 references
Identifying Indoor Points of Interest via Mobile Crowdsensing: An Experimental Study
T0 review · 4 major / 4 minor · reviewed 2026-08-14 · deepseek-v4-flash
Pith's one-line read Indoor places a person visits, and places shared across people, can be identified from ordinary smartphone Wi-Fi scans by clustering RSS vectors with cosine similarity.
desk verdict A real crowdsensing POI pipeline undone by an anecdotal, threshold-tuned evaluation; worth a referee but not a citation. read the letter →
The pith
A machine-rendered reading of the paper's core claim, the machinery that carries it, and where it could break.
The reading
What carries the argument
The load-bearing identity is the cosine similarity of two RSS vectors, $C = Y/(\sqrt{d_1}\sqrt{d_2})$, where $Y$ is the dot product taken over access-point MAC addresses appearing in both scans and $d_1,d_2$ are the self-dot-products of each scan. Since measured RSS values are negative dBm numbers, scans from one place point in similar directions in RSS space, making $C$ close to 1 even when absolute signal strengths differ; the paper uses $C \geq 0.5$ as the DBSCAN neighbourhood test and sets minPts $= 4$ because a POI is defined as a stay of at least 20 minutes at a 5-minute scan cadence. The same pairwise $C$ values become edge weights in a Louvain community-detection graph, whose modularity optimization separates shared POIs from private ones.
What would settle it
Take two of the phone models in Table IV (for example, OnePlus 3 and Sony Xperia Z3), leave them side by side in one room for the 20 minutes the paper uses to define a POI, and compute the pairwise cosine similarities of their five-minute scans: if a large share of same-location cross-device pairs falls below the 0.5 threshold, or same-location similarity is not separated from different-location similarity, the claimed identification collapses.
Extended reading notes
Core claim
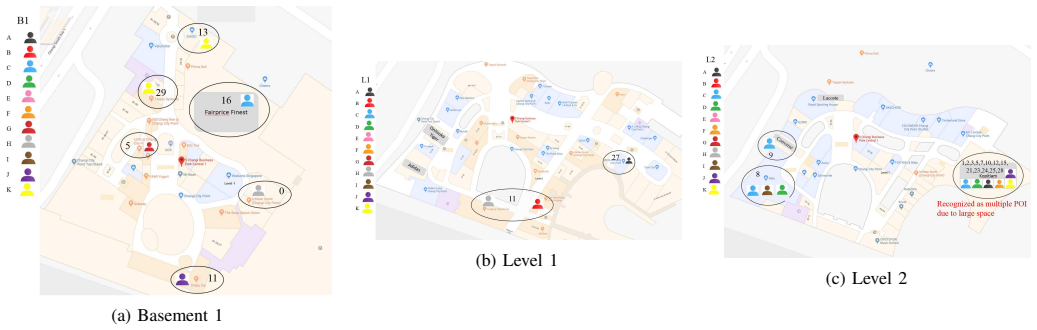
The central claim is that a Wi-Fi RSS fingerprint encodes a place well enough to support indoor point-of-interest extraction from low-rate crowdsensed data. Concretely, the paper converts each five-minute scan into a vector of RSS values keyed by access-point MAC addresses, clusters the day's scans with DBSCAN in which the neighbourhood relation is 'cosine similarity at least 0.5' and a cluster needs four scans, and reports that the resulting clusters match the ground-truth POIs of a user's day, including revisits to the same POI. The threshold comparison in Table II is the key evidence: at 0.5 the extracted sequence is exactly Home, Office, Meeting room, Canteen, Office, Home, while at 0.6 an extra POI appears because small environmental changes alter the RSS. For the common-POI scenario, 41 detected POIs across 11 shoppers are connected by 820 pairwise similarities and partitioned by Louvain community detection, yielding communities that correspond to places such as the food court and shops in a mall.
Load-bearing premise
The load-bearing premise is that RSS measurements from different smartphone models can be compared directly with cosine similarity, and that access points missing from one scan can simply be left out of the dot product, without any device calibration or minimum-overlap rule.
Editorial extensions
If this is right
- A phone carried through a day can produce a start/end time-stamped list of the indoor places its owner visits, using only its own five-minute Wi-Fi scans.
- When the same user returns to a previously visited POI, the cosine similarity of the new scans to the stored POI fingerprint puts the revisit in the same cluster, enabling visit counts and dwell times.
- Across a group of users, the same similarity threshold of 0.5, applied to pairwise POI similarities and fed into Louvain community detection, yields the shared POIs of the environment.
- The six-hour compressed upload size is a few kilobytes, so the sensing burden on the network is small enough for the proposed crowdsensing workflow.
Reading between the lines
- The paper does not compare same-location similarity across the 11 phone models directly; a reader should expect that cross-device RSS offsets and different antenna gains could lower cosine scores, so per-device calibration or a lower threshold for cross-user matching is a testable refinement.
- The five-minute scan cadence and 20-minute minimum stay set a floor on what counts as a POI; shorter encounters such as a coffee counter or ATM will be invisible, so applications aimed at those places would need a faster scan rate and would pay a battery cost.
- The same pairwise-similarity graph used for community detection can be reused for recommendation: POIs that recur inside one community are the places a new user with overlapping patterns is most likely to visit next, which the paper mentions only as future profiling work.
Signed reviews
Editorial analysis
A structured set of objections, weighed in public.
Referee Report
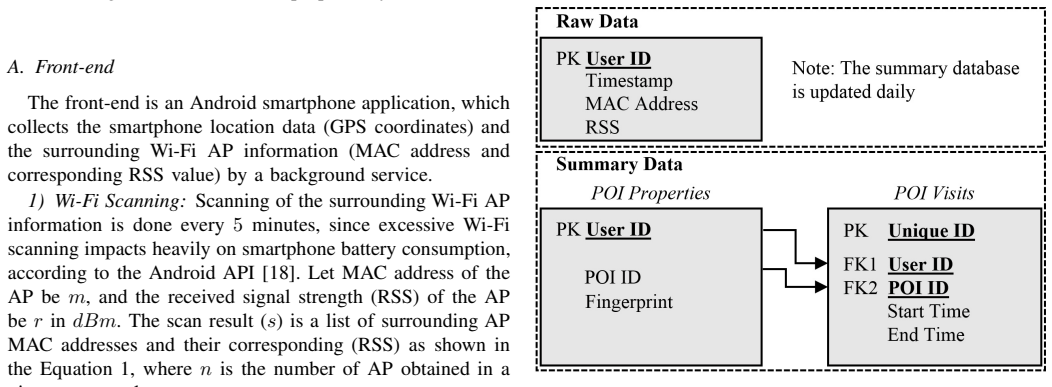
Summary. The manuscript proposes a mobile crowdsensing system for indoor point-of-interest (POI) identification. A smartphone application collects Wi-Fi scans (MAC addresses and RSS values) every five minutes, compresses them with gzip, and uploads them to a backend. The backend clusters scans using a modified DBSCAN with cosine similarity of RSS vectors, assigns a POI fingerprint to each cluster, and then uses Louvain community detection on pairwise POI similarities to find common POIs across users. The experimental section reports results for two similarity thresholds for one user's day, for one user's revisited POIs, and for common POIs among 11 users in a shopping mall. The paper's central claim is that this pipeline can identify distinct and common indoor POIs.
Significance. If established, the approach would offer a low-power, infrastructure-light way to infer indoor places from ordinary smartphone Wi-Fi scans, with applications in mobility and behavior analysis. The strengths of the paper are its real deployment with volunteer users and ground-truth labels, the clear system architecture, and the explicit treatment of data compression. However, the evidence presented is anecdotal and lacks quantitative accuracy assessment; the central similarity threshold is selected on the same data used for validation. Consequently, the current manuscript does not substantiate the abstract's claim that the system 'can identify' POIs beyond a demonstration.
major comments (4)
- [III-A, Table II] The threshold ε=0.5 is introduced in Section III-A with the justification 'based on experimental evaluation as shown in the Table II', and Table II.A is then presented as the matching case. Because ε is chosen by checking which value reproduces the ground-truth labels in that same table, the table is not an independent test. There is no held-out evaluation on other days, users, or environments; every later result, including the community detection in Section IV-C, uses this same fitted threshold. This circularity makes the central feasibility claim unsupported.
- [IV-B, IV-C] No quantitative accuracy metric (precision, recall, F1, or a confusion count) is reported for POI extraction. Tables II and III are anecdotal label sequences, and the shopping-mall common-POI experiment in Section IV-C lacks ground-truth validation: Table V reports only Louvain modularity, and the authors select ε=0.5 despite the higher modularity at ε=0.3 (0.803 vs 0.692), giving no label-based justification for that choice. The claim that the system identifies common POIs across users is therefore not measured.
- [III-B, Eqs. (6)-(9)] The cosine similarity in Equations (6)-(9) is computed only over MAC addresses common to the two fingerprints. No mechanism is described for missing APs, RSS normalization, or device-specific calibration, even though Table IV lists 11 different smartphone models. Intermittent Wi-Fi scans can thus produce same-POI pairs with few common MACs and deflated scores, while pairs that happen to share a small set of MACs can receive high scores. The cross-user common-POI result relies directly on this unvalidated comparability assumption.
- [Algorithm 1] The pseudocode of Algorithm 1 is not a well-defined procedure as printed: the loop variable z1 is incremented only in the else branch, so after a cluster is formed the same α may be revisited indefinitely, and the inner loop's control flow for β ∈ Vp is ambiguous. This makes the core clustering algorithm not fully reproducible from the paper.
minor comments (4)
- [Section I] The last paragraph says 'Section IV concludes the paper with a discussion and future work'; the conclusion is actually Section V.
- [Table III] The text refers to POI IDs highlighted in the same color, but the table as presented does not use color; please use distinct markers or labels to indicate revisits.
- [Algorithm 2] The line 'N = 0' should initialize N to the empty set rather than the integer 0.
- [IV] The paper does not report the number of Wi-Fi scans per user or the total duration of the shopping-mall data collection, which would help assess the coverage and stability of the reported results.
Circularity Check
The core experimental demonstration is partly circular: the cosine-similarity threshold epsilon=0.5 is chosen because it reproduces the ground-truth POI sequence in Table II, and the same tuned threshold then generates the POI and community-detection results presented as evidence.
-
fitted input called prediction
[Section III-A (threshold selection), used in Sections IV-A and IV-B]
"Based on typical user behaviour, we form a POI if a user stays at least 20 minutes in one place. Therefore, we select DBSCAN parameters such as minimum points to form a cluster ( minP ts) as 4 (based on 5 minute scan interval), and the similarity threshold ( ǫ) as 0.5 (based on experimental evaluation as shown in the Table II)."
The threshold epsilon is not derived from first principles or a calibration set; it is selected by experimentally evaluating values and choosing the one whose output matches the ground-truth POI labels in Table II.A for a single user's day. The same 0.5 threshold is then used in Section IV-B to produce the POI revisits in Table III and in Section IV-C to build the common-POI communities. Those outputs are presented as the experimental demonstration of POI identification, but they are produced by the very parameter fitted to the displayed ground truth. With no held-out data, no quantitative accuracy metric, and no independent threshold-selection procedure, the demonstration restates the fitting criterion rather than validating a prediction.
-
fitted input called prediction
[Section IV-C (community detection threshold selection)]
"We evaluated different similarity thresholds as shown in Table V to understand the best partition for communities, based on the Louvain modularity. Since, different POI has different sizes in space (e.g. Food court is larger when compared to a clothing shop), our objective is to identify even the smallest POI in the shopping mall visited by users. Therefore, for POI identification we used 0.5 threshold in community detection."
For the common-POI experiment, the paper explicitly reports in Table V that threshold 0.3 gives Louvain modularity 0.803, while 0.5 gives only 0.692. The reason given for nevertheless choosing 0.5 is not that it best fits the data or is independently justified, but that it produces the desired granularity, namely identifying even the smallest POI. The community maps in Figure 3 are therefore generated under a threshold selected specifically to yield the granularity the authors want to show. The resulting 'common POI among users' finding is an artifact of that choice rather than an independent test of the method.
full rationale
The paper's central claim is that Wi-Fi cosine similarity clustering and community detection can identify distinct and common indoor POIs. The derivation chain is self-contained in the sense that the clustering algorithm and similarity equations are clearly specified and not circular by themselves. However, the experimental validation is partly circular because the key hyperparameter, the cosine similarity threshold epsilon, is tuned directly against the ground-truth labels in Table II and then reused to generate the very POI outputs and community partitions that are presented as supporting evidence. Section III-A states that epsilon = 0.5 is chosen 'based on experimental evaluation as shown in the Table II,' and Section IV-A confirms that 0.5 was selected because it 'matches with the ground truth.' The subsequent individual-user matching in Table III and the shopping-mall community detection in Figure 3 rely on that same tuned threshold, with no held-out users, buildings, or devices used to test generalization. In the community-detection step, the threshold is explicitly chosen to force a desired granularity even though Table V shows it does not maximize Louvain modularity. These are instances of a fitted input being called a prediction. The self-citation in Section III-A to the authors' prior work [10] for choosing DBSCAN is not counted as load-bearing circularity because DBSCAN is a standard, externally documented algorithm and that choice is not the core of the claimed contribution. Overall, the experimental support for the central feasibility claim is partially circular: the parameter fitting is built into the demonstrated results, though the system itself is not wholly reducible to its inputs.
Assumptions & free parameters
free parameters (2)
- epsilon =
0.5
- minPts =
4
assumptions (3)
- domain assumption Wi-Fi scans at the same physical location have cosine similarity above 0.5, and scans at different locations have similarity below 0.5.
- domain assumption Missing access points can be ignored; cosine similarity over common MAC addresses is a sufficient location fingerprint.
- domain assumption RSS values from different smartphone models are comparable without normalization.
Cite this review
Pith. "Pith review of Identifying Indoor Points of Interest via Mobile Crowdsensing: An Experimental Study." pith.science (2026). https://pith.science/paper/5PMGR2BA
@misc{pith2026190808929,
  author       = {Pith},
  title        = {Pith review of: Identifying Indoor Points of Interest via Mobile Crowdsensing: An Experimental Study},
  year         = {2026},
  howpublished = {\url{https://pith.science/paper/5PMGR2BA}},
  note         = {Machine review of arXiv:1908.08929}
}
read the original abstract
This paper presents a mobile crowdsensing approach to identify the indoor points of interest (POI) by exploiting Wi-Fi similarity measurements. Since indoor environments are lacking the GPS positioning accuracy when compared to outdoors, we rely on widely available Wi-Fi access points (AP) in contemporary urban indoor environments, to accurately identify user POI. We propose a smartphone application based system architecture to scan the surrounding Wi-Fi AP and measure the cosine similarity of received signal strengths (RSS), and demonstrate through the experimental results that it is possible to identify the distinct POI of users, and the common POI among users of a given indoor environment.
Figures

Reference graph
Works this paper leans on
-
[13]
J. Y . Zhu, A. X. Zheng, J. Xu, and V . O. Li, “Spatio-tempor al (st) similarity model for constructing wifi-based rssi fingerpri nting map for indoor localization,” in Indoor Positioning and Indoor Navigation (IPIN), 2014 International Conference on . IEEE, 2014, pp. 678–684
work page 2014
-
[15]
Fusing similarity-ba sed sequence and dead reckoning for indoor positioning without training ,
R. Liu, C. Y uen, T. Do, and U. Tan, “Fusing similarity-ba sed sequence and dead reckoning for indoor positioning without training ,” IEEE Sensors Journal, vol. 17, no. 13, pp. 4197–4207, July 2017
work page 2017
-
[1]
Crowdsend ing based public transport information service in smart cities,
K. Farkas, G. Feher, A. Benczur, and C. Sidlo, “Crowdsend ing based public transport information service in smart cities,” IEEE Communica- tions Magazine , vol. 53, no. 8, pp. 158–165, 2015
work page 2015
-
[2]
Secondnose: an air quality mobile crowdsensing system,
C. Leonardi, A. Cappellotto, M. Caraviello, B. Lepri, an d F. Antonelli, “Secondnose: an air quality mobile crowdsensing system,” i n Proceed- ings of the 8th Nordic Conference on Human-Computer Interac tion: Fun, Fast, F oundational. ACM, 2014, pp. 1051–1054
work page 2014
-
[3]
Multidim ensional context-aware social network architecture for mobile crow dsensing,
X. Hu, X. Li, E. Ngai, V . Leung, and P . Kruchten, “Multidim ensional context-aware social network architecture for mobile crow dsensing,” IEEE Communications Magazine , vol. 52, no. 6, pp. 78–87, 2014
work page 2014
-
[4]
Estimating human trajectories and hotspots through mobile phone data,
S. Hoteit, S. Secci, S. Sobolevsky, C. Ratti, and G. Pujol le, “Estimating human trajectories and hotspots through mobile phone data, ” Computer Networks, vol. 64, pp. 296–307, 2014
work page 2014
-
[5]
C. Kang, S. Sobolevsky, Y . Liu, and C. Ratti, “Exploring h uman move- ments in singapore: a comparative analysis based on mobile p hone and taxicab usages,” in Proceedings of the 2nd ACM SIGKDD international workshop on urban computing . ACM, 2013, p. 1
work page 2013
-
[6]
Mini ng user similarity based on location history,
Q. Li, Y . Zheng, X. Xie, Y . Chen, W. Liu, and W.-Y . Ma, “Mini ng user similarity based on location history,” in Proceedings of the 16th ACM SIGSPATIAL international conference on Advances in geo graphic information systems . ACM, 2008, p. 34
work page 2008
Show all 21 references
-
[7]
M ap- matching for low-sampling-rate gps trajectories,
Y . Lou, C. Zhang, Y . Zheng, X. Xie, W. Wang, and Y . Huang, “M ap- matching for low-sampling-rate gps trajectories,” in Proceedings of the 17th ACM SIGSPATIAL international conference on advanc es in geographic information systems . ACM, 2009, pp. 352–361
2009
-
[8]
Learning motion patterns and anomaly detection by human tr ajectory analysis,
N. Suzuki, K. Hirasawa, K. Tanaka, Y . Kobayashi, Y . Sato, and Y . Fujino, “Learning motion patterns and anomaly detection by human tr ajectory analysis,” in Systems, Man and Cybernetics, 2007. ISIC. IEEE Interna- tional Conference on . IEEE, 2007, pp. 498–503
2007
-
[9]
Iodetector: A generic service for indoor outdoor detection,
P . Zhou, Y . Zheng, Z. Li, M. Li, and G. Shen, “Iodetector: A generic service for indoor outdoor detection,” in Proceedings of the 10th acm conference on embedded network sensor systems . ACM, 2012, pp. 113–126
2012
-
[10]
Extracting point of interest and clas sifying environment for low sampling crowd sensing smartphone sens or data,
B. P . L. Lau, M. S. Hasala, V . S. Kadaba, B. Thirunavukara su, C. Y uen, B. Y uen, and R. Nayak, “Extracting point of interest and clas sifying environment for low sampling crowd sensing smartphone sens or data,” in 2017 IEEE International Conference on Pervasive Computing a...
2017
-
[11]
Underst anding the lifestyle of older population: Mobile crowdsensing app roach,
S. H. Marakkalage, S. Sarica, B. P . L. Lau, S. K. Viswanat h, T. Bala- subramaniam, C. Y uen, B. Y uen, J. Luo, and R. Nayak, “Underst anding the lifestyle of older population: Mobile crowdsensing app roach,” IEEE Transactions on Computational Social Systems , 2018
2018
-
[12]
Crowdinside: automatic co nstruction of indoor floorplans,
M. Alzantot and M. Y oussef, “Crowdinside: automatic co nstruction of indoor floorplans,” in Proceedings of the 20th International Conference on Advances in Geographic Information Systems . ACM, 2012, pp. 99–108
2012
-
[14]
Crowd-sensing simultaneous localiza tion and radio fingerprint mapping based on probabilistic similarit y models,
R. Liu, S. H. Marakkalage, M. Padmal, T. Shaganan, C. Y ue n, Y . L. Guan, and U.-X. Tan, “Crowd-sensing simultaneous localiza tion and radio fingerprint mapping based on probabilistic similarit y models,” in Proceedings of the ION 2019 Pacific PNT Meeting , Honolulu, Hawaii, Ap...
2019
-
[16]
Mobile crowdsensing: cur rent state and future challenges,
R. K. Ganti, F. Y e, and H. Lei, “Mobile crowdsensing: cur rent state and future challenges,” IEEE Communications Magazine , vol. 49, no. 11, 2011
2011
-
[17]
A survey of data fusion in smart city applications,
B. P . L. Lau, S. H. Marakkalage, Y . Zhou, N. U. Hassan, C. Y uen, M. Zhang, and U.-X. Tan, “A survey of data fusion in smart city applications,” Information Fusion , vol. 52, pp. 357–374, 2019
2019
-
[18]
Wi-Fi Scanning,
Google, “Wi-Fi Scanning,” https://goo.gl/RqxNk2, 20 18, [Online; ac- cessed 01-November-2018]
2018
-
[19]
gzip, “gzip,” https://www.gzip.org, [Online; access ed 03-November- 2018]
2018
-
[20]
A density-based algorithm for discovering clusters in large spatial databa ses with noise
M. Ester, H.-P . Kriegel, J. Sander, X. Xu, et al. , “A density-based algorithm for discovering clusters in large spatial databa ses with noise.” in Kdd, vol. 96, no. 34, 1996, pp. 226–231
1996
-
[21]
Fast unfolding of communities in large networks,
V . D. Blondel, J.-L. Guillaume, R. Lambiotte, and E. Lef ebvre, “Fast unfolding of communities in large networks,” Journal of statistical mechanics: theory and experiment , vol. 2008, no. 10, p. P10008, 2008
2008
Reviewed August 14, 2026 · model on record in the stance chip above.
Discussion (0). Continue with ORCID to comment.