REVIEW 3 major objections 5 minor 53 references
Optimal Heterogeneous Asset Location Modeling for Expected Spatiotemporal Search and Rescue Demands using Historic Event Data
T0 review · 3 major / 5 minor · reviewed 2026-08-14 · deepseek-v4-flash
Pith's one-line read The paper claims that a two-stage model using 7.5 years of Coast Guard records can cut expected search-and-rescue response time by 9.6–17.6% under current bases and by 57.4–67.3% when Pacific ports and airports are eligible.
desk verdict A competent applied OR case study whose headline response-time gains are real inside the model but not yet established for the true event distribution, due to centroid aggregation and in-sample evaluation. read the letter →
The pith
A machine-rendered reading of the paper's core claim, the machinery that carries it, and where it could break.
The reading
What carries the argument
The load-bearing mechanism is the pairing of the stochastic zonal distribution model with a heterogeneous-asset, p-median-style location-allocation integer linear program. The first stage constructs 15 demand zones from historical records, assigns each zone a weighted centroid—the superaccident site—for distance calculations, fits Gamma-Poisson or Poisson distributions to monthly event counts, and converts observed response strategies into per-zone demand levels for boats, cutters, helicopters, and airplanes. The second stage minimizes a weighted sum of asset relocation time and expected deployment time, subject to each asset being assigned to exactly one compatible homeport, utilization limits, and demand-coverage constraints. The superaccident centroids are the key device that turns sparse, scattered incident points into a tractable set of demand nodes for optimization.
What would settle it
Hold out the most recent two years of the same incident data, fix the optimized homeport assignments from the paper's Table 7, and compute realized response times for those later events using the same haversine distances; if the realized average is not close to the model's projected improvement over the current-basing counterpart, the centroid-aggregation or future-representativeness assumptions fail.
Extended reading notes
Core claim
The central claim is that search-and-rescue demand for Coast Guard District 14 can be represented by a stochastic zonal distribution model—15 zones formed by clustering historical incidents, each with a weighted superaccident center, a Gamma-Poisson or Poisson monthly event count, and empirical probabilities over response strategies—and that the resulting forecasts can parameterize an integer linear program that chooses optimal homeports for a heterogeneous fleet. Solving that program for both the 50th and 75th percentile demand levels produces asset location strategies that reduce expected total deployment time by 9.6% and 17.6% when only current homeports and airports are allowed, and by 67.3% and 57.4% when the full set of 50 Pacific-region ports and airports is considered. The paper further claims that these location solutions are insensitive to the choice of demand percentile: fixing the 50th-percentile locations and evaluating them under 75th-percentile demand gives the same expected response time as designing directly for the higher demand level.
Load-bearing premise
The whole analysis rests on the historical Coast Guard records from December 2010 through May 2018 being a reliable guide to where, when, and with what assets future SAR events will occur, and on each zone's scattered event locations being representable by a single weighted center point for travel-time calculations.
Editorial extensions
If this is right
- If the estimates hold, the Coast Guard can reduce expected SAR response time by roughly 10–18% without opening new bases, simply by reallocating its existing 21 assets among the six current homeports.
- Allowing Pacific-region ports and airports as candidate bases expands the improvement to about 57–67%, suggesting a large strategic payoff from opening or using additional locations.
- The Pareto frontier produced by varying the weights on relocation cost versus response time gives decision makers a menu of trade-offs rather than a single dictated move.
- Because the optimal locations were nearly identical under 50th and 75th percentile demand, the stationing plan appears stable across normal and elevated operational tempos.
- The two-stage structure can be transferred to other Coast Guard districts or other emergency-response fleets that have historical incident records and a defined asset inventory.
Reading between the lines
- Beyond the paper's own results, the model implies that the 67.3% and 57.4% figures are upper bounds only within the 50 candidate locations; adding more eligible ports and airports could yield further response-time gains, though with diminishing returns.
- An unstated testable extension is to hold out the most recent years of incident data, fix the optimized homeport assignments, and compare realized response times against the current-basing baseline; this would directly validate whether the centroid aggregation preserves the true spatial distribution of demand.
- The paper's relative insensitivity to demand percentile suggests that the dominant driver of good stationing is geography, not event frequency, which would make the approach useful in regions where total demand volume is uncertain but spatial patterns are stable.
- A practical implication the paper leaves implicit is that the model's optimized solution may concentrate assets at a few hubs, which could create single-point-of-failure risks for maintenance, staffing, and weather disruptions that the utilization constraints do not capture.
Signed reviews
Editorial analysis
A structured set of objections, weighed in public.
Referee Report
Summary. This paper develops a two-stage model for positioning heterogeneous USCG search-and-rescue assets in District 14. Stage 1 clusters historical MISLE SAR events into 15 zones, fits Poisson/Gamma-Poisson monthly demand models to each zone, estimates response-strategy probabilities, and Monte Carlo simulates demand percentiles. Stage 2 solves a bi-objective integer linear program that minimizes total asset relocation time and expected deployment time for boats, cutters, airplanes, and helicopters over candidate homeports, subject to asset-location compatibility and monthly utilization constraints. Applying the model to December 2010 through May 2018 MISLE data, the authors report expected response-time reductions over current basing of 9.6% and 17.6% when restricted to current homeports and of 67.3% and 57.4% when expanded Pacific-region ports and airports are allowed, at the 50th and 75th percentile demand levels respectively.
Significance. If validated, the paper would provide a useful, data-driven decision aid for USCG District 14 and a meaningful extension of p-median/heterogeneous-fleet location modeling to maritime SAR. The manuscript has clear strengths: careful data cleaning, explicit autocorrelation checks for stationarity, Pearson goodness-of-fit tests for the demand distributions, a defensible Gamma-Poisson mixture treatment for non-stationary zones, and a transparent ILP with realistic constraints on incompatible asset-location pairs and monthly utilization. The formulation is reproducible in principle, although no code or data are provided. However, the headline improvement percentages are in-sample estimates computed against 15 zone centroids rather than the true event distribution, and the numbers in Table 7 are not fully self-consistent. These issues are load-bearing for the central claim, so the work needs additional validation before the quantitative conclusions can be accepted.
major comments (3)
- [Section 2.1, Table 2; Section 3.3, Eq. (3)] The objective f2(y) is computed entirely with respect to the 15 weighted superaccident centroids, not the actual spatial distribution of SAR events. The optimization is therefore a p-median problem on 15 point demands, and the reported improvements in Table 7 measure expected deployment time to centroids. In large open-ocean zones (e.g., Hawaii-10 through Hawaii-14), real events may be far from the weighted centroid, and moving assets toward the centroid can improve the surrogate objective without improving actual response times. No within-zone dispersion statistics or centroid-sensitivity analysis are reported. To substantiate the headline percentages, please report event-to-centroid distance summaries by zone, re-evaluate f2 on the full set of 3,949 historical event locations for both current and optimized basings, and test how much the optimal locations and objective values change under moderate perturbations of the centroid coordinates.
- [Sections 3.1–3.3] The demand distributions, response-strategy probabilities, and Monte Carlo demand percentiles are all fitted to the same December 2010–May 2018 MISLE records, and the optimization in Table 7 is solved and evaluated on those same fitted demands. The improvement percentages are thus in-sample estimates of the model objective, not out-of-sample predictions of operational response time. I do not regard this as circularity, since the asset locations are genuine optimization outputs rather than inputs to the demand model, but it is a generalization risk because locations chosen to minimize f2 on the fitted distribution will tend to look better on that distribution than on future data. Please add a temporal holdout or chronological cross-validation: calibrate on an early subset of the data, optimize the asset locations, and report f2 on the held-out period for both current and optimized basings, together with confidence intervals for the improvement.
- [Section 3.3, Table 7; Abstract] The headline improvement percentages do not follow exactly from Table 7 as printed. For the 75th percentile/current-homeports case, the table gives (667.5−553.3)/667.5 = 17.1%, not 17.6%. For the expanded Pacific-region case, the 57.4% figure is obtained only when the denominator is the Pacific-column preemptive-f1 value 677.5; if the baseline is the current-basing f2 of 667.5, the improvement is 56.8%. Moreover, with (w1,w2)=(1−δ,δ) all assets remain at their current homeports, so the Current and Pacific columns should yield the same minimal f2; they agree at the 50th percentile (both 118.2) but differ at the 75th percentile (667.5 vs 677.5). Please reconcile these discrepancies and restate the reported improvements consistently with the table.
minor comments (5)
- [Abstract and Section 4] The text describes the results as 'increases in coverage,' but the objective being reduced is total expected deployment time; coverage is not defined or measured in the model. Please rephrase, for example as 'reductions in expected response time.'
- [Section 2.2, Eqs. (3) and (8)] The objective f2 sums one-way deployment times, whereas the utilization constraint (8) uses round-trip travel time 2dhij+t. The paper should state explicitly that f2 is a one-way expected response-time surrogate and explain why the utilization constraint uses the round-trip time.
- [Table 3] The text states that only five clusters exhibit |rk|>0.1 at the 12-month lag, but the table also shows 24-month lag values above 0.1 (Guam-6 at 0.1627 and Hawaii-14 at 0.2372). Please clarify whether the stationarity conclusion considers these values or explain the criterion used.
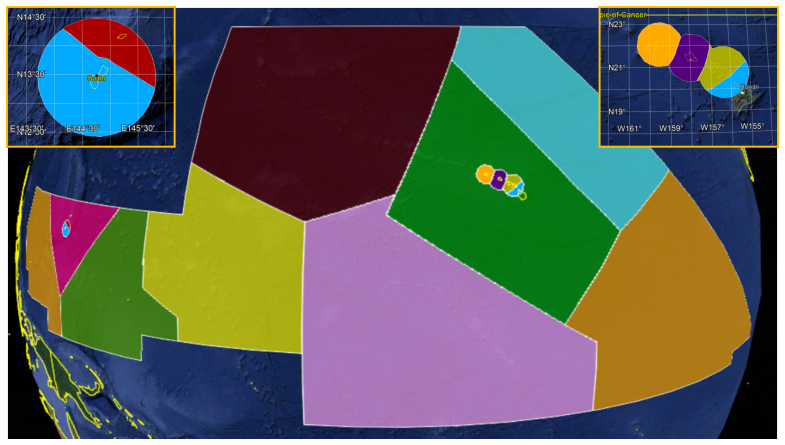
- [Figure 2] The figure is described as showing zone boundaries, but those boundaries are not visible in the reproduction; please provide a version with clearly delineated zone polygons and labeled superaccident locations.
- [Throughout] The manuscript does not include a data or code availability statement. Since the MISLE data are proprietary, please at least specify what derived data (cluster memberships, fitted parameters, candidate site coordinates) would be made available to facilitate replication.
Circularity Check
No significant circularity: the optimized asset locations and reported response-time improvements are genuine outputs of the model, not fitted inputs or renamed assumptions.
full rationale
The paper's derivation chain is not circular. Stage 1 estimates zonal demand distributions and response-strategy probabilities from 3,949 historical MISLE SAR records and uses Monte Carlo simulation to obtain 50th and 75th percentile demand levels. Stage 2 takes those fitted demand levels as fixed parameters in an integer linear programming p-median-style location model. The reported improvements in Table 7 compare f2 values obtained by solving the same model over different feasible-basing sets—current homeports versus Pacific-region ports and airports—under identical demand nodes and demand levels. Thus the optimized asset locations are outputs, not inputs, and the improvement percentages are not defined in terms of themselves. The baseline and alternative solutions are computed under a common demand model, so the comparison is a conditional model-based estimate rather than a circular reduction. The paper's reliance on prior methodological work such as Azofra et al. and Razi and Karatas is external and does not smuggle in the conclusion; there are no load-bearing self-citations. The centroid-aggregation concern is a real external-validity limitation—the f2 values are computed from 15 weighted superaccident centroids rather than the full spatial distribution of events—but that is a data-representation and robustness issue, not circularity, because no equation used to compute f2 is equivalent by construction to the model's own inputs. The abstract's phrase 'increase in coverage' is also a wording mismatch for a reduction in expected response time, but it does not make the derivation circular.
Assumptions & free parameters
free parameters (8)
- Number of zones (clusters) per category =
15 total (6 boat/helicopter, 9 cutter/airplane)
- Gamma-Poisson shape and scale parameters (alpha, beta) per zone =
e.g., Guam-0 alpha=52.748, beta=0.103; see Table 4
- Poisson rates (lambda) for Hawaii-2 and Hawaii-13 =
6.256 and 0.833
- Response strategy probabilities per zone =
Empirical proportions (Table 5) and conditional response volumes
- Cap on response assets =
4 maritime, 2 aeronautical
- On-scene mission duration t =
1.5 hours constant
- Demand percentile levels =
50th and 75th
- Boat/helicopter zone radius =
50 nautical miles around boat-station islands
assumptions (5)
- domain assumption Historical SAR data (Dec 2010-May 2018) is representative of future SAR demand.
- domain assumption SAR event counts follow Poisson or Gamma-Poisson processes with independence and (mostly) stationarity.
- domain assumption Each zone's demand can be represented at a single weighted centroid (superaccident) for deployment distance calculations.
- domain assumption Haversine distance on a spherical Earth approximates asset travel distance, neglecting routing around islands, traffic, weather.
- domain assumption Assets travel at maximum cruise speed and are used within monthly hour allocations u_h.
Cite this review
Pith. "Pith review of Optimal Heterogeneous Asset Location Modeling for Expected Spatiotemporal Search and Rescue Demands using Historic Event Data." pith.science (2026). https://pith.science/paper/VVWBLCMM
@misc{pith2026190808970,
  author       = {Pith},
  title        = {Pith review of: Optimal Heterogeneous Asset Location Modeling for Expected Spatiotemporal Search and Rescue Demands using Historic Event Data},
  year         = {2026},
  howpublished = {\url{https://pith.science/paper/VVWBLCMM}},
  note         = {Machine review of arXiv:1908.08970}
}
read the original abstract
The United States Coast Guard is charged with the coordination of all search and rescue missions in maritime regions within the United States purview. Given the size of the Pacific Ocean and the limited resources available to respond to search and rescue missions in this region, the service seeks to posture its aligned fleet of maritime and aeronautical assets to reduce the expected response time for such missions. Leveraging historic event records for the region of interest, we propose and demonstrate a two-stage solution approach. In the first stage, we develop and apply a stochastic zonal distribution model to evaluate spatiotemporal trends for emergency event rates and corresponding response strategies to inform the probabilistic modeling of future rescue events respective locations, frequencies, and demands for support. In the second stage, the results from the aforementioned analysis enable the parameterization and solution of a integer linear programming formulation to identify the best locations at which to station limited heterogeneous search and rescue assets. Considering both the 50th and 75th percentile levels of forecast event and asset demand distributions using 7.5 years of historical event data, our models identify asset location strategies that respectively yield a 9.6 percent and 17.6 percent increase in coverage over current asset basing when allowing locations among current homeports and airports, as well as respective 67.3 percent and 57.4 percent increases in coverage when considering a larger set of feasible basing locations. Keywords: search and rescue, spatiotemporal forecasting, location-allocation modeling, p-median location problem, multi-objective optimization
Figures
Reference graph
Works this paper leans on
-
[1]
National Search and Rescue Committee, United States National Search and Rescue Supple- ment to the International Aeronautical and Maritime Search and Rescue Manual, Version 2.0, https://www.dco.uscg.mil/Portals/9/CG-5R/nsarc/NSS_2018_Version/National%20SAR% 20Plan%202018.pdf, last visited on 09 April 2019 (2018)
work page 2018
-
[2]
United States Coast Guard, Archived Budgets, Posture Statements, and Supporting Documents, https://www.uscg.mil/Budget/Archive/, last visited on 09 April 2019 (2019)
work page 2019
-
[3]
United States Coast Guard, Posture Statement: 2018 Performance Highlights & 2020 Bud- get Overview, https://www.uscg.mil/Portals/0/documents/budget/FY2020_Budget_Overview_ Web.pdf, last visited on 09 April 2019 (2019)
work page 2019
-
[4]
L. Xie, Y. Gu, X. Zhu, M. G. Genton, Short-term spatio-temporal wind power forecast in robust look-ahead power system dispatch, IEEE Transactions on Smart Grid 5 (1) (2014) 511–520
work page 2014
- [5]
-
[6]
A. Tascikaraoglu, B. M. Sanandaji, G. Chicco, V. Cocina, F. Spertino, O. Erdinc, N. G. Paterakis, J. P. Catal˜ ao, Compressive spatio-temporal forecasting of meteorological quantities and photovoltaic power, IEEE Transactions on Sustainable Energy 7 (3) (2016) 1295–1305
work page 2016
-
[7]
S. Madadgar, H. Moradkhani, Spatio-temporal drought forecasting within bayesian networks, Jour- nal of Hydrology 512 (2014) 134–146. 20
work page 2014
-
[8]
S. Hashimoto, T. Matsuura, K. Nanko, I. Linkov, G. Shaw, S. Kaneko, Predicted spatio-temporal dynamics of radiocesium deposited onto forests following the fukushima nuclear accident, Scientific Reports 3 (2013) 1–5
work page 2013
Show all 53 references
-
[9]
Frihida, D
A. Frihida, D. J. Marceau, M. Theriault, Spatio-temporal object-oriented data model for disaggregate travel behavior, Transactions in GIS 6 (3) (2002) 277–294
2002
-
[10]
Sirvio, J
K. Sirvio, J. Hollm´ en, Spatio-temporal road condition forecasting with Markov chains and artificial neural networks, in: International Workshop on Hybrid Artificial Intelligence Systems, Springer, 2008, pp. 204–211
2008
-
[11]
Zhang, Y
J. Zhang, Y. Zheng, D. Qi, Deep spatio-temporal residual networks for citywide crowd flows predic- tion, in: Thirty-First AAAI Conference on Artificial Intelligence, AAAI, 2017, pp. 1–7
2017
-
[12]
Gholami, B
S. Gholami, B. Ford, F. Fang, A. Plumptre, M. Tambe, M. Driciru, F. Wanyama, A. Rwetsiba, M. Nsubaga, J. Mabonga, Taking it for a test drive: a hybrid spatio-temporal model for wildlife poaching prediction evaluated through a controlled field test, in: Joint European Conference...
2017
-
[13]
Soldo, A
F. Soldo, A. Le, A. Markopoulou, Blacklisting recommendation system: using spatio-temporal pat- terns to predict future attacks, IEEE Journal on Selected Areas in Communications 29 (7) (2011) 1423–1437
2011
-
[14]
X. Wang, D. E. Brown, The spatio-temporal generalized additive model for criminal incidents, in: Proceedings of 2011 IEEE International Conference on Intelligence and Security Informatics, IEEE, 2011, pp. 42–47
2011
-
[15]
X. Wang, D. E. Brown, The spatio-temporal modeling for criminal incidents, Security Informatics 1 (1) (2012) 1–17
2012
-
[16]
X. Wang, D. E. Brown, M. S. Gerber, Spatio-temporal modeling of criminal incidents using geo- graphic, demographic, and twitter-derived information, in: 2012 IEEE International Conference on Intelligence and Security Informatics, IEEE, 2012, pp. 36–41
2012
-
[17]
Benigni, R
M. Benigni, R. Furrer, Spatio-temporal improvised explosive device monitoring: improving detection to minimise attacks, Journal of Applied Statistics 39 (11) (2012) 2493–2508
2012
-
[18]
Prasannakumar, H
V. Prasannakumar, H. Vijith, R. Charutha, N. Geetha, Spatio-temporal clustering of road accidents: Gis based analysis and assessment, Procedia-Social and Behavioral Sciences 21 (2011) 317–325
2011
-
[19]
Marchione, S
E. Marchione, S. D. Johnson, Spatial, temporal and spatio-temporal patterns of maritime piracy, Journal of Research in Crime and Delinquency 50 (4) (2013) 504–524
2013
-
[20]
Afshartous, Y
D. Afshartous, Y. Guan, A. Mehrotra, US Coast Guard air station location with respect to distress calls: A spatial statistics and optimization based methodology, European Journal of Operational Research 196 (3) (2009) 1086–1096. 21
2009
-
[21]
Akbari, R
A. Akbari, R. Pelot, H. A. Eiselt, A modular capacitated multi-objective model for locating maritime search and rescue vessels, Annals of Operations Research (2017) 1–26
2017
-
[22]
Karatas, N
M. Karatas, N. Razi, M. M. Gunal, An ILP and simulation model to optimize search and rescue helicopter operations, Journal of the Operational Research Society 68 (11) (2017) 1335–1351
2017
-
[23]
Azofra, C
M. Azofra, C. P´ erez-Labajos, B. Blanco, J. Achutegui, Optimum placement of sea rescue resources, Safety Science 45 (9) (2007) 941–951
2007
-
[24]
Y. Ai, J. Lu, L. Zhang, The optimization model for the location of maritime emergency supplies reserve bases and the configuration of salvage vessels, Transportation Research Part E: Logistics and Transportation Review 83 (2015) 170–188
2015
-
[25]
N. Razi, M. Karatas, A multi-objective model for locating search and rescue boats, European Journal of Operational Research 254 (1) (2016) 279–293
2016
-
[26]
Toregas, R
C. Toregas, R. Swain, C. ReVelle, L. Bergman, The location of emergency service facilities, Opera- tions Research 19 (6) (1971) 1363–1373
1971
-
[27]
Church, C
R. Church, C. S. ReVelle, The maximal covering location problem, Papers in Regional Science 32 (1) (1974) 101–118
1974
-
[28]
M. S. Daskin, E. H. Stern, A hierarchical objective set covering model for emergency medical service vehicle deployment, Transportation Science 15 (2) (1981) 137–152
1981
-
[29]
W. K. Hall, The application of multifunction stochastic service systems in allocating ambulances to an urban area, Operations Research 20 (3) (1972) 558–570
1972
-
[30]
G. N. Berlin, J. C. Liebman, Mathematical analysis of emergency ambulance location, Socio- Economic Planning Sciences 8 (6) (1974) 323–328
1974
-
[31]
J. R. Baker, E. R. Clayton, B. W. Taylor, A non-linear multi-criteria programming approach for determining county emergency medical service ambulance allocations, Journal of the Operational Research Society 40 (5) (1989) 423–432
1989
-
[32]
Berman, R
O. Berman, R. Huang, S. Kim, M. B. Menezes, Locating capacitated facilities to maximize captured demand, IIE Transactions 39 (11) (2007) 1015–1029
2007
-
[33]
Q. Wang, R. Batta, C. M. Rump, Algorithms for a facility location problem with stochastic customer demand and immobile servers, Annals of operations Research 111 (1-4) (2002) 17–34
2002
-
[34]
L. V. Snyder, M. S. Daskin, C.-P. Teo, The stochastic location model with risk pooling, European Journal of Operational Research 179 (3) (2007) 1221–1238
2007
-
[35]
M. S. Daskin, K. Hogan, C. ReVelle, Integration of multiple, excess, backup, and expected covering models, Environment and Planning B: Planning and Design 15 (1) (1988) 15–35. 22
1988
-
[36]
Batta, N
R. Batta, N. R. Mannur, Covering-location models for emergency situations that require multiple response units, Management science 36 (1) (1990) 16–23
1990
-
[37]
J. C. Teixeira, A. P. Antunes, A hierarchical location model for public facility planning, European Journal of Operational Research 185 (1) (2008) 92–104
2008
-
[38]
L. V. Snyder, Facility location under uncertainty: a review, IIE Transactions 38 (7) (2006) 547–564
2006
-
[39]
L. A. McLay, A maximum expected covering location model with two types of servers, IIE Transac- tions 41 (8) (2009) 730–741
2009
-
[40]
H. Jia, F. Ord´ o˜ nez, M. Dessouky, A modeling framework for facility location of medical services for large-scale emergencies, IIE Transactions 39 (1) (2007) 41–55
2007
-
[41]
R. Z. Farahani, N. Asgari, N. Heidari, M. Hosseininia, M. Goh, Covering problems in facility location: A review, Computers & Industrial Engineering 62 (1) (2012) 368–407
2012
-
[42]
Drezner, H
Z. Drezner, H. W. Hamacher, Facility location: applications and theory, Springer Science & Business Media, New York, New York, 2001
2001
-
[43]
M. S. Daskin, Network and discrete location: models, algorithms, and applications, John Wiley & Sons, Hoboken, New Jersey, 2011
2011
-
[44]
Laporte, S
G. Laporte, S. Nickel, F. S. da Gama, Location science, Springer, New York, New York, 2015
2015
-
[45]
R. L. Church, A. Murray, Location covering models: History, applications and advancements, Springer, New York, New York, 2018
2018
-
[46]
Aringhieri, M
R. Aringhieri, M. E. Bruni, S. Khodaparasti, J. Van Essen, Emergency medical services and beyond: Addressing new challenges through a wide literature review, Computers & Operations Research 78 (2017) 349–368
2017
-
[47]
Gholami-Zanjani, M
S. Gholami-Zanjani, M. Pishvaee, S. A. Torabi, OR models for emergency medical service (EMS) management, in: Operations Research Applications in Health Care Management, Springer, 2018, pp. 395–421
2018
-
[48]
B´ elanger, A
V. B´ elanger, A. Ruiz, P. Soriano, Recent optimization models and trends in location, relocation, and dispatching of emergency medical vehicles, European Journal of Operational Research 272 (1) (2019) 1–23
2019
-
[49]
M. R. Wagner, Z. Radovilsky, Optimizing boat resources at the US Coast Guard: Deterministic and stochastic models, Operations Research 60 (5) (2012) 1035–1049
2012
-
[50]
Ehrgott, Multicriteria optimization, Springer Science & Business Media, New York, New York, 2005
M. Ehrgott, Multicriteria optimization, Springer Science & Business Media, New York, New York, 2005
2005
-
[51]
United States Coast Guard District 14, CGD14INST M16130.1A - Fourteenth Coast Guard District search and rescue plan (2014). 23
2014
-
[52]
Arthur, S
D. Arthur, S. Vassilvitskii, k-means++: The advantages of careful seeding, in: Proceedings of the Eighteenth Annual ACM-SIAM Symposium on Discrete Algorithms, Society for Industrial and Applied Mathematics, 2007, pp. 1027–1035
2007
-
[53]
S. M. Ross, Introduction to probability models, Academic press, Boston, Massachusetts, 2014. 24
2014
Reviewed August 14, 2026 · model on record in the stance chip above.
Discussion (0). Continue with ORCID to comment.