REVIEW 4 major objections 5 minor 33 references
Griffon: Reasoning about Job Anomalies with Unlabeled Data in Cloud-based Platforms
T0 review · 4 major / 5 minor · reviewed 2026-08-14 · deepseek-v4-flash
Pith's one-line read This paper claims that an interpretable random forest trained to predict job runtime can rank the causes of job slowdowns without labeled incident data, and that its rankings match expert-validated diagnoses in a production analytics…
desk verdict Griffin is a plausible, well-engineered system for ranking slowdown causes without labels, but the central causal claim rests on a thin validation set and an unexamined attribution assumption. read the letter →
The pith
A machine-rendered reading of the paper's core claim, the machinery that carries it, and where it could break.
The reading
What carries the argument
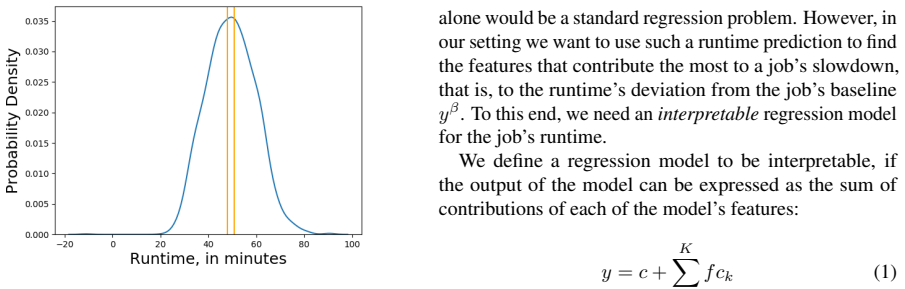
The load-bearing mechanism is the delta-feature-contribution decomposition of a random-forest prediction. Along one tree, each split on feature $x_k$ at node $m$ contributes $(\bar{y}_{m,j} - \bar{y}_{m-1,j})$ to the prediction, and summing these along the root-to-leaf path makes the tree's prediction a constant plus the sum of per-feature contributions; averaging over all $J$ trees preserves the additive form $y = c + \sum_k f_c^k$. Griffin applies the same decomposition to a baseline job's features and subtracts, so the gap between a slowed job's predicted runtime and the baseline predicted runtime equals the sum of per-feature deltas. Since the model predicts baseline runtimes with a mean absolute ratio error of about 2.2%, that gap is treated as the slowdown itself, and the ranking of positive deltas is the system's output.
What would settle it
A controlled experiment on historical incidents would settle it: take a slowdown whose cause engineers confirmed, hold the accused feature at its baseline value while leaving other features unchanged, and see whether Griffin's ranking still names it; alternatively, add a synthetic feature highly correlated with the true cause and check whether it displaces the true cause. If the top-ranked reason follows the model's feature usage rather than the known cause, the attribution is not causal.
Extended reading notes
Core claim
Griffin's central claim is that the feature attributions of an accurate, interpretable runtime model are a usable ranking of why a specific job slowed down. Given a slow job with features $x$ and a template baseline $x_\beta$, the paper uses the tree-interpreter decomposition of a random forest, which writes any prediction as $y = c + \sum_k f_c^k$, and subtracts the baseline decomposition to obtain $y - y'_\beta = \sum_k \Delta f_c^k$, where $\Delta f_c^k = f_c^k - f_c^{\beta,k}$. The features with the largest positive deltas are presented as the ranked reasons for the slowdown, with a confidence level that combines the model's relative prediction error with the spread of individual tree predictions. The paper argues that, on the evaluated historical incidents, these rankings correlate with causes manually validated by domain-expert engineers, including for job templates the model never trained on, and that no high-confidence prediction in this set was misleading.
Load-bearing premise
The ranking is assumed to reflect the true cause of the slowdown: Griffin treats the random forest's per-feature split contributions as causal deltas, so the features whose predicted contribution to runtime changed most are declared the reasons; with correlated features, the model can assign shared signal to the wrong one.
Editorial extensions
If this is right
- A user who sees a slowdown can get a ranked list of likely causes immediately from a job ID, so user-induced slowdowns (for example, increased data written) can be closed without system-administrator investigation.
- A global model trained over many job templates can reason about jobs from templates it has never seen, as demonstrated by the out-of-template jobs in the validation set.
- A low-confidence prediction still narrows the investigation: it rules out the monitored features and tells the engineer where not to look.
- Because no labels are required, years of historical telemetry become usable for training, removing the labeling bottleneck that limits earlier anomaly-reasoning approaches.
- The same additive-decomposition recipe transfers to other regression problems with a natural baseline, as shown on an automobile gas-mileage dataset where it explains why one car gets better mileage than its peers.
Reading between the lines
- The recipe should transfer to any recurring workload with a stable baseline and rich telemetry—database queries, serverless invocations, or ML training runs—where a job template and an expected runtime can be defined.
- The paper does not compare its attribution against simpler baselines such as raw feature deviations from baseline or linear-model coefficients; such a comparison would show whether the random-forest decomposition adds diagnostic power beyond reporting which features changed.
- If the rankings are reliable, they could be fed directly to an autotuner that adjusts parallelism, data layout, or queueing parameters when a cause is identified, moving from diagnosis to automatic remediation—a direction the conclusion gestures toward but does not implement.
- The confidence levels are calibrated on validation data, so a mature deployment should track whether high-confidence predictions continue to match engineer-confirmed causes over time as jobs and clusters evolve.
Signed reviews
Editorial analysis
A structured set of objections, weighed in public.
Referee Report
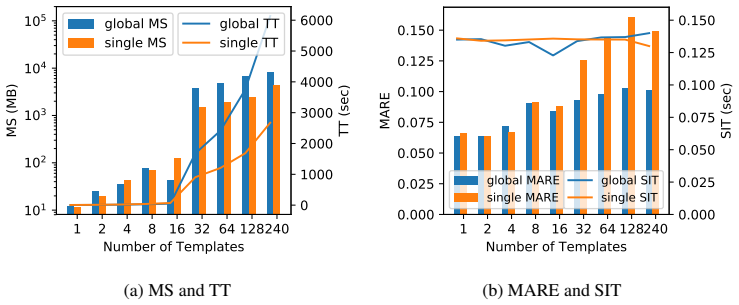
Summary. The paper presents Griffin, a system deployed in Microsoft's production analytics clusters that aims to automatically rank the potential causes of recurring job slowdowns without using labeled incident data. The system trains a random forest to predict job runtime from job-, machine-, and cluster-level features, then uses TreeInterpreter to decompose each prediction into per-feature contributions relative to a baseline computed from similar historical runs. The contributions are ranked and presented to users with a high/medium/low confidence level. The evaluation in Section 7 compares random forest against linear, gradient-boosted, and deep models using MARE, studies scalability of a global versus per-template model, reports agreement with engineer-validated causes on eight historical incidents, and gives an out-of-domain illustration using the Auto gas-mileage dataset.
Significance. If validated, Griffin would be a practically valuable contribution: it is a production anomaly-reasoning system that avoids labeled data, takes a job-centric rather than machine-centric view, and is built on a formal interpretability decomposition (Eqs. 1-3). Strengths of the paper include the explicit problem formalization, the MARE evaluation of model families (Table 3), the demonstration that a global model generalizes to unseen job templates (Section 7.3, jobs 6-8 in Table 2), and the concrete deployment description (Section 6). The paper is also honest about acknowledged limitations, notably the job-3 mismatch in Table 2. However, the central claim that the emitted feature ranking identifies actual slowdown causes is not yet supported by the evidence: the causal interpretation of the TreeInterpreter decomposition is an assumption, the validation set is tiny and lacks a quantitative agreement metric, and no baseline attribution method is compared. The contribution is therefore promising but currently conditional.
major comments (4)
- [Section 7.1, Table 2] The central claim that Griffin's reasons are "highly correlated" with expert-validated reasons rests on only eight incidents, of which one is an acknowledged miss (job 3), two are top-5 rather than top-1 agreements (jobs 2 and 4), and none are accompanied by a quantitative agreement metric such as top-1/top-k hit rate, rank correlation, or an inter-rater reliability measure. The text summarizes this small sample as "highly correlated," which overstates the evidence. The authors should report a precise agreement metric with uncertainty bounds, compare against a simple baseline such as ranking raw feature deviations from the baseline (without any trained model), and ideally validate on a larger incident corpus or with multiple expert raters.
- [Section 4.2-4.3, Eq. (3) and (9)] The decomposition in Eq. (3) is an algebraic identity for the trained random forest, not a causal attribution: TreeInterpreter distributes predictive signal along decision paths, and when features are correlated (Section 5.2 states that correlations up to 0.95 are deliberately retained), the per-feature contributions are non-unique across equally accurate forests or across alternative attribution methods. The paper never tests the stability of the resulting ranking under alternative attributions (e.g., SHAP, permutation-based importance, or leave-one-covariate analysis) nor compares against simpler feature-delta baselines. Because the system's output is a ranked list of causes, this gap is load-bearing; the observed expert agreement could be driven by the model's sensitivity to a dominant feature rather than by a valid causal ranking.
- [Section 4.4 and Table 2] The confidence thresholds t1, t2, and p are tuned on validation data and are then used post hoc to interpret the validation outcome: job 3's mismatch is attributed to "low confidence," while high- and medium-confidence cases are counted as successes. This creates a risk of circularity: if confidence is correlated with prediction error or with the chance of expert agreement, the reported agreement over the remaining cases may be optimistic. The paper should report agreement rates stratified by confidence level, and should explicitly state how many incidents would be excluded by a low-confidence flag before the "highly correlated" claim is made.
- [Section 5.2] The statement that "Griffin's tree-based models have an innate feature of being robust to correlated features" is not substantiated for the ranking task. Sections 7.2-7.4 evaluate prediction accuracy (MARE), but the ranking task is exactly where non-identifiability under correlation matters. A simple experiment with synthetic or shuffled correlated features, or retraining the forest with different random seeds to measure rank stability, would clarify whether the emitted ranking is robust or whether it reflects split-based contributions that could redistribute arbitrarily among correlated features.
minor comments (5)
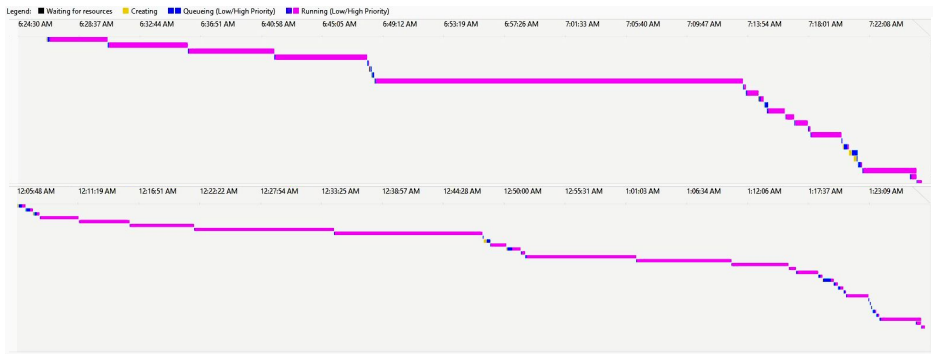
- [Figure 2] The caption reads "Two occurrences of the same job, broken down ." with a dangling phrase; it should be completed, e.g., "broken down by stage."
- [Table 2] The table uses placeholders R1 through R6 without defining them in the caption or text; the sentence "we use Rx variables for the rest" does not tell the reader what those reasons are. A legend or explicit list of the actual features is needed.
- [Section 4.2] The notation y_β (baseline runtime) and y'_β (model prediction on baseline features) is confusing; the text says "the model prediction is very accurate" for baseline jobs and then uses y_β in Eq. (3) as if it were the actual baseline runtime, but Eq. (3) actually compares to y'_β. Please unify the notation and clarify which quantity Eq. (3) approximates.
- [Section 7.5] The Auto dataset illustration is anecdotal and has no ground-truth ranking against which to validate the delta contributions; it should be explicitly labeled as a demonstration of the mechanism rather than as additional validation of the cause-ranking claim.
- [Throughout] The system name appears as both "Griffin" (in the arXiv metadata) and "Griffin" (in the text); please unify the spelling, including the ligature.
Circularity Check
No circularity found: Griffin's attribution ranking is derived from a runtime-prediction model and validated against independent expert judgments, not from fitted cause labels.
full rationale
The paper's derivation chain is self-contained. Griffin first trains a random forest to predict job runtime from telemetry features; the TreeInterpreter decomposition (Eqs. 4-9) is an algebraic identity showing that the prediction difference equals the sum of per-feature delta contributions. This decomposition does not assume the cause labels it later claims to predict: the model is trained only on runtime and features, and the feature contributions are then ranked as candidate slowdown reasons. The empirical validation in Section 7.1 compares those ranked reasons against independently produced expert-validated causes on historical incidents, so the central claim of agreement is checked against an external benchmark rather than against the model's own training objective. Hyperparameters for the confidence thresholds are tuned on validation data, but this tuning does not force the expert-agreement outcome and is not presented as a prediction of the validated reasons. No load-bearing argument relies on a self-citation, and no fitted parameter is renamed as a prediction. The main limitation—that tree-based attribution reflects predictive signal rather than proven causation, especially with correlated features—is a modeling-assumption concern about validity, not a circularity in the derivation. Overall, the paper contains no step in which an output is equivalent to an input by construction.
Assumptions & free parameters
free parameters (4)
- Baseline percentile window =
45th-55th percentile
- Confidence thresholds t1, t2, p =
Not reported
- Random forest hyperparameters =
Not reported (selected via random grid search)
- Selected feature set =
Approximately 15 job-level plus a few machine and cluster features
assumptions (5)
- domain assumption Recurring job templates with stable runtime distributions exist in the workload.
- domain assumption The collected telemetry features include the factors that actually cause slowdowns.
- standard math TreeInterpreter's additive decomposition is a valid way to attribute a prediction to features.
- domain assumption Expert-validated reasons are the correct ground truth for evaluation.
- domain assumption The model prediction error on baseline jobs is small enough for Eq. 3 to hold with y_beta replaced by y'_beta.
Cite this review
Pith. "Pith review of Griffon: Reasoning about Job Anomalies with Unlabeled Data in Cloud-based Platforms." pith.science (2026). https://pith.science/paper/EY4XLRQP
@misc{pith2026190809048,
  author       = {Pith},
  title        = {Pith review of: Griffon: Reasoning about Job Anomalies with Unlabeled Data in Cloud-based Platforms},
  year         = {2026},
  howpublished = {\url{https://pith.science/paper/EY4XLRQP}},
  note         = {Machine review of arXiv:1908.09048}
}
read the original abstract
Microsoft's internal big data analytics platform is comprised of hundreds of thousands of machines, serving over half a million jobs daily, from thousands of users. The majority of these jobs are recurring and are crucial for the company's operation. Although administrators spend significant effort tuning system performance, some jobs inevitably experience slowdowns, i.e., their execution time degrades over previous runs. Currently, the investigation of such slowdowns is a labor-intensive and error-prone process, which costs Microsoft significant human and machine resources, and negatively impacts several lines of businesses. In this work, we present Griffin, a system we built and have deployed in production last year to automatically discover the root cause of job slowdowns. Existing solutions either rely on labeled data (i.e., resolved incidents with labeled reasons for job slowdowns), which is in most cases non-existent or non-trivial to acquire, or on time-series analysis of individual metrics that do not target specific jobs holistically. In contrast, in Griffin we cast the problem to a corresponding regression one that predicts the runtime of a job, and show how the relative contributions of the features used to train our interpretable model can be exploited to rank the potential causes of job slowdowns. Evaluated over historical incidents, we show that Griffin discovers slowdown causes that are consistent with the ones validated by domain-expert engineers, in a fraction of the time required by them.
Figures


Figures from the paper (4 more)


Reference graph
Works this paper leans on
-
[1]
S. Agrawal and J. Agrawal. Survey on anomaly detection using data mining techniques. Procedia Computer Science, 60:708–713, 2015
work page 2015
-
[2]
M. K. Aguilera, J. C. Mogul, J. L. Wiener, P. Reynolds, and A. Muthitacharoen. Performance debugging for distributed systems of black boxes. In ACM SIGOPS Operating Sys- tems Review, volume 37, pages 74–89. ACM, 2003
work page 2003
-
[3]
K. Bhaduri, K. Das, and B. L. Matthews. Detecting ab- normal machine characteristics in cloud infrastructures. In 2011 IEEE 11th International Conference on Data Mining Workshops, pages 137–144. IEEE, 2011
work page 2011
-
[4]
V . Chandola, A. Banerjee, and V . Kumar. Anomaly de- tection: A survey. ACM Comput. Surv., 41:15:1–15:58, 2009
work page 2009
-
[5]
L. Cherkasova, K. Ozonat, N. Mi, J. Symons, and E. Smirni. Automated anomaly detection and performance modeling of enterprise applications. ACM Transactions on Computer Systems (TOCS), 27(3):6, 2009
work page 2009
-
[6]
R. Chitrakar and C. Huang. Anomaly based intrusion de- tection using hybrid learning approach of combining k- medoids clustering and naive bayes classification. In 2012 8th International Conference on Wireless Communications, Networking and Mobile Computing, pages 1–5. IEEE, 2012
work page 2012
- [7]
- [8]
Show all 33 references
-
[9]
Curino, S
C. Curino, S. Krishnan, K. Karanasos, S. Rao, G. M. Fu- marola, B. Huang, K. Chaliparambil, A. Suresh, Y . Chen, S. Heddaya, R. Burd, S. Sakalanaga, C. Douglas, B. Ram- sey, and R. Ramakrishnan. Hydra: a federated resource manager for data-center scale analytics. In NSDI, 2019
2019
-
[10]
D. J. Dean, H. Nguyen, and X. Gu. Ubl: Unsupervised behavior learning for predicting performance anomalies in virtualized cloud systems. In Proceedings of the 9th international conference on Autonomic computing, pages 191–200. ACM, 2012
2012
-
[11]
F. K. Do ˇsilovi´c, M. Br ˇci´c, and N. Hlupi ´c. Explainable artificial intelligence: A survey. In 2018 41st International convention on information and communication technology, electronics and microelectronics (MIPRO) , pages 0210–
2018
-
[12]
S. Duan, S. Babu, and K. Munagala. Fa: A system for automating failure diagnosis. In 2009 IEEE 25th Interna- tional Conference on Data Engineering, pages 1012–1023. IEEE, 2009
2009
-
[13]
Flask - a python microframework
Flask. Flask - a python microframework. http:// flask.pocoo.org/, 2019
2019
-
[14]
Gu and H
X. Gu and H. Wang. Online anomaly prediction for robust cluster systems. In 2009 IEEE 25th International Confer- ence on Data Engineering, pages 1000–1011. IEEE, 2009
2009
-
[15]
D. Gunning. Explainable artificial intelligence (xai). De- fense Advanced Research Projects Agency (DARPA), nd Web, 2017
2017
-
[16]
S. A. Jyothi, C. Curino, I. Menache, S. M. Narayanamurthy, A. Tumanov, J. Yaniv, R. Mavlyutov, I. Goiri, S. Krishnan, J. Kulkarni, and S. Rao. Morpheus: Towards Automated SLOs for Enterprise Clusters. In OSDI, 2016
2016
-
[17]
T. Kohonen. Self-organizing maps, volume 30. Springer Science & Business Media, 2012
2012
-
[18]
https: //engineering.linkedin.com/blog/2018/ 10/an-introduction-to-ai-at-linkedin , 2019
An Introduction to AI at LinkedIn. https: //engineering.linkedin.com/blog/2018/ 10/an-introduction-to-ai-at-linkedin , 2019
2018
-
[19]
Meinshausen
N. Meinshausen. Quantile regression forests. Journal of Machine Learning Research, 7:983–999, 2006
2006
-
[20]
H. Mi, H. Wang, G. Yin, H. Cai, Q. Zhou, and T. Sun. Per- formance problems diagnosis in cloud computing systems by mining request trace logs. In 2012 IEEE Network Oper- ations and Management Symposium, pages 893–899. IEEE, 2012
2012
-
[21]
H. Mi, H. Wang, G. Yin, H. Cai, Q. Zhou, T. Sun, and Y . Zhou. Magnifier: Online detection of performance prob- lems in large-scale cloud computing systems. In 2011 IEEE International Conference on Services Computing , pages 418–425. IEEE, 2011
2011
-
[22]
Azure machine learning service - build, train, and deploy models from the cloud to the edge
Microsoft. Azure machine learning service - build, train, and deploy models from the cloud to the edge. https://azure.microsoft.com/en-us/ services/machine-learning-service/, 2019
2019
-
[23]
Mlflow - a platform for machine learning lifecycle
MLflow. Mlflow - a platform for machine learning lifecycle. https://github.com/mlflow/mlflow, 2019
2019
-
[24]
C. Modi, D. Patel, B. Borisaniya, H. Patel, A. Patel, and M. Rajarajan. A survey of intrusion detection techniques in cloud. Journal of network and computer applications , 36(1):42–57, 2013
2013
-
[25]
Nguyen, Y
H. Nguyen, Y . Tan, and X. Gu. Pal: Propagation-aware anomaly localization for cloud hosted distributed applica- tions. In Managing Large-scale Systems via the Analysis of System Logs and the Application of Machine Learning Techniques, page 1. ACM, 2011
2011
-
[26]
A. Saabas. Treeinterpreter. https://github.com/ andosa/treeinterpreter, 2018
2018
-
[27]
Samek, T
W. Samek, T. Wiegand, and K.-R. M¨uller. Explainable arti- ficial intelligence: Understanding, visualizing and interpret- ing deep learning models. arXiv preprint arXiv:1708.08296, 2017. 12
2017 arXiv
-
[28]
Y . Tan, X. Gu, and H. Wang. Adaptive system anomaly prediction for large-scale hosting infrastructures. In Pro- ceedings of the 29th ACM SIGACT-SIGOPS symposium on Principles of distributed computing, pages 173–182. ACM, 2010
2010
-
[29]
Y . Tan, H. Nguyen, Z. Shen, X. Gu, C. Venkatramani, and D. Rajan. Prepare: Predictive performance anomaly pre- vention for virtualized cloud systems. In 2012 IEEE 32nd International Conference on Distributed Computing Sys- tems, pages 285–294. IEEE, 2012
2012
-
[30]
https: //urlzs.com/J4Rk9, 2019
How Uber Organizes Around Machine Learning. https: //urlzs.com/J4Rk9, 2019
2019
-
[31]
S. H. Welling, H. H. Refsgaard, P. B. Brockhoff, and L. H. Clemmensen. Forest floor visualizations of random forests. arXiv preprint arXiv:1605.09196, 2016
2016 arXiv
-
[32]
Zhang, Y
Q. Zhang, Y . Wu, T. Huang, and Y . Zhu. An intelligent anomaly detection and reasoning scheme for vm live migra- tion via cloud data mining. In2013 IEEE 25th International Conference on Tools with Artificial Intelligence, pages 412–
-
[33]
J. Zhou, N. Bruno, M.-C. Wu, P.-˚A. Larson, R. Chaiken, and D. Shakib. SCOPE: parallel databases meet MapReduce. VLDB J., 21(5):611–636, 2012. 13
2012
Reviewed August 14, 2026 · model on record in the stance chip above.
Discussion (0). Continue with ORCID to comment.