REVIEW 4 major objections 7 minor 24 references
Network Dependency Index Stratified Subnetwork Analysis of Functional Connectomes: An application to autism
T0 review · 4 major / 7 minor · reviewed 2026-08-14 · deepseek-v4-flash
Pith's one-line read The network dependency index, a parameter-free measure of a node's contribution to network efficiency, extends to resting-state functional connectomes and places autism-related differences in high-importance subnetworks.
desk verdict A modest, honest application of the authors' own NDI framework to functional connectomes; the stability results hold up, but the ASD-difference claims need stronger statistics and individual-level validation. read the letter →
The pith
A machine-rendered reading of the paper's core claim, the machinery that carries it, and where it could break.
The reading
What carries the argument
The load-bearing object is the network dependency index (NDI), a per-node score defined as the mean loss in network efficiency—measured through information $I_{ij}=1/D_{ij}$, where $D$ comes from shortest-path distances on inverse connection weights—when that node is removed. Nodes with NDI zero form Tier 4; the remaining log-transformed scores are split into three further Tiers by a Gaussian mixture model with three components, with subnetwork boundaries at halfway points between centers. Tier labels are defined once on a group-averaged connectome (edges present in at least 90% of subjects, with weights averaged) and then transferred to each individual connectome, where Tier-specific transitivity and global efficiency are compared between groups. Stability is assessed with ranked-biased overlap, a similarity measure that weights agreement at the top of the importance ranking more heavily, and group differences are tested with rank-based tests.
What would settle it
Recompute NDI Tiers from each individual's own connectome and compare them with the group-derived labels; if subject-level Tier assignments disagree widely with group labels, or if the ASD-control differences in Tier 1 transitivity and efficiency disappear when Tiers are defined per subject, the central conclusion fails.
Extended reading notes
Core claim
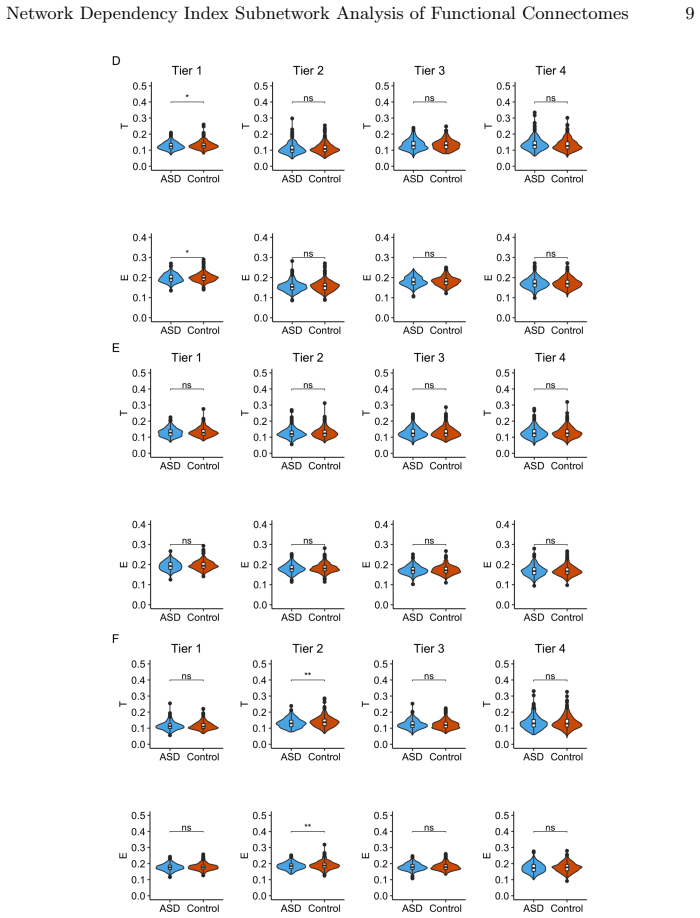
The central discovery is that the NDI subnetwork framework, originally validated on structural connectomes with 170 regions, transfers to functional connectomes with 90 regions and remains stable when the population used to construct the group connectome changes. On resting-state fMRI data from 819 participants (440 controls, 379 individuals with ASD), NDI scores and the Tier labels derived from a three-component Gaussian mixture model agreed across cohort, patient-only, and control-only group connectomes for every threshold and weighting combination tested; the choice of absolute versus positive edge weights moved node rankings more than the edge threshold (0.01, 0.03, or 0.05). When Tier labels from the control connectome were applied to individual connectomes, statistically significant ASD-control differences appeared in Tier 1 for absolute weights at all thresholds and in Tier 1 or Tier 2 for positive weights, supporting the claim that autism-related functional differences concentrate in nodes of highest NDI importance. The right median cingulate and paracingulate gyri was the only region identified across all thresholds and weighting schemes.
Load-bearing premise
The load-bearing premise is that Tier labels computed on group-averaged connectomes describe each individual's functional organization; if individual connectomes—especially in a heterogeneous ASD cohort collected across multiple sites—organize differently, group-level labels can misclassify regions and the reported group differences may be artifacts of mislabeling.
Editorial extensions
If this is right
- NDI subnetwork stratification is not limited to high-resolution structural connectomes: it works on resting-state functional connectomes parcellated into 90 regions, roughly half the resolution of the original 170-region structural study.
- Subnetwork labels are effectively invariant to whether the group connectome is built from the whole cohort, from patients only, or from controls only, with ranked-biased overlap differences below 0.005 across conditions.
- Edge threshold level changes NDI node rankings less than the choice of absolute versus positive edge weights, so threshold choice is a secondary source of variation.
- Applied to individuals, the group-defined tiers place ASD-control differences in transitivity and efficiency preferentially in Tier 1 (and Tier 2 for positive weights), localizing disease-related topology to the regions of highest NDI importance.
- The right median cingulate and paracingulate gyri emerges as the only region consistently in the significant tiers across all thresholds and weighting schemes, giving a candidate anatomical focus for follow-up.
Reading between the lines
- Editorial inference: the paper's transfer of group-level Tier labels to individuals assumes those labels represent each individual's functional organization; recomputing NDI per subject and measuring agreement with group labels would directly test this assumption, especially across the multi-site ASD sample.
- Editorial inference: because NDI needs no user-set parameter, the Tier framework could serve as a data-driven prior for region-of-interest analyses in other disorders, but only after validation across atlases and independent cohorts.
- Editorial inference: the paper compares only group-level labels; an individual-level strategy could reveal ASD subtypes with different hub profiles, a direction the authors explicitly leave to future work.
Signed reviews
Editorial analysis
A structured set of objections, weighed in public.
Referee Report
Summary. The paper applies the Network Dependency Index (NDI) subnetwork framework to resting-state functional connectomes from 819 ABIDE subjects (440 controls, 379 ASD), parcellated into 90 AAL regions. Group-averaged connectomes are constructed for the full cohort, control-only, and patient-only groups under three edge thresholds (0.01, 0.03, 0.05) and three weighting schemes (positive, negative, absolute); NDI scores are computed on each group connectome and Tier labels are assigned via a 3-component Gaussian mixture model on log-transformed NDI values. The authors compare NDI rankings across group connectomes with rank-biased overlap (RBO), report that rankings are highly stable, then apply control-derived Tier labels to individual connectomes to compare transitivity and efficiency between ASD and controls within each Tier. Significant group differences are reported in Tier 1 for absolute weights at all thresholds and in Tiers 1/2 for positive weights at selected thresholds. The conclusion is that NDI can be applied to functional connectomes, produces stable subnetworks across group compositions, and can reveal ASD-related differences concentrated in the most important nodes.
Significance. If the central claims were fully substantiated, the paper would extend a promising, largely parameter-free subnetwork stratification method from structural to functional connectomics and provide a practical tool for characterizing distributed disease effects. The study has notable strengths: a large multi-site ABIDE sample, systematic exploration of thresholds and weighting schemes, transparent reporting of a failure mode (negative-only weights), and use of a rank-based stability metric. However, the current analysis does not yet support the application claim: the ASD-control comparison relies on unadjusted Mann-Whitney tests across many combinations, the transfer of group-derived Tier labels to individuals is not validated, and potential ABIDE site effects are not controlled. These issues are fixable within the manuscript's scope, so the work is a plausible methods contribution rather than a definitive clinical finding.
major comments (4)
- [Section 2.5 and Figures 2-3] The ASD-versus-control comparisons consist of Mann-Whitney tests on transitivity and efficiency for four Tiers, three thresholds, and two retained weighting schemes, i.e., roughly 48 tests, with significance set at p<0.05 and no correction for multiple comparisons. The sparse pattern of significant results across Tiers and thresholds is consistent with what would be expected under the null, and no effect sizes or confidence intervals are reported. The conclusion that NDI Tiers "can be utilized to show group differences" is therefore not yet supported. Please apply an FDR or permutation-based correction across the full set of tests, pre-specify a primary Tier and measure, and report effect sizes.
- [Section 2.4 and Discussion] Tier labels are estimated on group-averaged connectomes (edges present in at least 90% of subjects, weights averaged) and then transferred to each individual's connectome to compute per-Tier transitivity and efficiency. The paper does not check whether the group Tier labels correspond to the high-NDI nodes of individual subjects; the RBO stability results in Table 2 concern only the rank ordering of the three group connectomes, not the match between group labels and individual topology. The Discussion explicitly defers individual-level NDI estimation to future work, which is an acknowledgment that this load-bearing assumption is unvalidated. If the NDI topology of ASD subjects deviates from the control-derived labels, the reported per-Tier group differences could be produced by mislabeled node sets rather than by true differences in the topology of important regions. Please validate the transfer, for example by computing individual NDI-based Tier assignments and reporting overlap with the group labels, or substantially soften the conclusion.
- [Section 3 and Table 1] The ASD-control comparisons do not account for ABIDE site, age, sex, head motion, or other confounders. ABIDE is a multi-site repository with well-documented site effects, and the cohort spans a wide age range (mean 16.4 years, SD 7.1), so the observed differences in Tier-specific measures could reflect site or motion differences rather than diagnosis. Please include site as a covariate (e.g., mixed-effects modeling or stratified within-site analysis) or demonstrate that the results are consistent across sites before claiming diagnostic group differences.
- [Sections 2.2-2.3 and Table 2] The stability claim "irrespective of the group connectome" is supported only for NDI rankings via RBO, not for the Tier stratification that is actually used in the subsequent analysis. Tier boundaries are determined by the fitted GMM centers, and two connectomes with nearly identical rankings can still yield different GMM fits and hence different node-to-Tier assignments. The paper does not report the number of nodes per Tier or the overlap of Tier assignments across the cohort, control, and patient connectomes. Without these values, the conclusion that the subnetworks themselves are stable across populations is overstated; please report them or restrict the claim to rank stability.
minor comments (7)
- [Section 1] There is a typo "afer" (should be "after") in the sentence "most subnetwork stratification, afer the brain network has been estimated," and the phrase "with respects to" should be "with respect to".
- [Abstract and Section 1] The text describes NDI as requiring "no user-parameter," but the framework fixes the number of Gaussian components at 3 and the results depend on the chosen edge threshold and weighting scheme. Please rephrase to something like "no user-selected subnetwork parameter" or explicitly acknowledge the remaining choices.
- [Section 2.4] It is unclear whether transitivity and efficiency are computed on the induced subgraph of each Tier or on the full network with the node set restricted to that Tier; please state the exact definition used.
- [Section 3] For the negative-weight networks, the paper reports that no Gaussian fit was possible but does not characterize why; reporting the range or distribution of NDI values for the neg networks would help readers judge whether the failure is technical or substantive.
- [Table 2] The RBO matrix is hard to read because the same value appears twice and the row and column labels mix threshold and weighting; consider presenting a single triangular matrix with combined labels such as "abs-0.01" and "pos-0.01".
- [Results text] The region names "cuneous" and "precuneous" should be "cuneus" and "precuneus," and "Mann-Whitney-Wilcox test" is more commonly called the Wilcoxon rank-sum test.
- [General] The manuscript does not state software versions (e.g., nilearn) or provide analysis code; a code/data availability statement would improve reproducibility.
Circularity Check
No significant circularity: the NDI framework is fully re-specified in the paper, and the group-to-individual Tier transfer is empirically justified by rank-stability results.
full rationale
The derivation chain is self-contained. The paper estimates group connectomes by retaining edges present in at least 90% of subjects and averaging weights, then computes NDI from a fully stated node-perturbation formula involving pairwise information measures (Section 2.3), assigns Tiers via a Gaussian Mixture Model on log-transformed NDI, and finally compares transitivity and efficiency within those Tiers between ASD and control subjects. No parameter is fitted to the ASD/control outcome and then re-predicted; the Tier labels are unsupervised functions of the connectome, not of diagnostic labels. The GMM choice (three Gaussians, half-way point boundaries) is stated in the paper rather than imported silently. The decision to use control-connectome Tier labels is justified in the Results by rank-biased overlap agreement across cohort, patient, and control connectomes (RBO differences below 0.005), so the labels are empirically group-invariant rather than control-specific by construction. The prior NDI publication [19] is cited for motivation and for structural-network stability, but the present NDI equations and the functional-connectome experiments are specified and executed in this paper, so the citation is not load-bearing. The Discussion's acknowledgment that individual-level NDI estimation is deferred to future work is an external-validity limitation about group-to-individual label transfer, not a circular reduction: the reported Tier 1/2 group differences are exactly the quantities computed from the stated pipeline. No circular step matching the enumerated patterns can be identified with quoted equations or construction-level equivalence.
Assumptions & free parameters
free parameters (4)
- Number of Gaussian components in GMM =
3
- Group edge presence threshold =
0.90
- Edge weight thresholds =
0.01, 0.03, 0.05
- Edge weighting schemes =
pos, neg, abs
assumptions (5)
- domain assumption NDI as defined in Schirmer et al. [19] is a valid measure of node importance and its Tier stratification is meaningful.
- domain assumption The AAL 90-region parcellation is an appropriate definition of nodes for functional connectome analysis.
- domain assumption Covariance of band-pass filtered rsfMRI time series represents functional connectivity.
- domain assumption Log-transformed NDI scores are well modeled by a 3-component Gaussian mixture.
- domain assumption Group-averaged connectomes are representative of individual topology for Tier assignment.
Cite this review
Pith. "Pith review of Network Dependency Index Stratified Subnetwork Analysis of Functional Connectomes: An application to autism." pith.science (2026). https://pith.science/paper/RTWVMADS
@misc{pith2026190809116,
  author       = {Pith},
  title        = {Pith review of: Network Dependency Index Stratified Subnetwork Analysis of Functional Connectomes: An application to autism},
  year         = {2026},
  howpublished = {\url{https://pith.science/paper/RTWVMADS}},
  note         = {Machine review of arXiv:1908.09116}
}
read the original abstract
Autism spectrum disorder (ASD) is a neurodevelopmental condition impacting high-level cognitive processing and social behavior. Recognizing the distributed nature of brain function, neuroscientists are exploiting the connectome to aid with the characterization of this complex disease. The human connectome has demonstrated the brain to be a highly organized system with a centralized core vital for effective function. As such, many have used this topological principle to not only assess core regions, but have stratified the remaining graph into subnetworks depending on their relation to the core. Subnetworks are then utilized to further understand the supporting role of more peripheral nodes with respects to the overall function in the network. A recently proposed framework for subnetwork definition is based on the network dependency index (NDI), a measure of a node's importance based on its contribution to overall efficiency in the network, and the derived subnetworks, or Tiers, have been shown to be largely stable across ages in structural networks. Here, we extend the NDI framework to test its efficacy against a number experimental conditions. We first not only demonstrated NDI's feasibility on resting-state functional MRI data, but also its stability irrespective of the group connectome on which NDI was determined for various edge thresholds. Secondly, by comparing network theory measures of transitivity and efficiency, significant group differences were identified in NDI Tiers of greatest importance. This demonstrates the efficacy of utilizing NDI stratified subnetworks, which can help to improve our understanding of diseases and how they affect overall brain connectivity.
Figures


Reference graph
Works this paper leans on
-
[1]
MMWR Surveillance Summaries 67(6), 1 (2018)
Baio, J., Wiggins, L., Christensen, D.L., Maenner, M.J., Daniels, J., Warren, Z., Kurzius-Spencer, M., Zahorodny, W., Rosenberg, C.R., White, T.: Prevalence of Network Dependency Index Subnetwork Analysis of Functional Connectomes 11 autism spectrum disorder among children aged 8 years-autism and developmental disabilities monitoring network, 11 sites, Un...
work page 2018
-
[2]
Proceedings of the National Academy of Sciences 111(20), 7456–7461 (2014)
Ball, G., Aljabar, P., Zebari, S., Tusor, N., Arichi, T., Merchant, N., Robinson, E.C., Ogundipe, E., Rueckert, D., Edwards, A.D.: Rich-club organization of the newborn human brain. Proceedings of the National Academy of Sciences 111(20), 7456–7461 (2014)
work page 2014
-
[3]
Frontiers in human neuroscience 12, 257 (2018)
Bi, X.a., Liu, Y., Jiang, Q., Shu, Q., Sun, Q., Dai, J.: The diagnosis of autism spectrum disorder based on the random neural network cluster. Frontiers in human neuroscience 12, 257 (2018)
work page 2018
-
[4]
In: 2016 International Workshop on Pattern Recog- nition in NeuroImaging (PRNI)
Chung, A.W., Pesce, E., Monti, R.P., Montana, G.: Classifying HCP task-fMRI networks using heat kernels. In: 2016 International Workshop on Pattern Recog- nition in NeuroImaging (PRNI). pp. 1–4. IEEE (2016)
2016
-
[5]
Neuroimage 141, 490–501 (2016)
Chung, A.W., Schirmer, M.D., Krishnan, M.L., Ball, G., Aljabar, P., Edwards, A.D., Montana, G.: Characterising brain network topologies: a dynamic analysis approach using heat kernels. Neuroimage 141, 490–501 (2016)
work page 2016
-
[6]
arXiv:1909.08071 [q-bio.NC], 1–22 (Sept, 2019)
Chung, A.W., Mannix, R., Feldman, H.A., Grant, P.E., Im, K.: Longitudinal structural connectomic and rich-club analysis in adolescent mTBI reveals per- sistent, distributed brain alterations acutely through to one year post-injury. arXiv:1909.08071 [q-bio.NC], 1–22 (Sept, 2019)
arXiv 1909
-
[7]
Schizophre- nia Bulletin 40(2), 438–448 (2013)
Collin, G., Kahn, R.S., de Reus, M.A., Cahn, W., van den Heuvel, M.P.: Impaired rich club connectivity in unaffected siblings of schizophrenia patients. Schizophre- nia Bulletin 40(2), 438–448 (2013)
2013
-
[8]
Fron- tiers in Neuroinformatics 7 (2013)
Craddock, C., Benhajali, Y., Chu, C., Chouinard, F., Evans, A., Jakab, A., Khun- drakpam, B.S., Lewis, J.D., Li, Q., Milham, M.: The Neuro Bureau Preprocessing Initiative: open sharing of preprocessed neuroimaging data and derivatives. Fron- tiers in Neuroinformatics 7 (2013)
work page 2013
Show all 24 references
-
[9]
Molecular psychiatry 19(6), 659 (2014)
Di Martino, A., Yan, C.G., Li, Q., Denio, E., Castellanos, F.X., Alaerts, K., An- derson, J.S., Assaf, M., Bookheimer, S.Y., Dapretto, M.: The autism brain imaging data exchange: towards a large-scale evaluation of the intrinsic brain architecture in autism. Molecular psychiat...
2014
-
[10]
PloS one 9(2), e88297 (2014)
Grayson, D.S., Ray, S., Carpenter, S., Iyer, S., Dias, T.G.C., Stevens, C., Nigg, J.T., Fair, D.A.: Structural and functional rich club organization of the brain in children and adults. PloS one 9(2), e88297 (2014)
2014
-
[11]
Nature communications 10(1), 1022 (2019)
Hong, S.J., de Wael, R.V., Bethlehem, R.A., Lariviere, S., Paquola, C., Valk, S.L., Milham, M.P., Di Martino, A., Margulies, D.S., Smallwood, J.: Atypical functional connectome hierarchy in autism. Nature communications 10(1), 1022 (2019)
2019
-
[12]
Stroke (published online ahead of print September 12, 2019)
Ktena, S.I., Schirmer, M.D., Etherton, M.R., Giese, A.K., Tuozzo, C., Mills, B.B., Rueckert, D., Wu, O., Rost, N.S.: Brain connectivity measures improve modeling of functional outcome after acute ischemic stroke. Stroke (published online ahead of print September 12, 2019). htt...
2019 doi
-
[13]
Trends in cognitive sciences (2018)
M¨ uller, R.A., Fishman, I.: Brain connectivity and neuroimaging of social networks in autism. Trends in cognitive sciences (2018)
2018
-
[14]
Frontiers in human neuroscience 7, 599 (2013)
Nielsen, J.A., Zielinski, B.A., Fletcher, P.T., Alexander, A.L., Lange, N., Bigler, E.D., Lainhart, J.E., Anderson, J.S.: Multisite functional connectivity MRI classi- fication of autism: ABIDE results. Frontiers in human neuroscience 7, 599 (2013)
2013
-
[15]
Neuroimage 52(3), 1059–1069 (2010)
Rubinov, M., Sporns, O.: Complex network measures of brain connectivity: uses and interpretations. Neuroimage 52(3), 1059–1069 (2010)
2010
-
[16]
NeuroImage: clinical 2, 79–94 (2013) 12 Chung and Schirmer
Rudie, J.D., Brown, J.A., Beck-Pancer, D., Hernandez, L.M., Dennis, E.L., Thomp- son, P.M., Bookheimer, S.Y., Dapretto, M.: Altered functional and structural brain network organization in autism. NeuroImage: clinical 2, 79–94 (2013) 12 Chung and Schirmer
2013
-
[17]
Schirmer, M.D.: Developing brain connectivity: effects of parcellation scale on net- work analysis in neonates. Ph.D. thesis, King’s College London (2015)
2015
-
[18]
In: International Workshop on Connectomics in Neuroimaging
Schirmer, M.D., Chung, A.W.: Structural subnetwork evolution across the life- span: rich-club, feeder, seeder. In: International Workshop on Connectomics in Neuroimaging. pp. 1–10. LNCS, Springer (2018). https://doi.org/ https://doi. org/10.1007/978-3-030-00755-3_15
2018 doi
-
[19]
Network Neuroscience pp
Schirmer, M.D., Chung, A.W., Grant, P.E., Rost, N.S.: Network structural depen- dency in the human connectome across the life span. Network Neuroscience pp. 1–15 (2018)
2018
-
[20]
Frontiers in Neurology 10, 956 (2019)
Schirmer, M.D., Ktena, S.I., Nardin, M.J., Donahue, K.L., Giese, A.K., Etherton, M.R., Wu, O., Rost, N.S.: Rich-Club Organization: An Important Determinant of Functional Outcome After Acute Ischemic Stroke. Frontiers in Neurology 10, 956 (2019). https://doi.org/10.3389/fneur.2...
2019
-
[21]
Journal of Neuroscience 31(44), 15775–15786 (2011)
Van Den Heuvel, M.P., Sporns, O.: Rich-club organization of the human connec- tome. Journal of Neuroscience 31(44), 15775–15786 (2011)
2011
-
[22]
NeuroImage 80, 405–415 (2013)
Varoquaux, G., Craddock, R.C.: Learning and comparing functional connectomes across subjects. NeuroImage 80, 405–415 (2013)
2013
-
[23]
ACM Transactions on Information Systems (TOIS) 28(4), 20 (2010)
Webber, W., Moffat, A., Zobel, J.: A similarity measure for indefinite rankings. ACM Transactions on Information Systems (TOIS) 28(4), 20 (2010)
2010
-
[24]
Human brain mapping 36(10), 3777–3792 (2015)
Zhao, T., Cao, M., Niu, H., Zuo, X.N., Evans, A., He, Y., Dong, Q., Shu, N.: Age-related changes in the topological organization of the white matter structural connectome across the human lifespan. Human brain mapping 36(10), 3777–3792 (2015)
2015
Reviewed August 14, 2026 · model on record in the stance chip above.
Discussion (0). Continue with ORCID to comment.