REVIEW 4 major objections 5 minor 37 references
Population-aware Hierarchical Bayesian Domain Adaptation via Multiple-component Invariant Learning
T0 review · 4 major / 5 minor · reviewed 2026-08-14 · deepseek-v4-flash
Pith's one-line read A hierarchical Bayesian model improves influenza prediction when target data come from a new environment and a different population.
desk verdict A useful hierarchical transfer method with a shaky causal story; deserves review after fixes. read the letter →
The pith
A machine-rendered reading of the paper's core claim, the machinery that carries it, and where it could break.
The reading
What carries the argument
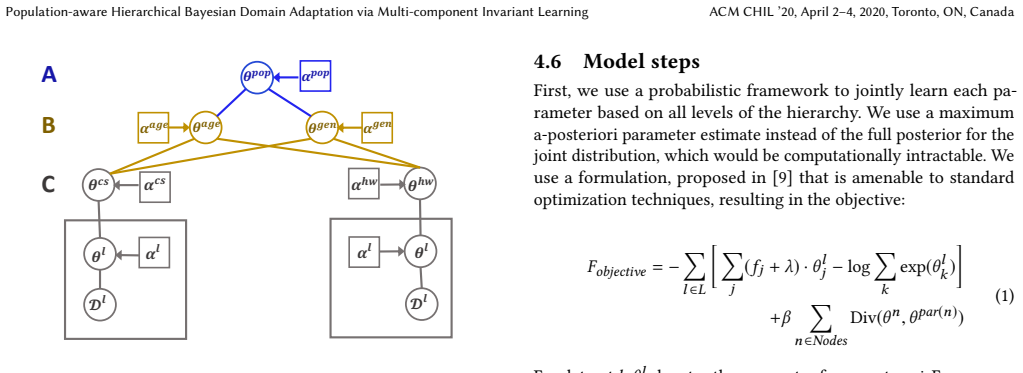
The central object is the selection diagram (a causal graph augmented with selection variables) plus a multi-parent hierarchical Bayesian model built to match it. In the diagram, selection variables S* mark features whose measurement changes across environments and S̃ marks demographic selection bias; from the graph the authors read that infection given demographics, P(Y|D), is invariant, while the symptom-to-infection mapping is not. The hierarchical model realizes this by placing a shared root parameter θ_pop above population parameters θ_a, θ_g, above environment parameters θ_c, above dataset parameters θ_l, and fitting all levels jointly with a maximum-a-posteriori objective in which an L2 divergence penalizes a child parameter for straying from its parents. A separate per-subgroup regression learns positive weights γ combining dataset, age, and gender parameters for each demographic subgroup, and Theorem 1 gives the licensing conditions (subgroup informativeness δ and prevalence gap) that decide whether the local θ_l or the invariant θ_d should dominate.
What would settle it
A decisive test would be a target environment deliberately chosen so that P(Y|D) differs from the pooled sources—for instance, an age group with opposite infection risk in the target, or a setting where laboratory confirmation is only available for severe cases. If Hier+pop, trained on source data plus 20% labeled target, does not outperform target-only training on that environment, the population-invariant component is not doing the claimed work. Equivalently, a simulation sampling from a graph with an unobserved confounder U affecting both selection and infection, violating S ⊥ Y | D, should reproduce the failure.
Extended reading notes
Core claim
The paper's central claim is that, for symptom-based infection prediction, demographic attributes define a transferable invariant and symptom-reporting behavior defines a non-transferable component. Using a selection diagram with two types of selection variables—one marking changes in how symptoms are assigned (S*→X) and one marking demographic selection bias (D→S̃)—the authors derive that S ⊥ Y | D but S ⊥̸ Y | X, so P(Y|D) can be carried across environments while P*(Y|X,D) must be re-learned locally. The model instantiates this split as a hierarchy whose population parameters (by age group and gender) sit above environment and dataset parameters, with a divergence penalty pulling children toward parents; per-subgroup weights decide how much each target subgroup relies on invariant versus local information. Experiments over four observational influenza datasets show large AUC gains when the target has only 20% labeled data, and subgroup results show gains even for underrepresented groups, with the paper's Theorem 1 giving conditions under which the model should fall back on dataset-specific parameters.
Load-bearing premise
The load-bearing premise is that the true process that created the data matches the paper's selection diagram—specifically that, once age and gender are known, being selected into a dataset has no effect on infection status, so the age- and gender-stratified infection rates can be carried from one environment to another; if unmeasured causes (such as differing lab-testing practices or exposure patterns) shift those rates, the invariant component transfers the wrong information.
Editorial extensions
If this is right
- With only 20% labeled target data, Hier+pop achieves consistently higher AUC than target-only training, logistic regression, and FEDA-style feature-augmentation baselines on all four datasets, so practitioners can label less.
- Population-invariant parameters improve prediction for demographic subgroups that are underrepresented in a target dataset, mitigating a form of aggregation bias.
- The learned per-subgroup weights reveal when local environment data is needed: if the subgroup's symptoms are more informative than the pooled population's, or if its prevalence diverges sharply, the model uses dataset-specific parameters.
- The approach gives a principled workflow: specify the selection diagram, identify an invariant conditional distribution, then choose a hierarchy whose levels mirror the invariant and variant components.
- The licensing conditions from Theorem 1 can be used proactively to decide whether adding a dataset to the model's source pool would help a given subgroup.
Reading between the lines
- Going beyond the paper, if the invariant demographic component P(Y|D) is as portable as the paper assumes, the same architecture should transfer to other diseases with stable demographic risk strata, such as tuberculosis or vaccine-preventable respiratory infections, whenever symptom-reporting mechanisms differ across data sources.
- A direct stress test would simulate a target environment whose age- and gender-specific infection rates are deliberately shifted, violating S ⊥ Y | D; the model should degrade toward target-only performance, revealing how much of its gain comes from the invariant component versus from the hierarchy's shrinkage alone.
- The subgroup-weight mechanism could be adapted as a diagnostic for sampling needs: subgroups whose learned weight falls mostly on θ_d are borrowing knowledge from other environments, which tells a surveillance program which populations are least represented locally.
- The paper's framing suggests the same hierarchy could be coupled with fairness constraints at the subgroup level, since it already produces subgroup-specific classifiers rather than one aggregate model.
Signed reviews
Editorial analysis
A structured set of objections, weighed in public.
Referee Report
Summary. The paper proposes a population-aware hierarchical Bayesian domain adaptation method, Hier+pop, for predicting influenza infection when the target dataset is largely unlabeled and comes from a new environment and population. The method is motivated by a causal selection diagram that distinguishes environment-specific symptom-reporting mechanisms from population-shared demographic characteristics. The authors claim that the model improves AUC over baselines on four real-world influenza datasets, especially when only 20% of target labels are available, and they provide a theorem describing when invariant versus dataset-specific parameters should be used. The manuscript includes implementation code and a supplementary proof sketch.
Significance. If the claims hold, the paper addresses a practically important problem: transferring prediction models across health datasets with different population compositions and study designs. The explicit incorporation of demographic attributes into the hierarchy, the use of multiple parent nodes, and the evaluation on four distinct real-world datasets are strengths, as is the release of code. The conceptual framing in terms of selection diagrams is also valuable. However, the central causal justification for the invariant component is not convincingly established, and there are inconsistencies in the formal statements that currently limit the paper's contribution.
major comments (4)
- [Section 4.1, Assumption 1; Section 4.1, Figure 1b] Assumption 1 states that no system variable directly causes any selection variable, but the text immediately before introduces an edge from D to \tilde{S} and Figure 1b depicts D→\tilde{S}. Since D is a system variable and \tilde{S} is a selection variable, this is an internal contradiction. The assumption must either be restricted to S* or the selection graph modified.
- [Section 4.3, Figure 1b, Section 5] The d-separation claim S⊥Y|D, which is used to justify transferring P(Y|D) as invariant information, is contradicted by the study designs described in Section 5. In Goviral and Fluwatch, participation is symptom-triggered and specimen submission is self-selected; in Hongkong, participants are household contacts of confirmed cases, making selection depend on exposure and infection; Hutterite data come from a vaccination trial. Under these mechanisms there are unblocked paths between S and Y given D, so P(Y|D) need not be equal across environments. The predictive gains may reflect useful hierarchical pooling, but the causal claim that the model harnesses population-invariant information is not supported by the evidence presented.
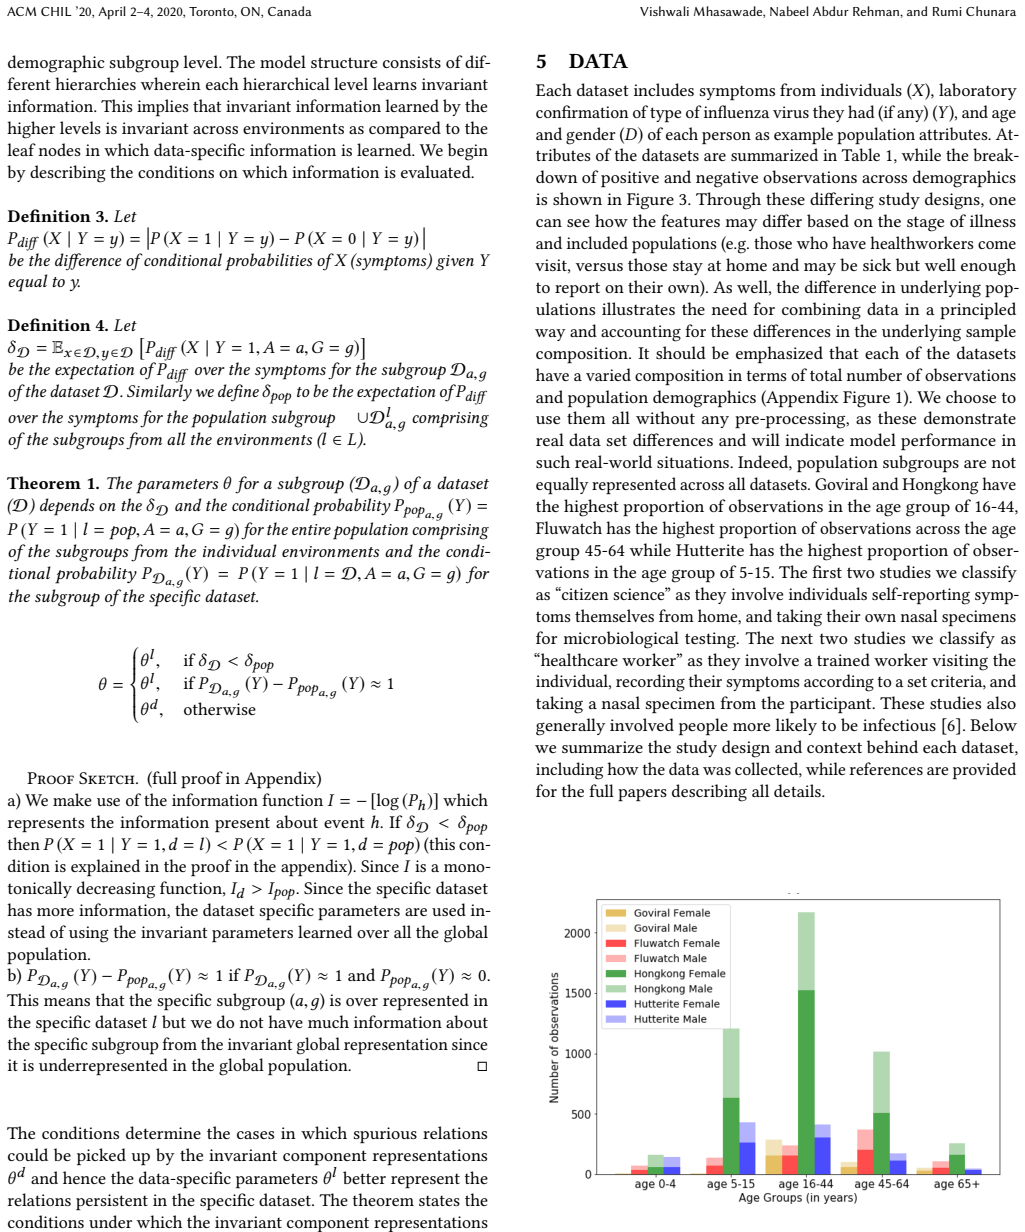
- [Section 4.7, Theorem 1 and Appendix A] Theorem 1 as stated is internally inconsistent. The main text gives conditions δD<δpop and PDa,g(Y)-Ppopa,g(Y)≈1 for using θ_l, with the proof sketch arguing that in the first case 'the specific dataset has more information'. The appendix, however, analyzes δD>δpop and concludes ID<Ipop, which would support using θ_d rather than θ_l. The proof does not establish the theorem as stated, and the conditions in the theorem therefore cannot be used to interpret the parameter-selection results in Table 3.
- [Sections 6 and 7.1, Tables 2 and 3, Figure 4] AUC values are reported without error bars, confidence intervals, or significance tests, and the number of random splits or repetitions is not specified. The hyperparameters λ=1 and β=0.2 are said to be selected by tuning, but the tuning procedure and the sensitivity of results to these choices are not described. These omissions make it difficult to assess whether the reported improvements of Hier+pop over baselines are statistically robust or specific to the chosen configuration.
minor comments (5)
- [Table 2] The dataset name 'Hutterite' is misspelled as 'Huttterite' in the table header.
- [Figure 2 caption] The caption contains 'dender' instead of 'gender'.
- [Section 1, Contributions] The phrase 'showing significant improvement' is used in the contributions list, but no statistical significance testing is reported; consider replacing 'significant' with 'consistent' or add formal tests.
- [Section 4.4, Equation (1)] The objective function uses f_j as positive predictive values rather than a likelihood; the relationship between this objective and a proper Bayesian hierarchical model could be clarified in the text.
- [Section 4.6] The restriction that the learned weights γ are positive is mentioned without an explanation of how such constraints are enforced in the nonlinear least-squares optimization; a sentence describing the constrained optimization method would improve reproducibility.
Circularity Check
No significant circularity; the invariance claim is an explicit modeling assumption and the reported gains are empirical fitting results.
full rationale
The paper's derivation chain is an explicit causal-modeling assumption followed by empirical-Bayes fitting. The transferable invariant P(Y|D) is not derived from data; it is assumed by constructing the selection diagram without S->Y or S->D edges and by stating Assumptions 1 and 2 (e.g., 'The absence of a selection variable pointing at D and Y indicates that the mechanism of assigning values to these variables is the same across environments'). That is a modeling assumption, contestable on correctness grounds, but not circular: the conclusion S⊥Y|D follows from the stated graph rather than being fitted to the outcome. The hierarchical parameters and the gamma combination weights are estimated from the labeled source and target training subsets, and evaluation is on the held-out target portion ('All methods are tested on the target dataset (excluding the subset of the target data used for training)'), so no fitted parameter is renamed as a prediction. The empirical-Bayes priors centered on cumulative data are standard practice and do not make the test result an input. The 'licensing conditions' theorem is presented as a post-hoc characterization of when the model prefers theta_l versus theta_d, not as a first-principles prediction of a constant equal to its own input. Self-citations to prior work on participatory influenza data are used as domain-knowledge support and as baselines, not as a load-bearing uniqueness theorem. No equation in the paper reduces by construction to its own inputs, so no specific circular step can be exhibited.
Assumptions & free parameters
free parameters (5)
- lambda (smoothing regularizer) =
1
- beta (hierarchy influence weight) =
0.2
- gamma weights (gamma0 to gamma3) =
Estimated per subgroup
- Empirical-Bayes prior centers =
Computed from cumulative data
- Hierarchy node parameters theta (dataset, collection, age, gender, root) =
MAP estimates from Equation 1
assumptions (6)
- domain assumption The data generating process is known and representable as the selection diagram in Figure 1b.
- domain assumption S is independent of Y given D, so P(Y|D) is invariant and transportable across environments.
- domain assumption The mechanism assigning Y, lab-confirmed influenza infection, is the same in all environments.
- standard math P(V) is Markov and faithful with respect to G.
- domain assumption Age and gender groups share stable infection characteristics across environments.
- ad hoc to paper Empirical-Bayes priors centered on cumulative data are weakly informative and do not leak test information.
Cite this review
Pith. "Pith review of Population-aware Hierarchical Bayesian Domain Adaptation via Multiple-component Invariant Learning." pith.science (2026). https://pith.science/paper/3WDRZPV2
@misc{pith2026190809222,
  author       = {Pith},
  title        = {Pith review of: Population-aware Hierarchical Bayesian Domain Adaptation via Multiple-component Invariant Learning},
  year         = {2026},
  howpublished = {\url{https://pith.science/paper/3WDRZPV2}},
  note         = {Machine review of arXiv:1908.09222}
}
read the original abstract
While machine learning is rapidly being developed and deployed in health settings such as influenza prediction, there are critical challenges in using data from one environment in another due to variability in features; even within disease labels there can be differences (e.g. "fever" may mean something different reported in a doctor's office versus in an online app). Moreover, models are often built on passive, observational data which contain different distributions of population subgroups (e.g. men or women). Thus, there are two forms of instability between environments in this observational transport problem. We first harness knowledge from health to conceptualize the underlying causal structure of this problem in a health outcome prediction task. Based on sources of stability in the model, we posit that for human-sourced data and health prediction tasks we can combine environment and population information in a novel population-aware hierarchical Bayesian domain adaptation framework that harnesses multiple invariant components through population attributes when needed. We study the conditions under which invariant learning fails, leading to reliance on the environment-specific attributes. Experimental results for an influenza prediction task on four datasets gathered from different contexts show the model can improve prediction in the case of largely unlabelled target data from a new environment and different constituent population, by harnessing both environment and population invariant information. This work represents a novel, principled way to address a critical challenge by blending domain (health) knowledge and algorithmic innovation. The proposed approach will have a significant impact in many social settings wherein who and where the data comes from matters.
Figures

Figures from the paper (1 more)

Reference graph
Works this paper leans on
- [1]
-
[2]
B. P. Carlin and T. A. Louis. Bayes and empirical Bayes methods for data analysis . Chapman and Hall/CRC, 2010
work page 2010
-
[3]
CDC. Flu symptoms and diagnosis. https://www.cdc.gov/flu/symptoms/index. html, 2019
work page 2019
-
[4]
I. Chen, F. D. Johansson, and D. Sontag. Why is my classifier discriminatory? In Advances in Neural Information Processing Systems , pages 3539–3550, 2018
work page 2018
-
[5]
R. Chunara, E. Goldstein, O. Patterson-Lomba, and J. S. Brownstein. Estimating influenza attack rates in the united states using a participatory cohort. Scientific reports, 5:9540, 2015
work page 2015
-
[6]
B. J. Cowling, K. H. Chan, V. J. Fang, L. L. Lau, H. C. So, R. O. Fung, E. S. Ma, A. S. Kwong, C.-W. Chan, W. W. Tsui, et al. Comparative epidemiology of pandemic and seasonal influenza a in households. NEJM, 362(23):2175–2184, 2010
work page 2010
-
[7]
W. F. Darnieder. Bayesian methods for data-dependent priors . PhD thesis, The Ohio State University, 2011
work page 2011
- [8]
Show all 37 references
-
[9]
Elidan, B
G. Elidan, B. Packer, G. Heitz, and D. Koller. Convex point estimation using undirected bayesian transfer hierarchies. arXiv preprint arXiv:1206.3252, 2012
2012 arXiv
-
[10]
C. R. Evans, D. R. Williams, J.-P. Onnela, and S. Subramanian. A multilevel approach to modeling health inequalities at the intersection of multiple social identities. Social Science & Medicine , 203:64–73, 2018
2018
-
[11]
J. R. Finkel and C. D. Manning. Hierarchical bayesian domain adaptation. In NAACL HLT, pages 602–610, 2009
2009
-
[12]
Fletcher and M
R. Fletcher and M. J. Powell. A rapidly convergent descent method for minimiza- tion. The computer journal, 6(2):163–168, 1963
1963
-
[13]
E. B. Fragaszy, C. Warren-Gash, L. Wang, A. Copas, O. Dukes, W. J. Edmunds, N. Goonetilleke, G. Harvey, A. M. Johnson, J. Kovar, et al. Cohort profile: The flu watch study. International journal of epidemiology , 46(2):e18–e18, 2016
2016
-
[14]
J. Goff, A. Rowe, J. S. Brownstein, and R. Chunara. Surveillance of acute res- piratory infections using community-submitted symptoms and specimens for molecular diagnostic testing. PLoS currents, 7, 2015
2015
-
[15]
J. Guo, D. J. Shah, and R. Barzilay. Multi-source domain adaptation with mixture of experts. arXiv preprint arXiv:1809.02256, 2018
2018 arXiv
-
[16]
M. Loeb, M. L. Russell, L. Moss, K. Fonseca, J. Fox, D. J. Earn, F. Aoki, G. Horsman, P. Van Caeseele, K. Chokani, et al. Effect of influenza vaccination of children on infection rates in hutterite communities: a randomized trial. JAMA, 303(10): 943–950, 2010
2010
-
[17]
Magliacane, T
S. Magliacane, T. van Ommen, T. Claassen, S. Bongers, P. Versteeg, and J. M. Mooij. Domain adaptation by using causal inference to predict invariant conditional distributions. In Advances in Neural Information Processing Systems , pages 10869– 10879, 2018
2018
-
[18]
A. S. Monto, S. Gravenstein, M. Elliott, M. Colopy, and J. Schweinle. Clinical signs and symptoms predicting influenza infection. Archives of internal medicine, 160(21):3243–3247, 2000
2000
-
[19]
J. M. Mooij, S. Magliacane, and T. Claassen. Joint causal inference from multiple contexts. arXiv preprint arXiv:1611.10351, 2016
2016 arXiv
-
[20]
Mullainathan and Z
S. Mullainathan and Z. Obermeyer. Who is tested for heart attack and who should be: Predicting patient risk and physician error. Technical report, National Bureau of Economic Research, 2019. Population-aware Hierarchical Bayesian Domain Adaptation via Multi-component Invariant...
2019
-
[21]
J. Pearl. Causality: models, reasoning, and inference. IIE Transactions, 34(6): 583–589, 2002
2002
-
[22]
Pearl and E
J. Pearl and E. Bareinboim. Transportability of causal and statistical relations: A formal approach. In Twenty-Fifth AAAI Conference on Artificial Intelligence , 2011
2011
-
[23]
A. L. Pineda, Y. Ye, S. Visweswaran, G. F. Cooper, M. M. Wagner, and F. R. Tsui. Comparison of machine learning classifiers for influenza detection from emer- gency department free-text reports. JBI, 58:60–69, 2015
2015
-
[24]
Pivovarov, D
R. Pivovarov, D. J. Albers, G. Hripcsak, J. L. Sepulveda, and N. Elhadad. Temporal trends of hemoglobin a1c testing. JAMIA, 21(6):1038–1044, 2014
2014
-
[25]
Ray and R
B. Ray and R. Chunara. Predicting acute respiratory infections from participatory data. Online journal of public health informatics , 9(1), 2017
2017
-
[26]
Rehman, M
N. Rehman, M. M. Aliapoulios, D. Umarwani, and R. Chunara. Domain adaptation for infection prediction from symptoms based on data from different study designs and contexts. arXiv preprint arXiv:1806.08835, 2018
2018 arXiv
-
[27]
N. G. Reich, L. C. Brooks, S. J. Fox, S. Kandula, C. J. McGowan, E. Moore, D. Osthus, E. L. Ray, A. Tushar, T. K. Yamana, et al. A collaborative multiyear, multimodel assessment of seasonal influenza forecasting in the united states. Proceedings of the National Academy of Scie...
2019
-
[28]
Saria, D
S. Saria, D. Koller, and A. Penn. Learning individual and population level traits from clinical temporal data. In Proceedings of Neural Information Processing Systems, 2010
2010
-
[29]
Singh, R
H. Singh, R. Singh, V. Mhasawade, and R. Chunara. Fair predictors under distri- bution shift. arXiv preprint arXiv:1911.00677, 2019
1911 arXiv
-
[30]
Subbaswamy, P
A. Subbaswamy, P. Schulam, and S. Saria. Learning predictive models that transport. arXiv:1812.04597, 2018
2018 arXiv
-
[31]
Suresh and J
H. Suresh and J. V. Guttag. A framework for understanding unintended consequences of machine learning. CoRR, abs/1901.10002, 2019. URL http: //arxiv.org/abs/1901.10002
1901 arXiv
-
[32]
Susser and E
M. Susser and E. Susser. Choosing a future for epidemiology: Ii. from black box to chinese boxes and eco-epidemiology. American journal of public health , 86(5): 674–677, 1996
1996
-
[33]
Ustun, Y
B. Ustun, Y. Liu, and D. Parkes. Fairness without harm: Decoupled classifiers with preference guarantees. In International Conference on Machine Learning , pages 6373–6382, 2019
2019
-
[34]
van Erp, J
S. van Erp, J. Mulder, and D. L. Oberski. Prior sensitivity analysis in default bayesian structural equation modeling. American Psychological Association, 2017
2017
-
[35]
Wiens, J
J. Wiens, J. Guttag, and E. Horvitz. A study in transfer learning: leveraging data from multiple hospitals to enhance hospital-specific predictions. JAMIA, 21(4): 699–706, 2014
2014
-
[36]
Influenza fact sheet: Overview
World Health Organization. Influenza fact sheet: Overview. 2018
2018
-
[37]
H. H. Zhou, V. Singh, S. C. Johnson, G. Wahba, A. D. N. Initiative, et al. Statistical tests and identifiability conditions for pooling and analyzing multisite datasets. PNAS, 115(7):1481–1486, 2018. ACM CHIL ’20, April 2–4, 2020, Toronto, ON, Canada Vishwali Mhasawade, Nabeel...
2018
Reviewed August 14, 2026 · model on record in the stance chip above.
Discussion (0). Continue with ORCID to comment.