REVIEW 4 major objections 5 minor 38 references
Superconductivity in the Ru-Doped CuIr2Te4 Telluride Chalcogenide
T0 review · 4 major / 5 minor · reviewed 2026-08-14 · deepseek-v4-flash
Pith's one-line read Substituting ruthenium for iridium in CuIr2Te4 destroys the charge density wave and pushes superconductivity to a maximum Tc of 2.79 K at x = 0.05, with evidence of strong electron-phonon coupling.
desk verdict A new Ru-doping phase diagram for CuIr2Te4 with a solid empirical core, but the quoted Hc1 and Hc2 values are mutually inconsistent and need correction before publication. read the letter →
The pith
A machine-rendered reading of the paper's core claim, the machinery that carries it, and where it could break.
The reading
What carries the argument
The object that carries the argument is the B-site-substituted solid solution, in which ruthenium replaces iridium inside the two-dimensional IrTe2 layers of the disordered trigonal structure. The measurements that carry the claim are the low-temperature resistivity and susceptibility transitions, the specific-heat jump at $T_c$, and the field-dependent magnetization and transport used to extract $H_{c1}(0)$ and $H_{c2}(0)$. The key quantitative identity is the normalized specific-heat jump $\Delta C/\gamma T_c \approx 1.51$, compared with the BCS weak-coupling value 1.43; combined with the Debye temperature and $T_c$ through the inverted strong-coupling formula, it yields $\lambda_{\mathrm{ep}} = 0.67$. The summarizing object is the $T_c$ versus $x$ phase diagram: a dome whose peak at $x = 0.05$ sits just above the doping level where the CDW disappears.
What would settle it
Atomic-resolution elemental mapping of CuIr$_{1.95}$Ru$_{0.05}$Te$_4$ would settle the matter: if ruthenium is found clustered rather than uniformly distributed on iridium sites, or if a RuTe2-like secondary phase appears below the powder-XRD detection limit, the homogeneous-substitution interpretation fails. Re-measuring the 1-T susceptibility of the $x = 0.03$ sample in a fresh batch or a single crystal and finding a residual anomaly near 250 K would likewise disprove the claim that the CDW is fully suppressed there.
Extended reading notes
Core claim
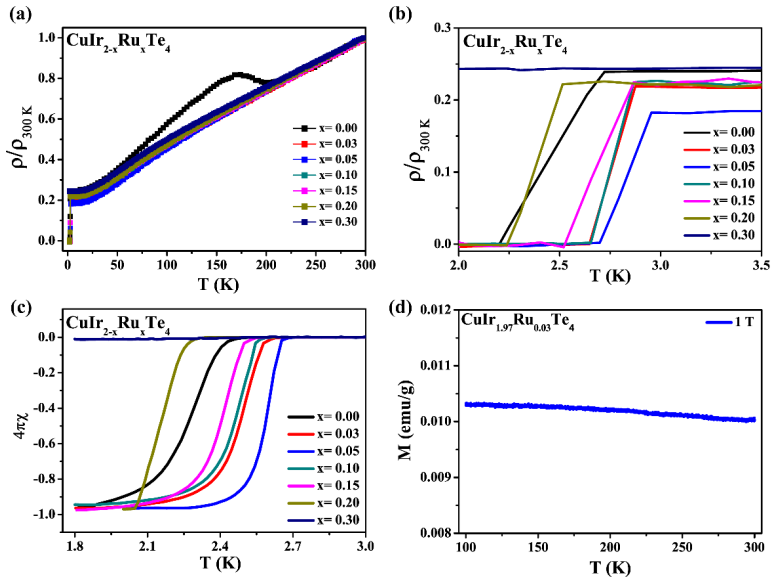
The paper's central claim is that ruthenium doping of CuIr2Te4 forms a solid solution CuIr$_{2-x}$Ru$_x$Te$_4$ ($0 \le x \le 0.30$) in the same disordered trigonal structure, and that this doping is a finely controlled tuning parameter for the competition between charge density wave and superconductivity. At $x = 0.03$ the CDW is completely suppressed, while $T_c$ rises to a maximum of 2.79 K at $x = 0.05$, then falls and vanishes by $x = 0.30$. For the optimal compound CuIr$_{1.95}$Ru$_{0.05}$Te$_4$, the specific-heat jump $\Delta C/\gamma T_c = 1.51$, Debye temperature 174.8 K, and a standard strong-coupling inversion give $\lambda_{\mathrm{ep}} = 0.67$, classifying it as a strongly electron-phonon coupled superconductor; magnetization and magnetotransport give $H_{c1}(0) = 0.098$ T and $H_{c2}(0) = 0.247$ T, making it a type-II superconductor. The paper also reports that the electronic density of states at the Fermi level rises slightly with ruthenium content, from 2.72 to 2.92 states per eV formula unit, which it connects to the increased transition temperature.
Load-bearing premise
The conclusions assume that ruthenium atoms occupy iridium sites in the nominal amounts stated and that the samples are homogeneous solid solutions, so the observed CDW suppression and superconducting dome are intrinsic doping effects rather than ruthenium clustering, iridium deficiencies, or an undetected second phase.
Editorial extensions
If this is right
- In this telluride family, small substitutions on the iridium site can completely remove a high-temperature charge density wave while enhancing low-temperature superconductivity, showing that the two orders compete directly.
- The optimal material CuIr$_{1.95}$Ru$_{0.05}$Te$_4$ is a bulk type-II superconductor with strong electron-phonon coupling, so the superconductivity is not filamentary or impurity-driven.
- The dome-shaped $T_c(x)$ implies an optimum doping level that maximizes superconductivity, with overdoping at $x = 0.3$ destroying superconductivity before a RuTe2 impurity phase appears.
- The reported increase in Fermi-level density of states with doping points to a practical route to raise $T_c$ in this family: substitutions that increase $N(E_F)$ without disrupting the layered structure should move the dome peak.
Reading between the lines
- Because the CDW is already gone at $x = 0.03$ while $T_c$ keeps rising to $x = 0.05$, the dome peak is not set simply by the disappearance of the CDW; the paper's own data suggest the density of states may be the controlling factor, though the paper states this only qualitatively.
- A direct test of the proposed mechanism would be single-crystal measurements: quantum oscillations could map the Fermi surface as a function of $x$ and show whether ruthenium doping acts mainly as a rigid Fermi-energy shift or a deeper band-structure change.
- The same substitution strategy could be tried with other elements on the iridium site, such as rhodium or platinum, or with pressure; if the dome and the fast CDW suppression recur, the competition would be a general property of the layered CuIr2Te4 family rather than a ruthenium-specific effect.
Signed reviews
Editorial analysis
A structured set of objections, weighed in public.
Referee Report
Summary. The manuscript reports the synthesis and characterization of CuIr2-xRuxTe4 (0.0 ≤ x ≤ 0.30) by solid-state reaction. Powder XRD indicates the disordered trigonal P-3m1 structure is retained up to x = 0.30, with lattice parameters decreasing on Ru substitution. Temperature-dependent resistivity, magnetic susceptibility, and specific-heat measurements are used to establish a superconducting dome with optimal doping at x = 0.05, where Tc ≈ 2.79 K, ΔC/γTc ≈ 1.51, λep = 0.67, μ0Hc1(0) = 0.098 T, and μ0Hc2(0) = 0.247 T. The authors also report that the charge-density-wave transition of the parent compound is suppressed already at x = 0.03, and they construct a dome-shaped Tc-versus-x phase diagram. The central empirical claims are that Ru doping tunes the CDW/superconductivity competition and that CuIr1.95Ru0.05Te4 is a bulk, strongly electron-phonon coupled type-II superconductor.
Significance. If the results hold, the paper provides a useful experimental phase diagram for a telluride chalcogenide in which CDW and superconductivity compete, and it identifies a specific doping level at which Tc is maximized. The main strengths are the use of multiple complementary probes (resistivity, magnetization, and specific heat) with mutually consistent Tc values, and the demonstration of bulk superconductivity via a specific-heat anomaly. The quantitative type-II characterization, however, contains an internal inconsistency between Hc1(0) and Hc2(0) that must be resolved before the abstract-level claims about critical fields can be accepted. The McMillan analysis also omits a stated value of μ*, and the interpretation of N(EF) is partly circular because λep is derived from Tc. These issues are local and reparable; they do not by themselves overturn the central phase-diagram claim.
major comments (4)
- [Results and Discussion, Fig. 3, Fig. 4, Table 1] The reported zero-temperature critical fields are mutually inconsistent for a single Ginzburg-Landau type-II superconductor. For any isotropic/anisotropic GL superconductor, Hc1/Hc2 is bounded by ln(κ)/(2κ^2), whose maximum is about 0.092 at κ = e^{1/2}. The quoted values give 0.098 T / 0.247 T ≈ 0.397, roughly four times this bound. At least one of the two extractions is therefore not the thermodynamic lower/upper critical field of the same phase: the Hc1(0) value is likely contaminated by the demagnetization-factor correction (N = 0.55–0.75 gives a large 1/(1−N) amplification) or by surface-barrier effects, while the WHH-derived Hc2(0) and ξGL(0) = 36.3 nm cannot be reconciled with Hc1(0) = 0.098 T. The authors should re-examine the Hc1 extraction (including reporting N and its uncertainty for each M(H) curve) and/or restate which of the quoted fields is a first-penetration field rather than a thermodynamic lower critical field. As written, the quantitative type-II characterization in the abstract and conclusion is not self-consistent.
- [Results and Discussion, specific-heat analysis and McMillan formula] The inverted McMillan formula is used to obtain λep = 0.67, but the Coulomb pseudopotential μ* is never specified. The value of λep, and hence the subsequent statement that the compound is 'strongly electron-phonon coupled,' depends sensitively on μ*. The authors should state the assumed μ* (commonly 0.1–0.15) and show how λep varies over that range. In addition, the later comparison of N(EF) values is partly circular: λep is computed from Tc via McMillan, and N(EF) is then derived from γ and λep, so the statement that 'the higher density of electronic states at the Fermi energy matched the higher transition temperature' is not an independent confirmation. An independent estimate of N(EF), e.g., from band-structure calculations, would be needed to support that interpretation.
- [Results and Discussion, Fig. 3] The zero-temperature lower critical field is obtained by fitting μ0Hc1(T) = μ0Hc1(0)[1 − (T/Tc)^2] to only four temperatures (1.8, 2.0, 2.2, and 2.4 K) with no error bars shown. Given that the demagnetization factor N is itself reported as a range (0.55–0.75), the systematic uncertainty in Hc1(0) is likely large enough to affect the comparison with Hc2(0) and with the parent compound. The paper should report the fitted Hc1(0) with uncertainty, the value of N used for each temperature, and the propagation of the N uncertainty into Hc1(0).
- [Results and Discussion, Fig. 2d and phase diagram] The claim that the CDW is 'completely suppressed' at x = 0.03 rests on the absence of a resistivity hump for all doped samples and on a single magnetic-susceptibility measurement at 1 T for CuIr1.97Ru0.03Te4. Since the CDW suppression is a load-bearing part of the phase-diagram narrative, this conclusion should be corroborated by at least one additional probe (e.g., heat capacity or higher-field susceptibility) and by showing the parent-compound comparison on the same figure for the same field. As presented, the evidence is suggestive but not as strong as the wording in the abstract and conclusion implies.
minor comments (5)
- [Abstract and Conclusion] There are several typos and grammatical issues: 'lower critical filed' should be 'lower critical field'; 'then, with decreasing when x reaches 0.3' is ungrammatical; in the main text 'the season why' should be 'the reason why'; 'mediately surprised' appears to be 'immediately suppressed'; and 'doing content' should be 'doping content.'
- [Figure 3 caption] The caption of Fig. 3 says 'Temperature dependence of the lower critical field (μ0Hc1) for CuIr2Te4,' but the data and text describe CuIr1.95Ru0.05Te4. This mismatch should be corrected.
- [Table 2 and Rietveld refinement] The Ru occupancy in the Rietveld refinement is fixed at the nominal value (0.050) rather than freely refined. The text should state that occupancies were fixed, and ideally report a refinement with Ru occupancy free to confirm the actual substitution level and rule out Ru clustering or partial occupancy of other sites.
- [Results and Discussion, specific-heat section] The designation 'strongly electron-phonon coupled' is overstated for λep = 0.67, which is usually considered intermediate coupling. The specific-heat jump of 1.51 is above the BCS weak-coupling value but is also not very large; the language should be moderated unless independent evidence of strong coupling is provided.
- [Table 1] Some entries in Table 1 are blank and the symbols β and ΘD are not consistently defined in the table caption. For reproducibility, the table should include the units and the number of atoms per formula unit used in the Debye-temperature calculation.
Circularity Check
The measured Tc dome and bulk superconductivity are empirically grounded; the only substantive circularity is the interpretive claim that higher N(EF) explains higher Tc, because N(EF) is computed using λep that is itself derived from Tc.
-
self definitional
[Results and Discussion, specific-heat paragraph (Fig. 5 discussion) and Table 1]
"Then we can estimate the electron-phonon coupling constant (λep) by using the Debye temperature (ΘD) and critical temperature Tc from the inverted McMillan formula... This resultant λep is 0.67... The electron density of states at the Fermi level (N(EF)) can be calculated from N(EF) = 3/[π^2 kB^2 (1+λep)] γ with the γ and λep. We got the value that N(EF) = 2.92 states/eV f.u. for CuIr1.95Ru0.05Te4 and N(EF) = 2.72 states/eV f.u. for CuIr2Te4..."
λep is not independently measured; it is obtained from the inverted McMillan formula using Tc and ΘD. N(EF) is then calculated from γ and λep through N(EF) = 3γ/[π^2 kB^2 (1+λep)]. Therefore the claimed microscopic explanation—higher N(EF) causes higher Tc—is partly self-referential: the N(EF) values being compared already contain Tc through λep. The measured γ values do provide independent content, but the specific statement that the N(EF) increase 'matched' the Tc increase is a constructed relation rather than an independent verification.
full rationale
The paper's central claims—the Ru-doping phase diagram, the Tc dome peaking at x = 0.05, the bulk superconducting transition seen in resistivity, susceptibility, and specific heat, and the ΔC/γTc value of 1.51—are direct measurements, not outputs of a fitted model. The CDW suppression at x = 0.03 is a direct observation from transport and susceptibility data. No load-bearing self-citation chain is used: the authors cite their own prior work on parent CuIr2Te4 for background, but the doped-series results are presented with their own raw data. The main circular step is interpretive: the paper derives λep from Tc via McMillan, uses that λep to compute N(EF), and then presents higher N(EF) as the explanation for higher Tc. That step is self-referential because the derived N(EF) is not independent of the Tc it is invoked to explain, though the measured γ enters separately. The Hc1/Hc2 inconsistency noted by the skeptic is a quantitative-consistency concern, not a circularity of the derivation chain. Overall, the empirical superconductor characterization stands, but the stated electronic-structure explanation is partly constructed from its own target quantity.
Assumptions & free parameters
free parameters (3)
- Coulomb pseudopotential μ*
- Demagnetization factor N =
0.55-0.75
- Specific heat coefficient β =
2.54 mJ mol-1 K-4
assumptions (4)
- domain assumption Ru substitutes for Ir on the 1a site with the nominal stoichiometry x.
- standard math The McMillan formula with an unspecified Coulomb pseudopotential μ* (typically 0.13) relates Tc, ΘD, and λep.
- domain assumption The CDW transition in the parent and doped samples is detected by resistivity hump and susceptibility anomalies around 250 K.
- standard math BCS weak-coupling ratio ΔC/γTc = 1.43 is the benchmark for comparison.
Cite this review
Pith. "Pith review of Superconductivity in the Ru-Doped CuIr2Te4 Telluride Chalcogenide." pith.science (2026). https://pith.science/paper/CMQWXGH7
@misc{pith2026190809292,
  author       = {Pith},
  title        = {Pith review of: Superconductivity in the Ru-Doped CuIr2Te4 Telluride Chalcogenide},
  year         = {2026},
  howpublished = {\url{https://pith.science/paper/CMQWXGH7}},
  note         = {Machine review of arXiv:1908.09292}
}
read the original abstract
Here we report the effect of structural and superconductivity properties on Ru doped CuIr2Te4 telluride chalcogenide. XRD results suggest that the CuIr2-xRuxTe4 maintain the disordered trigonal structure with space group P3m1 (No. 164) for x less than 0.3. The lattice constants, a and c, both decrease with increasing Ru content. Temperature-dependent resistivity, magnetic susceptibility and specific-heat measurements are performed to characterize the superconducting properties systematically. Our results suggest that the optimal doping level for superconductivity in CuIr2-xRuxTe4 is x = 0.05, where Tc is 2.79 K with the Sommerfeld constant gamma of 11.52 mJ mol-1 K-2 and the specific-heat anomaly at the superconducting transition, is approximately 1.51, which is higher than the BCS value of 1.43, indicating CuIr1.95Ru0.05Te4 is a strongly electron-phonon coupled superconductor. The values of lower critical filed and upper critical field calculated from isothermal magnetization and magneto-transport measurements are 0.98 KOe and 2.47 KOe respectively, signifying that the compound is clearly a type-II superconductor. Finally, a dome-like shape superconducting Tcs vs. x content phase diagram is established, where the charge density wave disappears at x = 0.03 while superconducting transition temperature (Tc) rises until it reaches its peak at x = 0.05, then, with decreasing when x reaches 0.3. This feature of the competition between CDW and the superconductivity could be caused by tuning the Fermi surface and density of states with Ru chemical doping.
Figures

Reference graph
Works this paper leans on
-
[1]
T. J. Coutts, D. L. Young, X. Li, W. P. Mulligan, and X. Wu, J. Vac. Sci. Technol. A18, 2646 (2000)
work page 2000
-
[2]
M. Dekkers, G. Rijnders, and D. H. A. Blank, Appl. Phys. Lett. 90, 021903 (2007)
work page 2007
-
[3]
C. A. Hoel, T. O. Mason, J.-F. Gaillard, and K. R. Poeppelmeier, Chem. Mater. 22, 3569 (2010)
work page 2010
-
[4]
F. K. Lotgering, Philips Res. Rep., 11, 190 (1956)
work page 1956
- [5]
-
[6]
P. G. Radaelli, Y . Horibe, M. J. Gutmann, H. Ishibashi, C. H. Chen, R. M. Ibberson, Y . Koyama, Y . S. Hor, V . Kiryukhin, and S. W. Cheong, Nature, 416, 155 (2002)
work page 2002
- [7]
-
[8]
M. Ito, A. Taira, and K. Sonoda, Acta Physica Polonica A., 131, 6 (2017)
work page 2017
Show all 38 references
-
[9]
Hagino, Y
T. Hagino, Y . Seki, and S. Nagata, Phys. C, 235–240, 1303(1994)
1994
-
[10]
Furubayashi, T
T. Furubayashi, T. Matsumoto, T. Hagino, and S. Nagata, J. Phys. Soc. Jpn. , 63, 3333 (1994)
1994
-
[11]
Hagino, T
T. Hagino, T. Tojo, T. Atake, and S. Nagata, Philos. Mag. B71, 881 (1995)
1995
-
[12]
T. Oda, M. Shirai, N. Suzuki, and K. Motizuki, J. Phys.: Condens. Matter, 7, 4433 (1995)
1995
-
[13]
G. Oomi, T. Kagayama , I. Yoshida, T. Hagino, and S. Nagata, J. Magn. Magn. Mater., 140–144, 157 (1995)
1995
-
[14]
Furubayashi, T
T. Furubayashi, T. Kosaka, J. Tang, T. Matsumoto, Y . Kato, and S. Nagata, J. Phys. Soc. Jpn., 66 1563(1997)
1997
-
[15]
Robbins, R
M. Robbins, R. H. Willens, and R. C. Miller, Solid State Commun., 5, 933 (1967)
1967
-
[16]
F. K. Lotgering, and R. P. Van Stapele, J. Appl. Phys., 39, 417 (1968)
1968
-
[17]
F. K. Lotgering, J. Phys. Chem. Solids, 30, 1429 (1969)
1969
-
[18]
F. J. DiSalvo and J. V . Waszczak, Phys. Rev. B, 26, 2501 (1982)
1982
-
[19]
R. N. Shelton, D. C. Johnston, and H. Adrian, Solid State Commun., 20, 1077 (1976)
1976
-
[20]
R. M. Fleming, F. J. DiSalvo, R. J. Cava and J. V . Waszczak, Phys. Rev. B, 24, 2850 (1981)
1981
-
[21]
N. L. Nagard, A. Katty, G. Collin, O. Gorochov, and A. Willig, J. Solid State Chem., 27, 267 (1979)
1979
-
[22]
S. V . Smaalen, Acta Crystallogr. A61, 51 (2005)
2005
-
[23]
Nagata, N
S. Nagata, N. Kijima, S. Ikeda, N. Matsumoto, R. Endoh, S. Chikazawa, I. Shimono, and H. Nishihara, J. Phys. Chem. Solids, 60, 163 (1999)
1999
-
[24]
D. Yan, Y . J. Zeng, G. H. Wang, Y . Y . Liu, J. J. Yin, T.-R. Chang, H. Lin, M. Wang, J. Ma, S. Jia, D.-X. Yao, H. X. Luo, arXiv:1908.05438 (2019)
2019 arXiv
-
[25]
Nagata, N
S. Nagata, N. Matsumoto, Y . Kato, T. Furubayashi, T. Matsumoto, J. P. Sanchez, and P. Vulliet, Phys. Rev. B, 58, 6844 (1998)
1998
-
[26]
Matsumoto, R
N. Matsumoto, R. Endoh, S. Nagata, T. Furubayashi, and T. Matsumoto, Phys. Rev. B, 60, 5258 (1999)
1999
-
[27]
Suzuki, T
H. Suzuki, T. Furubayashi, G. Cao, H. Kitazawa, A. Kamimura, K. Hirata and T. Matsumoto, J. Phys. Soc. Jpn., 68, 2495 (1999)
1999
-
[28]
H. X. Luo, T. Klimczuk, L. Müchler, L. Schoop, D. Hirai, M. K. Fuccillo, C. Felser, and R. J. Cava, Phys. Rev. B, 87, 214510 (2013)
2013
-
[29]
Rodríguez-Carvajal, Comm
J. Rodríguez-Carvajal, Comm. Powder Diffr., 26, 12 (2001)
2001
-
[30]
H. X. Luo, W. W. Xie, J. Tao, I. Pletikosic, T. G. Valla, S. Sahasrabudhe, G. Osterhoudt, E. Sutton, K. S. Burch, E. M. Seibel, J. W. Krizan, Y . M. Zhu, and R. J. Cava, Chem. Mater., 28, 1927 (2016)
2016
-
[31]
M. J. Winiarski, B. Wiendlocha, S. Gołąb, S. K. Kushwaha, P. Wiśniewsk, D. Kaczorowski, J. D. Thompson, R. J. Cava, and T. Klimczuk, Phys. Chem. Chem. Phys., 18, 21737 (2016)
2016
-
[32]
C. S. Yadav, and P. L. Paulose, New J. Phys., 11, 103046 (2009)
2009
-
[33]
dome-like
This resultant λep is 0.6 7, suggesting that CuIr1.95Ru0.05Te4 belongs to a strongly electron -phonon coupled superconductor. The electron density of states at the Fermi level ( N(EF)) can be calculated from N(EF) = 3 π2kB 2 (1+λep) γ with the γ and λep. We got the value that ...
-
[34]
W. L. McMillan, Phys. Rev., 167, 331(1968)
1968
-
[35]
J. A. Wilson, A. S. Barker, F. J. Di Salvo, and J. A. Ditzenberger, Phys. Rev. B, 18, 2866 (1978)
1978
-
[36]
Kohn, Phys
W. Kohn, Phys. Rev. Lett., 19, 439 (1967)
1967
-
[37]
N. R. Werthamer, E. Helfand, and P. C. Hohenberg, Phys. Rev., 147, 415 (1967)
1967
-
[38]
V . Z. Kresin, and S. A. Wolf, Plenum Press, New York and London, 150 (1990). Table 1. Comparison of superconducting parameters in AB2X4 superconductors Material CuIr1.95Ru0.05Te4 CuIr2Te4 CuRh2S4 CuRh2Se4 Cu0.7Zn0.3Ir2S4 CuIr1.6Pt0.4Se4 Tc (K) 2.79 2.50 4.7 3.5 3.4 1.76 γ (mJ...
1990
Reviewed August 14, 2026 · model on record in the stance chip above.
Discussion (0). Continue with ORCID to comment.