REVIEW 3 major objections 4 minor 51 references
Cloud Atlas: Variability in and out of the Water Band in the Planetary-mass HD 203030B Points to Cloud Sedimentation in Low-gravity L Dwarfs
T0 review · 3 major / 4 minor · reviewed 2026-08-14 · deepseek-v4-flash
Pith's one-line read The paper reports that HD 203030B, a young planetary-mass L7.5 companion, shows rotational variability with a 7.5-hour period and wavelength-dependent amplitude and phase that the authors attribute to a patchy cloud deck sinking below the…
desk verdict Robust rotation detection for HD 203030B, but the cloud-sedimentation punchline leans on ~2 sigma wavelength differences that the data don't yet carry. read the letter →
The pith
A machine-rendered reading of the paper's core claim, the machinery that carries it, and where it could break.
The reading
What carries the argument
The load-bearing object is the vertical separation between the top of the condensate cloud layer and the level where water vapor becomes opaque. In older L dwarfs the cloud layer sits above the water column, so all 1.1–1.7 μm variations share one amplitude scaling and one phase. In T dwarfs the cloud deck has sunk below the water band's opacity level, decoupling the two wavelength regions. The analysis uses a shared-period Markov Chain Monte Carlo fit of sinusoids to both light curves to extract the period, amplitudes, and phase lag that place HD 203030B on the T-dwarf side of this divide.
What would settle it
Observe HD 203030B for at least two or three full rotations at the same two wavelengths. If the 56-degree phase lag does not repeat from cycle to cycle, or if the 1.39 μm amplitude is not consistently larger than the 1.27 μm amplitude, the cloud-sedimentation interpretation fails; a stable zero phase lag with equal amplitudes would instead place it in the field-L-dwarf regime. Because a non-sinusoidal spot geometry can also mimic a phase offset, phase-resolved spectroscopy across at least one full rotation would test whether the same physical features produce both light curves.
Extended reading notes
Core claim
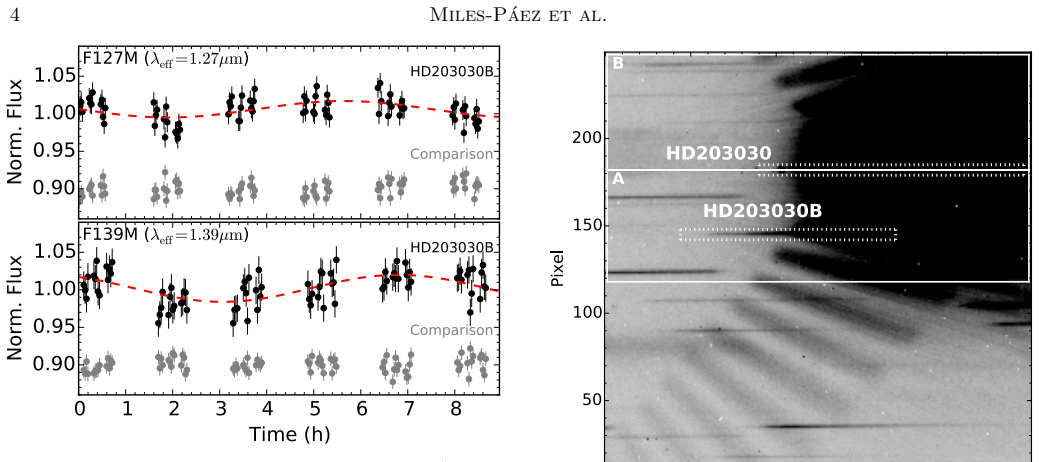
The paper's central claim is that HD 203030B's rotational modulation is wavelength-dependent in a way that field L dwarfs are not: the 1.39 μm water-band light curve has a larger amplitude (1.7±0.4%) and lags the 1.27 μm continuum curve (1.1±0.3%) by 56±28 degrees. On the authors' interpretation, this is a vertical structure signature: the patchy cloud deck responsible for the continuum modulation sits below the water-vapor opacity level, so the two wavelengths sample cloud features at different altitudes and, in a rotating atmosphere, may trace features at different longitudes. They connect this to the object's cool effective temperature (~1040 K) and low surface gravity, which push the top cloud deck downward relative to the water column while the spectrum still appears L-type. They further contend that this condensate/gas altitude separation can explain enhanced variability amplitudes seen in low-gravity L dwarfs and should make the 1.20–1.34 μm window the most promising place to look for variability in young giant planets.
Load-bearing premise
The inference rests on the roughly two-sigma differences in amplitude and phase between the two filter light curves being real atmospheric signals rather than noise, a non-sinusoidal spot shape, or an artifact of fitting brief and sparsely sampled data with a single sinusoid.
Editorial extensions
If this is right
- The measured 7.5-hour period adds HD 203030B to the population of young substellar objects with rotation periods around 10 hours, supporting the broader finding that young brown dwarfs rotate more slowly than field-age ones.
- If the cloud-sedimentation picture is correct, low-gravity L dwarfs and L-type self-luminous giant planets should show their strongest variability in the 1.20–1.34 μm window, which probes deepest into the atmosphere, rather than in the water band.
- The same condensate/gas separation can explain the enhanced variability amplitudes seen in young L dwarfs relative to field L dwarfs, providing a physical mechanism for a previously tentative observational trend.
- The effect should not extend to young T dwarfs, because their condensate clouds have already sunk below the dominant gas-opacity levels, so the young-versus-old amplitude enhancement is specific to L dwarfs rather than a universal substellar phenomenon.
- A cooler effective temperature at fixed spectral type is what pushes the cloud deck below the water column in young late-L dwarfs, meaning wavelength-dependent variability should be more pronounced among the coolest and lowest-gravity L dwarfs.
Reading between the lines
- If the sedimentation picture is right, the amplitude ratio between the water band and the continuum should grow as effective temperature drops and the cloud deck sinks deeper; a survey of young L dwarfs spanning L0 to L9 would reveal a systematic trend in this ratio.
- The 56-degree phase lag, if real, implies the cloud pattern at water-band heights trails the deeper continuum pattern by about 15 percent of a rotation; adding a third, even deeper window near 1.2 μm would test whether the lag increases with altitude separation.
- Because the light curve spans just over one rotation and the 7.5-hour period is close to five times the spacecraft orbit, a longer campaign or a contemporaneous ground-based J-band light curve would cleanly separate the rotation signal from any orbital systematic.
- The same mechanism predicts that directly imaged young planets, observed at favorable inclinations, will show their largest flux modulations in the 1.20–1.34 μm window, which is a concrete wavelength choice for future variability searches on such targets.
Signed reviews
Editorial analysis
A structured set of objections, weighed in public.
Referee Report
Summary. The paper presents HST/WFC3 near-infrared photometric monitoring of the young L7.5 companion HD 203030B in two medium-band filters, F127M (1.27 μm, water-free) and F139M (1.39 μm, inside the water band), over six HST orbits. The authors report a rotation period of 7.5(+0.6/−0.5) h, variability amplitudes of 1.1±0.3% and 1.7±0.4%, and a phase lag of 56±28 degrees between the two light curves. They attribute the wavelength-dependent amplitude and phase differences to a patchy cloud layer that has sunk below the water-vapor opacity level, and they generalize this picture to argue that young low-gravity late-L dwarfs may show T-dwarf-like decoupling of variability in and out of the water band, with implications for the enhanced variability amplitudes seen in low-gravity L dwarfs and young giant planets. The paper also describes grism spectroscopy that was too contaminated by the primary's halo to be usable.
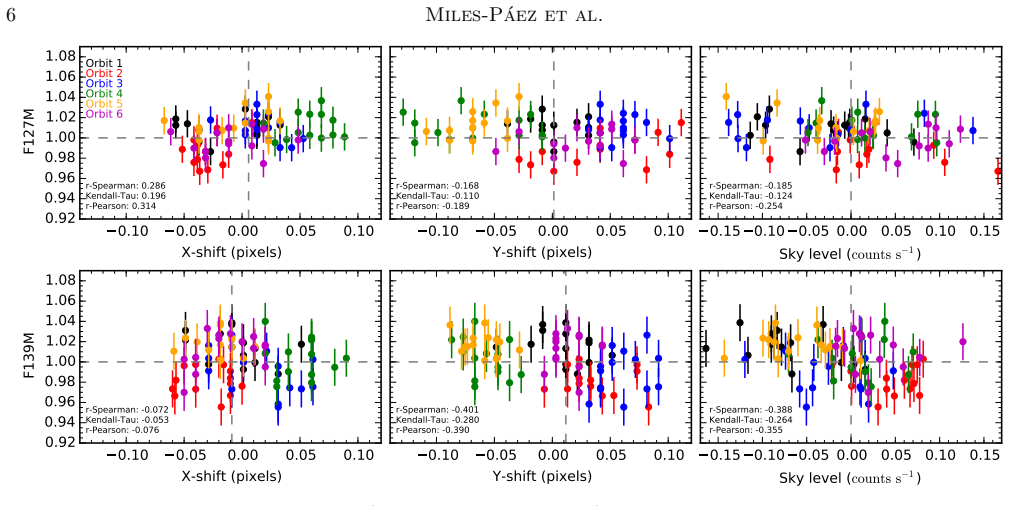
Significance. If the central physical claim holds, the result is significant: HD 203030B would be the first young low-gravity late-L dwarf showing T-dwarf-like wavelength-dependent phase and amplitude behavior, connecting the L/T transition to a cloud-sedimentation effect that depends on surface gravity and effective temperature. The paper is careful in its systematics checks: differential photometry against multiple comparison stars, tests against centroid shifts and sky levels, two independent ramp corrections, and agreement between Lomb-Scargle periodograms and MCMC sinusoid fits. The variability detection itself is well supported. The weakness is that the load-bearing physical interpretation rests on a ~2σ phase lag and a ~1.2σ amplitude difference, with the data covering only about 1.1 rotations.
major comments (3)
- [Section 3.2, Table 1] The wavelength-dependence conclusion rests on a phase lag of 56±28 degrees and an amplitude difference of 0.6±0.5%, which the paper itself labels 'marginal' and 'if real.' Because the data cover only ~1.1 rotations and the two filters are sampled with different cadences within each orbit (F127M every 4 images, F139M every 5), a common non-sinusoidal spot distribution could alias into different best-fit sinusoidal phases in the two filters. The comparison-star flatness test rules out a shared systematic, but it does not validate the sinusoidal shape assumption, since the comparison star is essentially flat. I request an injection test: simulate a wavelength-independent non-sinusoidal light curve (e.g., a two-spot or square-topped modulation), sample it with the actual F127M and F139M time stamps, run the same MCMC sine-fitting procedure, and report the distribution of recovered phase and amplitude differences. This would directly test whether a 56° phase offset can arise from shape/sampling effects alone; without such a test, the physical interpretation is not established beyond the null hypothesis of identical light-curve shape.
- [Abstract and Section 3.2] The abstract states 'We attribute the difference in photometric amplitudes and phases to a patchy cloud layer that is sinking below the level where water vapor becomes opaque,' while Section 3.2 explicitly characterizes the amplitude and phase differences as 'marginal (~2σ)' and conditional ('If real'). Given that the entire physical narrative depends on these differences, the abstract overstates the evidence. The authors should either add the injection-test support requested above or rephrase the abstract, the title, and the conclusions to make the conditional nature of the attribution explicit (e.g., 'may point to' or 'could indicate').
- [Section 3.3, Section 3.4] The proposed cloud-sedimentation interpretation is one of several possible geometric/thermal explanations, but the paper does not provide a quantitative plausibility check that a sinking cloud deck would produce the observed 56-degree phase lag and the larger amplitude in the water band. For example, a longitude-dependent temperature pattern or different spot altitudes could reproduce the same photometric signatures. The manuscript mentions thermal perturbations (Robinson & Marley 2014) as an alternative, but does not assess whether the cloud-sedimentation geometry is quantitatively consistent with the observed phase lag. A short model comparison, or at least an order-of-magnitude estimate linking the phase lag to a vertical cloud offset, would substantially strengthen the central claim.
minor comments (4)
- [Figure 5 caption] The caption lists the F139M effective wavelength as 1.38 μm, while Section 2.1 and Table 1 give λcentral = 1.395 μm; these should be harmonized.
- [Section 2.1] The description 'alternating the F127M and F139M filters every 4 and 5 images, respectively' is ambiguous relative to the stated totals of 78 and 84 images; please clarify the exact sequence per orbit and the total exposure count.
- [Figure 2] The comparison-star light curve in Figure 2 appears to be plotted without error bars; please indicate whether the error bars are smaller than the plot symbols or add them for completeness.
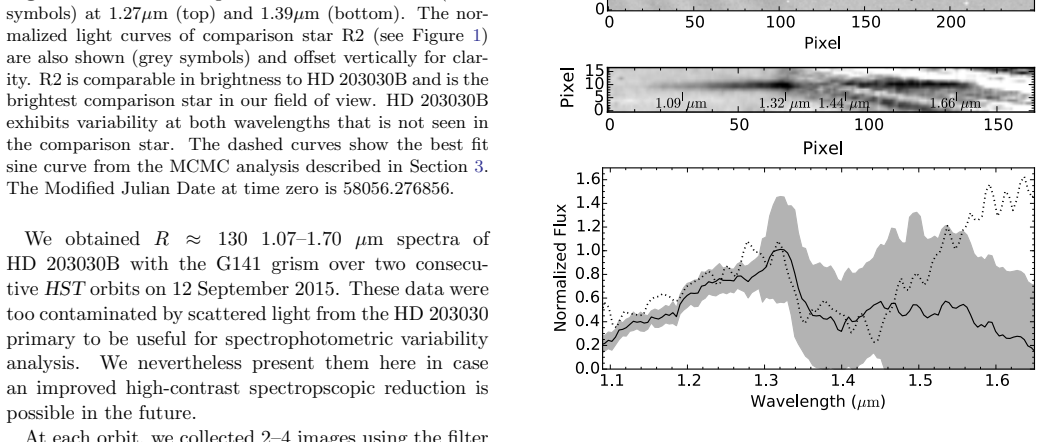
- [Section 2.2] The grism spectroscopy section is presented in detail, but the data are ultimately not used; consider moving this material to an appendix or shortening it to a brief note, since the current length gives more prominence to the unusable data than they receive in the analysis.
Circularity Check
No significant circularity: the light-curve parameters are measured data products and the cloud-sedimentation interpretation is anchored in external atmospheric models and independent comparative observations.
full rationale
The paper's quantitative results — period 7.5 h, amplitudes 1.1% and 1.7%, phase lag 56 deg — are obtained by fitting a sinusoid to the photometry; nothing in the fitting defines the conclusion in terms of itself. The subsequent attribution to a patchy cloud layer sinking below the water-vapor opacity level is an interpretive comparison with external atmospheric models (Marley et al. 2012; Robinson & Marley 2014) and with previously published HST/WFC3 observations of other L and T dwarfs, not a quantity extracted from the same fit. The paper explicitly flags the wavelength-dependent amplitude and phase differences as marginal (~2 sigma) and conditional ('If real...'), so the interpretive claim is not presented as forced by the fit. Self-citations to the Cloud Atlas program appear when comparing with prior variability measurements, but these are comparative data points rather than a circular justification of the present detection; the central measurement is self-contained and cross-checked against a comparison star and a deterministic ramp model. The main vulnerability is statistical marginality and the sinusoidal ansatz, which are correctness risks, not circularity.
Assumptions & free parameters
free parameters (5)
- Shared rotation period P =
7.5 (+0.6/-0.5) h
- F127M sine amplitude A1 =
1.1 +/- 0.3%
- F139M sine amplitude A2 =
1.7 +/- 0.4%
- Phase lag phi2 - phi1 =
56 +/- 28 degrees
- Aperture radius and reference star selection =
2 pixels, R1-R3
assumptions (5)
- domain assumption HD 203030B is a 30-150 Myr old L7.5 dwarf with mass 8-15 Jupiter masses and effective temperature 1040 +/- 50 K.
- domain assumption Lower surface gravity at the same spectral subtype implies cooler effective temperature and different cloud heights, as in Marley et al. 2012.
- domain assumption The vertical cloud and water-opacity structure of L/T dwarf atmospheres is described by the adopted equilibrium cloud models, such as Ackerman and Marley 2001 and Yang et al. 2015.
- domain assumption The observed photometric periodicity is due to rotation and the light curve shape is adequately represented by a single sinusoid.
- domain assumption Differential photometry against reference stars R1-R3 removes the HST charge-trapping ramp and other instrumental systematics.
Cite this review
Pith. "Pith review of Cloud Atlas: Variability in and out of the Water Band in the Planetary-mass HD 203030B Points to Cloud Sedimentation in Low-gravity L Dwarfs." pith.science (2026). https://pith.science/paper/RFN5LVFZ
@misc{pith2026190809403,
  author       = {Pith},
  title        = {Pith review of: Cloud Atlas: Variability in and out of the Water Band in the Planetary-mass HD 203030B Points to Cloud Sedimentation in Low-gravity L Dwarfs},
  year         = {2026},
  howpublished = {\url{https://pith.science/paper/RFN5LVFZ}},
  note         = {Machine review of arXiv:1908.09403}
}
abstract
We use the Wide Field Camera 3 on the {\sl Hubble Space Telescope} to spectrophotometrically monitor the young L7.5 companion HD~203030B. Our time series reveal photometric variability at 1.27\,$\mu$m and 1.39\,$\mu$m on time scales compatible with rotation. We find a rotation period of $7.5^{+0.6}_{-0.5}$ h: comparable to those observed in other brown dwarfs and planetary-mass companions younger than 300 Myr. We measure variability amplitudes of $1.1\pm0.3\%$ (1.27\,$\mu$m) and $1.7\pm0.4\%$ (1.39\,$\mu$m), and a phase lag of 56$^\circ\pm$28$^\circ$ between the two light curves. We attribute the difference in photometric amplitudes and phases to a patchy cloud layer that is sinking below the level where water vapor becomes opaque. HD 203030B and the few other known variable young late-L dwarfs are unlike warmer (earlier-type and/or older) L dwarfs, for which variability is much less wavelength-dependent across the 1.1--1.7$\mu$m region. We further suggest that a sinking of the top-most cloud deck below the level where water or carbon monoxide gas become opaque may also explain the often enhanced variability amplitudes of even earlier-type low-gravity L dwarfs. Because these condensate and gas opacity levels are already well-differentiated in T dwarfs, we do not expect the same variability amplitude enhancement in young vs.\ old T dwarfs.
Figures

Figures from the paper (3 more)


Reference graph
Works this paper leans on
- [1]
-
[2]
H., Alexander, D
Allard, F., Hauschildt, P. H., Alexander, D. R., Tamanai, A., & Schweitzer, A. 2001, ApJ, 556, 357
2001
- [3]
- [4]
- [5]
- [6]
-
[7]
Barenfeld, S. A., Bubar, E. J., Mamajek, E. E., & Young, P. A. 2013, ApJ, 766, 6
work page 2013
-
[8]
K., Charbonneau, D., D´ esert, J.-M., et al
Berta, Z. K., Charbonneau, D., D´ esert, J.-M., et al. 2012, ApJ, 747, 35
work page 2012
Show all 51 references
-
[9]
A., Vos, J., Buenzli, E., et al
Biller, B. A., Vos, J., Buenzli, E., et al. 2018, AJ, 155, 95
2018
-
[10]
P., Liu, M
Bowler, B. P., Liu, M. C., Shkolnik, E. L., & Dupuy, T. J. 2013, ApJ, 774, 55
2013
-
[11]
N., & Flateau, D
Buenzli, E., Apai, D., Radigan, J., Reid, I. N., & Flateau, D. 2014, ApJ, 782, 77
2014
-
[12]
S., et al
Buenzli, E., Saumon, D., Marley, M. S., et al. 2015, ApJ, 798, 127
2015
-
[13]
B., Lunine, J
Burrows, A., Hubbard, W. B., Lunine, J. I., & Liebert, J. 2001, Reviews of Modern Physics, 73, 719
2001
-
[14]
2004, A&A, 425, L29
Chauvin, G., Lagrange, A.-M., Dumas, C., et al. 2004, A&A, 425, L29
2004
-
[15]
2005, A&A, 438, L29
Chauvin, G., Lagrange, A.-M., Zuckerman, B., et al. 2005, A&A, 438, L29
2005
-
[16]
J., Liu, M
Dupuy, T. J., Liu, M. C., & Ireland, M. J. 2009, ApJ, 699, 168
2009
-
[17]
K., Riedel, A
Faherty, J. K., Riedel, A. R., Cruz, K. L., et al. 2016, ApJS, 225, 10
2016
-
[18]
2016, The Journal of Open Source Software, 1, doi:10.21105/joss.00024 Gaia Collaboration, Prusti, T., de Bruijne, J
Foreman-Mackey, D. 2016, The Journal of Open Source Software, 1, doi:10.21105/joss.00024 Gaia Collaboration, Prusti, T., de Bruijne, J. H. J., et al. 2016, A&A, 595, A1
2016 doi
-
[19]
E., Faherty, J
Gizis, J. E., Faherty, J. K., Liu, M. C., et al. 2012, AJ, 144, 94
2012
-
[20]
E., Dettman, K
Gizis, J. E., Dettman, K. G., Burgasser, A. J., et al. 2015, ApJ, 813, 104 Water-band Photometric Variability of HD 203030B 11
2015
-
[21]
Gregory, P. C. 2005, Bayesian Logical Data Analysis for the Physical Sciences: A Comparative Approach with ‘Mathematica’ Support (Cambridge University Press) K¨ ummel, M., Walsh, J. R., Pirzkal, N., Kuntschner, H., &
2005
-
[22]
2009, PASP, 121, 59
Pasquali, A. 2009, PASP, 121, 59
2009
-
[23]
Lew, B. W. P., Apai, D., Zhou, Y., et al. 2016, ApJL, 829, L32
2016
-
[24]
C., Dupuy, T
Liu, M. C., Dupuy, T. J., & Allers, K. N. 2016, ApJ, 833, 96
2016
-
[25]
C., Magnier, E
Liu, M. C., Magnier, E. A., Deacon, N. R., et al. 2013, ApJL, 777, L20
2013
-
[26]
2006, Chemistry of Low Mass Substellar Objects, ed
Lodders, K., & Fegley, Jr., B. 2006, Chemistry of Low Mass Substellar Objects, ed. Mason, J. W. (Springer Verlag), 1
2006
-
[27]
Lomb, N. R. 1976, Ap&SS, 39, 447
1976
-
[28]
L., Patten, B
Luhman, K. L., Patten, B. M., Marengo, M., et al. 2007, ApJ, 654, 570
2007
-
[29]
Townsend, J. A. 2010, in Proc. SPIE, Vol. 7731, Space Telescopes and Instrumentation 2010: Optical, Infrared, and Millimeter Wave, 77310Z
2010
-
[30]
E., & Bell, C
Mamajek, E. E., & Bell, C. P. M. 2014, MNRAS, 445, 2169
2014
-
[31]
2018, AJ, 155, 11
Manjavacas, E., Apai, D., Zhou, Y., et al. 2018, AJ, 155, 11
2018
-
[32]
Manjavacas, E., Apai, D., Lew, B. W. P., et al. 2019, ApJL, 875, L15
2019
-
[33]
S., Saumon, D., Cushing, M., et al
Marley, M. S., Saumon, D., Cushing, M., et al. 2012, ApJ, 754, 135
2012
-
[34]
A., & Hillenbrand, L
Metchev, S. A., & Hillenbrand, L. A. 2006, ApJ, 651, 1166
2006
-
[35]
A., Heinze, A., Apai, D., et al
Metchev, S. A., Heinze, A., Apai, D., et al. 2015, ApJ, 799, 154 Miles-P´ aez, P. A., Metchev, S., Luhman, K. L., Marengo, M., & Hulsebus, A. 2017, AJ, 154, 262
2015
-
[36]
2014, ApJ, 793, 75
Radigan, J., Lafreni` ere, D., Jayawardhana, R., & Artigau, E. 2014, ApJ, 793, 75
2014
-
[37]
N., Gizis, J
Reid, I. N., Gizis, J. E., & Hawley, S. L. 2002, AJ, 124, 2721
2002
-
[38]
D., & Marley, M
Robinson, T. D., & Marley, M. S. 2014, ApJ, 785, 158
2014
-
[39]
Saumon, D., & Marley, M. S. 2008, ApJ, 689, 1327
2008
-
[40]
Scargle, J. D. 1982, ApJ, 263, 835
1982
-
[41]
D., & Shkolnik, E
Kirkpatrick, J. D., & Shkolnik, E. L. 2018, AJ, 155, 238
2018
-
[42]
2015, ApJL, 809, L29
Scholz, A., Kostov, V., Jayawardhana, R., & Muˇ zi´ c, K. 2015, ApJL, 809, L29
2015
-
[43]
1986, in Proc
Tody, D. 1986, in Proc. SPIE, Vol. 627, Instrumentation in astronomy VI, ed. D. L. Crawford, 733
1986
-
[44]
1993, in Astronomical Society of the Pacific Conference Series, Vol
Tody, D. 1993, in Astronomical Society of the Pacific Conference Series, Vol. 52, Astronomical Data Analysis Software and Systems II, ed. R. J. Hanisch, R. J. V. Brissenden, & J. Barnes, 173
1993
-
[45]
1996, A&A, 308, L29
Tsuji, T., Ohnaka, K., Aoki, W., & Nakajima, T. 1996, A&A, 308, L29
1996
-
[46]
M., Allers, K
Vos, J. M., Allers, K. N., Biller, B. A., et al. 2018, MNRAS, 474, 1041
2018
-
[47]
S., et al
Yang, H., Apai, D., Marley, M. S., et al. 2015, ApJL, 798, L13 —. 2016, ApJ, 826, 8
2015
-
[48]
Zhou, Y., Apai, D., Lew, B. W. P., & Schneider, G. 2017, AJ, 153, 243
2017
-
[49]
Showman, A. P. 2016, ApJ, 818, 176
2016
-
[50]
2018, AJ, 155, 132
Zhou, Y., Apai, D., Metchev, S., et al. 2018, AJ, 155, 132
2018
-
[51]
Zhou, Y., Apai, D., Lew, B. W. P., et al. 2019, AJ, 157, 128
2019
Reviewed August 14, 2026 · model on record in the stance chip above.
Discussion (0). Continue with ORCID to comment.