REVIEW 4 major objections 5 minor 24 references
SCNIFFER: Low-Cost, Automated, Efficient Electromagnetic Side-Channel Sniffing
T0 review · 4 major / 5 minor · reviewed 2026-08-14 · deepseek-v4-flash
Pith's one-line read This paper claims that a fully automated, low-cost electromagnetic side-channel attack can replace expensive manual chip scanning: a greedy gradient search finds a high-leakage point on an $N \times N$ grid in $O(N)$ measurements, and a…
desk verdict A genuinely useful low-cost EM side-channel attack platform with an honest heuristic search; the O(N) claim is empirical, not proven, but the paper's own framing mostly respects that. read the letter →
The pith
A machine-rendered reading of the paper's core claim, the machinery that carries it, and where it could break.
The reading
What carries the argument
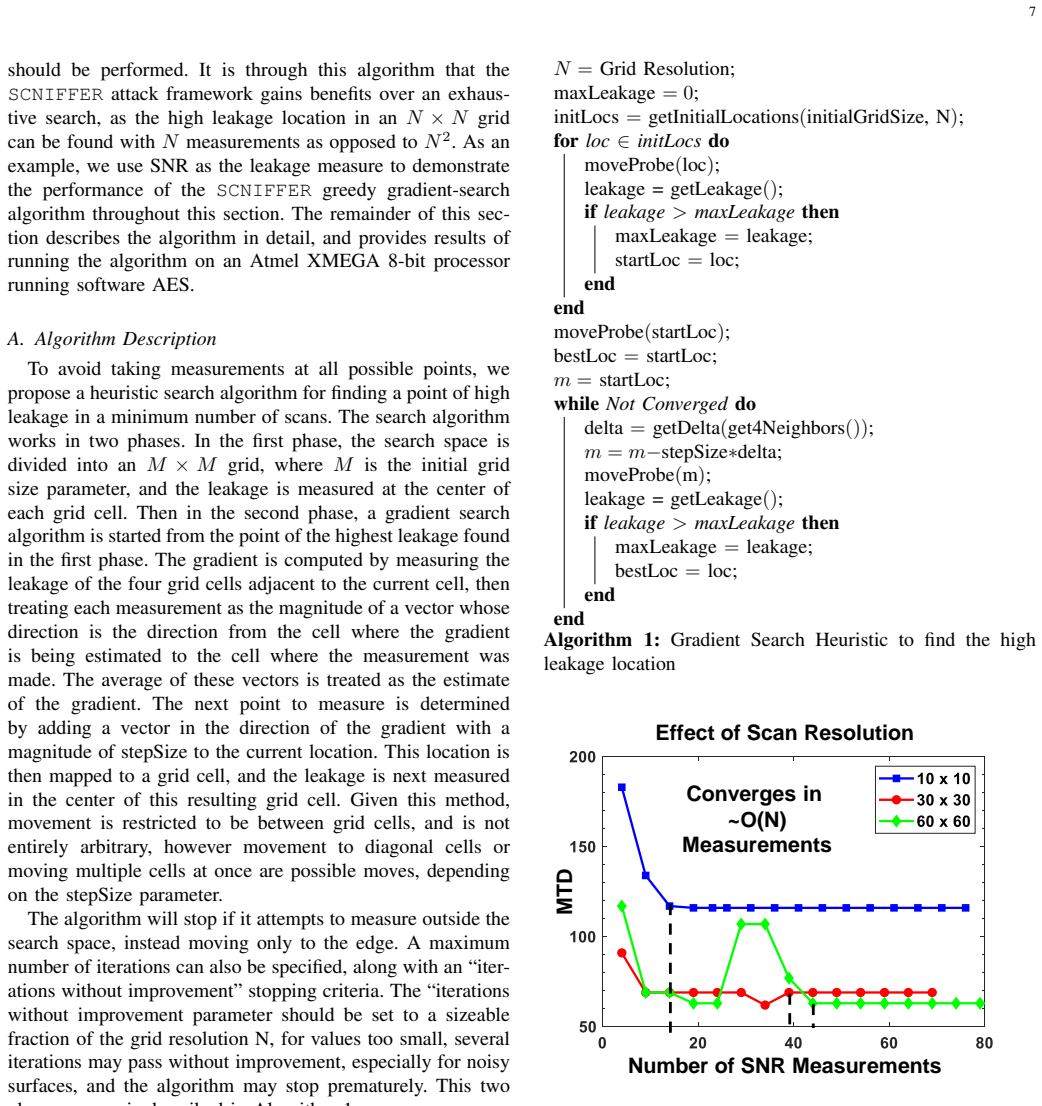
The load-bearing mechanism is the two-phase greedy gradient-search heuristic (Algorithm 1), which treats TVLA or SNR as a scalar leakage surface over the chip. It first samples the surface on an $M \times M$ grid, starts at the best cell, estimates the gradient from the four neighboring cells by treating each leakage measurement as a vector, and moves by a step-size parameter along the averaged direction until an "iterations without improvement" criterion stops it. This mechanism converts a two-dimensional exhaustive search into a near-linear traversal, so the number of measurements grows with the grid resolution $N$ rather than with the number of cells $N^2$.
What would settle it
Take a chip whose full leakage map and per-point MTD are already known, run SCNIFFER many times from different initial grids, and record how many measurements are needed to reach a point whose MTD is within a fixed factor of the chip's best MTD. If the required number grows with the grid size as $N^2$ instead of $N$, or if a meaningful fraction of runs end stuck at a local maximum with a far higher MTD, the central efficiency claim is false. The paper's own Figures 4, 5, and 8b show enough roughness and per-point variance to make this test non-trivial.
Extended reading notes
Core claim
SCNIFFER's central claim is that the spatial search for the point of highest EM information leakage can be done in $O(N)$ measurements instead of $O(N^2)$, where $N \times N$ is the number of candidate probe positions. The paper argues that a coarse initial grid followed by greedy gradient ascent on the TVLA or SNR surface lands at a location whose CEMA minimum-traces-to-disclosure is close to the best point on the chip. Because an exhaustive attack must run a full CEMA at all $N^2$ positions while SCNIFFER runs roughly $N$ leakage measurements and then one CEMA, the total traces needed scale as $N$ times the per-point measurement cost plus the single-point MTD. This makes automated end-to-end EM side-channel attacks practical on hardware that costs two orders of magnitude less than commercial probe stations.
Load-bearing premise
The load-bearing premise is that the leakage surface (TVLA or SNR as a function of probe position) is smooth enough at the chosen grid scale that a coarse start plus local gradient steps reaches a high-leakage point; if the surface has too many sharp false peaks, the $O(N)$ efficiency guarantee fails.
Editorial extensions
If this is right
- At $N \times N$ scan resolution, the search needs about $N$ leakage measurements before a single CEMA, so finer grids and larger chips make the savings over exhaustive search grow linearly with resolution.
- The same two-phase search converges for AES, DES, and RSA on both an 8-bit and a 32-bit microcontroller, suggesting the method does not depend on a particular algorithm's leakage pattern.
- With SNR as the search objective, the location SCNIFFER chooses carries an exploitable-leakage guarantee, because SNR is directly tied to CEMA success rate, while TVLA does not offer that guarantee.
- When the device SNR is low, trace counts for the search grow as $1/\mathrm{SNR}$ but the final CEMA grows as $1/\mathrm{SNR}^2$, so SCNIFFER's advantage over exhaustive search becomes most pronounced for the noisiest targets.
- A fixed masking countermeasure lowers the SNR of the found location but does not stop the search from converging in about $O(N)$ measurements.
Reading between the lines
- Editorial inference: the gradient loop is agnostic to the physical channel, so the same two-phase search could locate leakage for power, optical, acoustic, or on-die voltage measurements, wherever a scalar leakage objective can be evaluated at a position.
- Editorial inference: the method could be run in reverse during chip design, using simulated leakage maps to flag leaky blocks before fabrication, not only to attack finished devices.
- Editorial inference: the >20x comparison against a random attack location would be more informative as a distribution; repeating random location choice many times would show how often SCNIFFER beats the average random start rather than one representative bad point.
- Editorial inference: because the paper's own surface plots show local maxima and per-point variance, a natural robustness extension is to run the search several times per board and report the distribution of achieved MTDs, turning the $O(N)$ claim into a probabilistic guarantee.
Signed reviews
Editorial analysis
A structured set of objections, weighed in public.
Referee Report
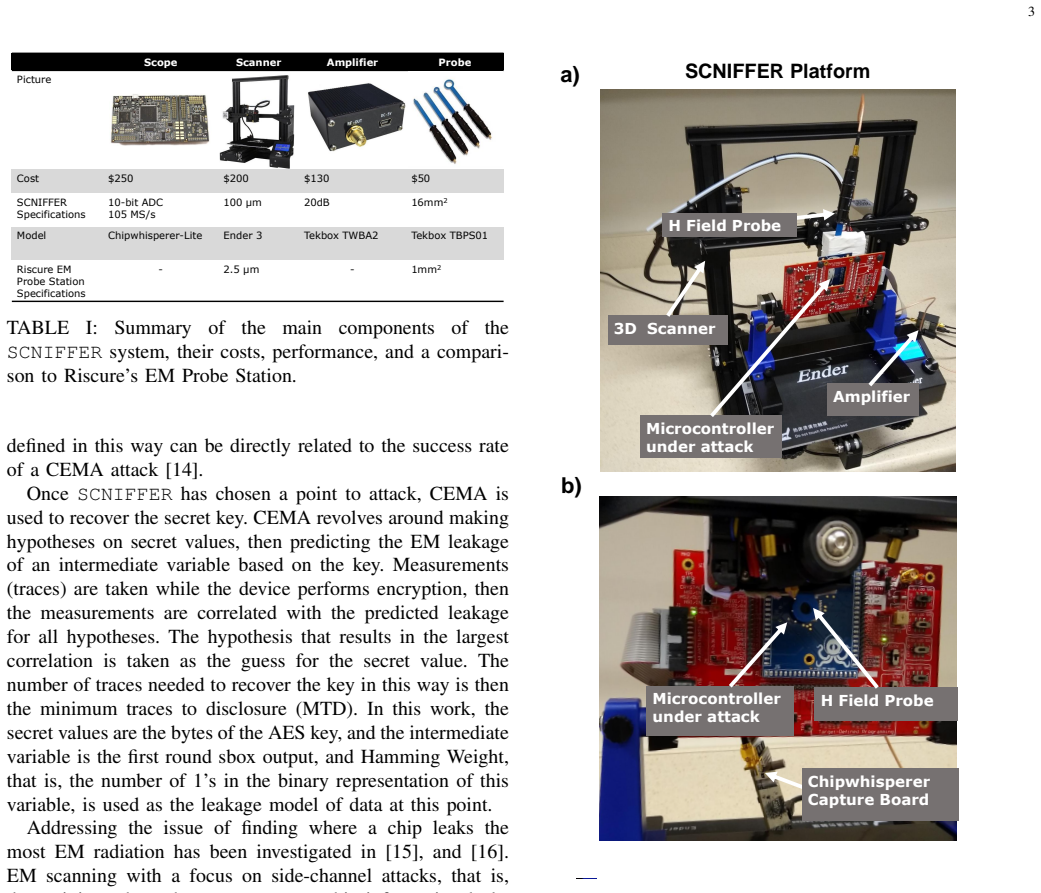
Summary. The paper presents SCNIFFER, an automated electromagnetic side-channel attack platform built from a ~$200 3-D printer, an H-field probe, an amplifier, and a ChipWhisperer capture board. The main technical contribution is a two-phase greedy gradient-search heuristic that, for an N×N grid of possible probe positions, uses TVLA or SNR as a leakage measure to find a point of high leakage in claimed O(N) leakage measurements, after which CEMA is performed at that point. The system is evaluated on AES-128, DES, and RSA running on an 8-bit XMEGA and a 32-bit STM32F3, including a masked AES implementation, with reported convergence in roughly O(N) measurements and MTDs at the found locations that are far below those of poor locations. The paper also presents a trace-count model in Eqs. (1)-(3) and Figure 11 to argue for a large reduction in total traces compared with exhaustive-search attacks.
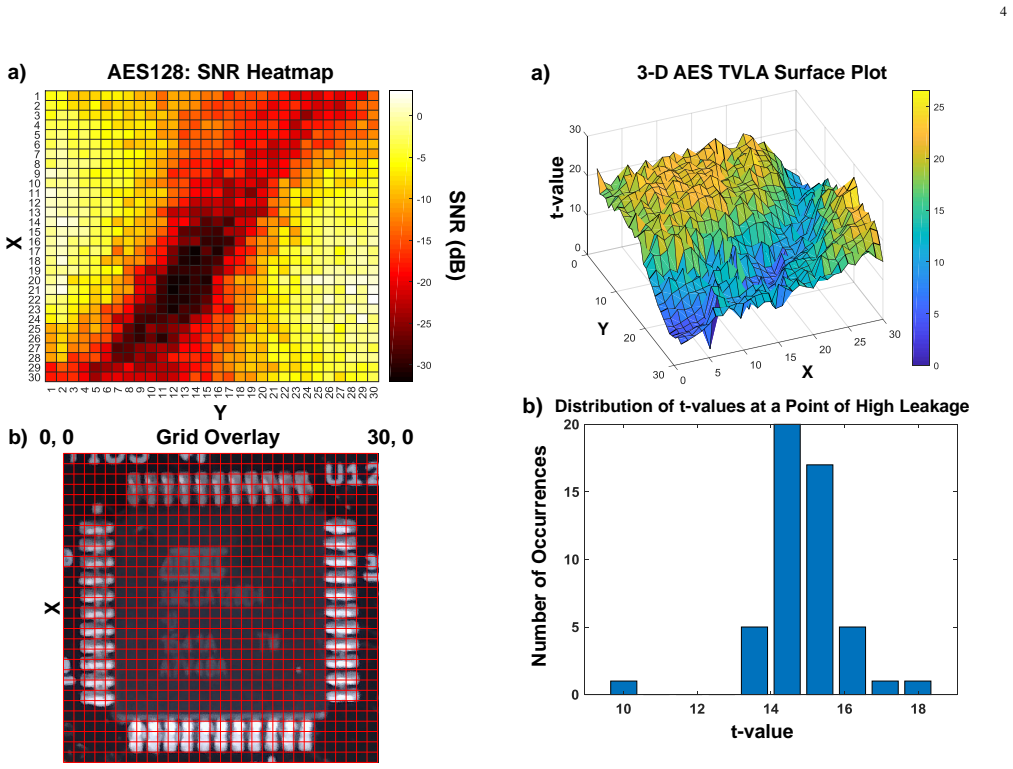
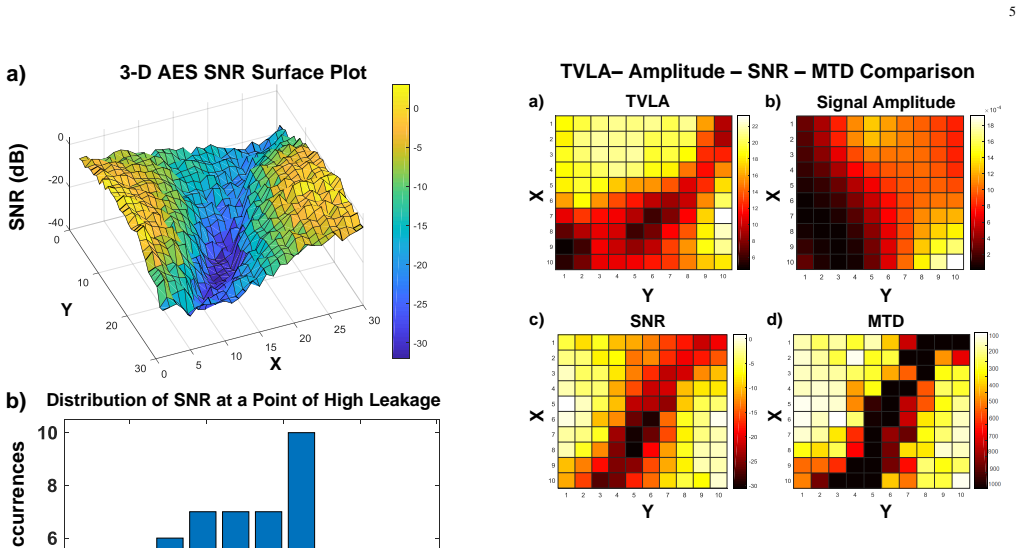
Significance. If the O(N) localization claim holds, SCNIFFER would be a meaningful step toward practical automated EM side-channel attacks: it removes the need for an expert to choose an attack location, uses hardware that is two orders of magnitude cheaper than commercial scanning stations, and is demonstrated across different architectures, algorithms, and a masking countermeasure. The careful comparison of amplitude, TVLA, SNR, and MTD in Figure 6 is a useful contribution, as is the explicit hardware cost breakdown in Table I. The paper is also honest in reporting surface roughness and parameter sensitivity (Figures 4, 5, and 8). However, the central scaling claim is empirical rather than proven, and the trace-reduction model is calibrated to the data rather than independently predictive, so the headline efficiency numbers need substantial qualification before they can be accepted as general results.
major comments (4)
- [V-B, Figures 7 and 8] The O(N) convergence claim is presented as a general property of the algorithm, but the paper's own evidence shows that the leakage surfaces are rough and the search can fail. Section IV states that the TVLA and SNR surfaces are "not smooth or monotonic, as there are many local minima and maxima" (Figures 4(a) and 5(a)), and Figure 8(b) explicitly shows that a 0.54 mm step "gets stuck in a local minimum." Algorithm 1 computes the gradient from four single leakage measurements with no averaging, while Figures 4(b) and 5(b) show wide distributions of repeated measurements at a fixed point. Please state precise conditions (for example, surface smoothness or unimodality at the scale of the initial grid and step, or a bound on measurement noise) under which the O(N) conclusion is expected to hold, and support the scaling in Figure 7 with repeated runs and error bars. Without such support, the O(N) claim is an observation on a few tested surfaces, not a validated property of the method.
- [VI-C, Eqs. (1)-(3), Figure 11] The trace-count model is circular with respect to the claimed ~100x reduction. The text says the constants k0, k1, and c0 are "chosen such that the models match the results presented," so Eqs. (1)-(3) and Figure 11 are a fit to the data they are used to explain, not an independent prediction. To make the trace-reduction claim load-bearing, the authors should derive the constants from the cited SNR-MTD and TVLA/SNR relations or validate the model out-of-sample, for example by fitting on one chip or algorithm and predicting another, and report confidence intervals. As written, the ~100x reduction is a calibrated description rather than a falsifiable prediction.
- [Table II, Figure 10, Section IV-D] The statements that SCNIFFER converges to "one of the points of highest EM leakage" and that "the location of highest SNR will theoretically be the location of lowest MTD" are stronger than the evidence. Table II shows the SNR-based location gives MTD=134 and the TVLA-based location gives MTD=183, while exhaustive search finds MTD=91 at (3,6); Figure 10 itself notes that the MTD "is not the minimum." In addition, the "theoretically" SNR-MTD statement is asserted without proof; the cited SNR-MTD relation is asymptotic and does not by itself imply pointwise minimization on a finite grid. Please replace these with "a high-leakage point" and "empirically correlated with low MTD."
- [Abstract, Section VI-C] The factor of improvement is stated inconsistently. The abstract claims "~N times" reduction compared with exhaustive MTD analysis, while Section VI-C and Figure 11 claim a ~100x reduction for a 10×10 scan. For an N×N grid, exhaustive MTD analysis performs CEMA at N^2 locations, so a single CEMA is an N^2-fold reduction in CEMA traces before accounting for leakage-measurement traces. The total-trace ratio in Eqs. (1)-(3) depends on SNR and on the fitted constants, so the headline should specify whether it refers to total traces or CEMA-only traces and state the SNR regime and N value for which the claimed factor holds.
minor comments (5)
- [Algorithm 1] In the while loop, "bestLoc = loc;" uses an undefined variable; it should be "bestLoc = m;" to record the current measurement point.
- [Section VI-D, Figure 12 caption] The step size is given as 0.54 mm in the text and 0.84 mm in the caption of Figure 12; the same parameter is reported as 1.14 mm in Figure 8(a). Please ensure the parameter values in the text, captions, and figures are consistent, especially since Figure 8(b) identifies 0.54 mm as a step size that gets stuck in a local minimum.
- [Eqs. (1)-(3)] The constants are not all defined consistently: the text mentions k0, k1, and c0, but Eq. (2) uses c1. Define all constants and state which are calibration parameters and which are intended to be universal.
- [Figure 7] The axes are not fully specified in the text: the caption describes "Leakage vs. number of SNR measurements" while the surrounding discussion refers to MTD. Add explicit axis labels and units, and clarify what the plotted quantity is for each curve.
- [Section III-A] The sentence describing scan times says a 30×30 scan takes ~15 minutes and an amplitude scan takes ~75 minutes; it is unclear whether these times include leakage-measurement trace acquisition for TVLA/SNR or only probe movement. Please clarify.
Circularity Check
The trace-count model in Eqs. (1)-(3) is calibrated to the results it illustrates, but the central O(N) search claim rests on independent experiments rather than on a circular derivation.
-
fitted input called prediction
[Section VI-C, Eqs. (1)-(3), Figure 11]
"where N×N is the resolution of the grid scan, and k0,k1, and c0 are arbitrary constants chosen such that the models match the results presented."
The equations offered as a quantification of SCNIFFER's trace-count advantage are not independent predictions: the constants k0, k1, and c0 are explicitly fitted so that the models match the same experimental results shown in Figure 11. Thus the displayed quantitative agreement is guaranteed by construction rather than being a test of the model. The underlying scaling is nonetheless partly structural, because exhaustive search visits N^2 locations while SCNIFFER visits about N locations, so this is a partial circularity in the presented model, not a complete reduction of the paper's central empirical claim.
full rationale
The paper's main load-bearing claim is the O(N) greedy gradient-search convergence, which is supported by direct measurements on 8-bit and 32-bit microcontrollers across AES, DES, and RSA, and by convergence plots in Figures 7, 8, 12, 13, and 14. That claim is empirical and not derived from a fitted parameter, so it does not reduce by construction. The only explicit circular element is in Section VI-C: Eqs. (1)-(3) use constants explicitly chosen to match the presented results, making the quantitative trace-count curves illustrative rather than predictive. The qualitative ~N or ~N^2 reduction, however, follows from the distinction between exhaustive N^2-point MTD analysis and SCNIFFER's N-point leakage search followed by one CEMA. No load-bearing self-citation was found: the STELLAR citation [4] is background on EM emission mechanisms, and no uniqueness theorem from the authors is used to forbid alternative search strategies. The O(N) guarantee is not proven for arbitrary leakage surfaces; the paper's own Figures 4, 5, and 8(b) show roughness, noise, and a step-size configuration that gets stuck in a local minimum. That is a correctness and generality concern, not a circularity concern, because the claim is explicitly presented as an observed heuristic performance, not as a consequence of the model's fitted constants.
Assumptions & free parameters
free parameters (4)
- k0, k1, c0 (trace-count model constants) =
not reported
- Initial grid size M =
2x2 or 3x3 in most experiments
- Gradient step size =
0.54 mm to 1.14 mm
- Traces per leakage measurement =
400 for TVLA, 1000 for SNR
assumptions (4)
- domain assumption Hamming weight of the first round S-box output is a valid leakage model for the attacked AES/DES/RSA implementations.
- domain assumption TVLA or SNR measured at a point predicts the MTD of a CEMA attack at that point.
- domain assumption The leakage surface is smooth enough at the chosen step size for greedy gradient ascent to reach a high-leakage region.
- domain assumption MTD scales as k0/SNR^2 and leakage-measurement trace counts scale as c0/SNR, with constants independent of the chip.
Cite this review
Pith. "Pith review of SCNIFFER: Low-Cost, Automated, Efficient Electromagnetic Side-Channel Sniffing." pith.science (2026). https://pith.science/paper/PQVAHG6A
@misc{pith2026190809407,
  author       = {Pith},
  title        = {Pith review of: SCNIFFER: Low-Cost, Automated, Efficient Electromagnetic Side-Channel Sniffing},
  year         = {2026},
  howpublished = {\url{https://pith.science/paper/PQVAHG6A}},
  note         = {Machine review of arXiv:1908.09407}
}
abstract
Electromagnetic (EM) side-channel analysis (SCA) is a prominent tool to break mathematically-secure cryptographic engines, especially on resource-constrained IoT devices. Presently, to perform EM SCA on an embedded IoT device, the entire chip is manually scanned and the MTD (Minimum Traces to Disclosure) analysis is performed at each point on the chip to reveal the secret key of the encryption algorithm. However, an automated end-to-end framework for EM leakage localization, trace acquisition, and attack has been missing. This work proposes SCNIFFER: a low-cost, automated EM Side Channel leakage SNIFFing platform to perform efficient end-to-end Side-Channel attacks. Using a leakage measure such as TVLA, or SNR, we propose a greedy gradient-search heuristic that converges to one of the points of highest EM leakage on the chip (dimension: N x N) within O(N) iterations, and then perform Correlational EM Analysis (CEMA) at that point. This reduces the CEMA attack time by ~N times compared to an exhaustive MTD analysis, and >20x compared to choosing an attack location at random. We demonstrate SCNIFFER using a low-cost custom-built 3-D scanner with an H-field probe (<$500) compared to >$50,000 commercial EM scanners, and a variety of microcontrollers as the devices under attack. The SCNIFFER framework is evaluated for several cryptographic algorithms (AES-128, DES, RSA) running on both an 8-bit Atmega microcontroller and a 32-bit ARM microcontroller to find a point of high leakage and then perform a CEMA at that point.
Figures

Figures from the paper (8 more)



Reference graph
Works this paper leans on
-
[1]
P. Kocher, J. Jaffe, and B. Jun, “Differential power analysis,” inAdvances in Cryptology CRYPTO 99 , ser. Lecture Notes in Computer Science, M. Wiener, Ed. Springer Berlin Heidelberg, pp. 388–397
-
[2]
Electromagnetic analysis: Concrete results,
K. Gandolfi, C. Mourtel, and F. Olivier, “Electromagnetic analysis: Concrete results,” in Cryptographic Hardware and Embedded Systems CHES 2001, ser. Lecture Notes in Computer Science, . K. Ko, D. Nac- cache, and C. Paar, Eds. Springer Berlin Heidelberg, pp. 251–261
work page 2001
-
[3]
ElectroMagnetic analysis (EMA): Measures and counter-measures for smart cards,
J.-J. Quisquater and D. Samyde, “ElectroMagnetic analysis (EMA): Measures and counter-measures for smart cards,” in Smart Card Pro- gramming and Security, ser. Lecture Notes in Computer Science, I. Attali and T. Jensen, Eds. Springer Berlin Heidelberg, pp. 200–210
-
[4]
Stellar: A generic em side-channel attack protection through ground-up root-cause analysis,
D. Das, M. Nath, B. Chatterjee, S. Ghosh, and S. Sen, “Stellar: A generic em side-channel attack protection through ground-up root-cause analysis,” in 2019 IEEE International Symposium on Hardware Oriented Security and Trust (HOST) . Los Alamitos, CA, USA: IEEE Computer Society, may 2019, pp. 11–20. [Online]. Available: https://doi.ieeecomputersociety.org...
-
[5]
Stealing keys from pcs using a radio: Cheap electromagnetic attacks on windowed exponentiation,
D. Genkin, L. Pachmanov, I. Pipman, and E. Tromer, “Stealing keys from pcs using a radio: Cheap electromagnetic attacks on windowed exponentiation,” in Cryptographic Hardware and Embedded Systems – CHES 2015, T. G ¨uneysu and H. Handschuh, Eds. Berlin, Heidelberg: Springer Berlin Heidelberg, 2015, pp. 207–228
work page 2015
-
[6]
ECDH key-extraction via low-bandwidth electromagnetic attacks on PCs,
D. Genkin, L. Pachmanov, I. Pipman, and E. Tromer, “ECDH key-extraction via low-bandwidth electromagnetic attacks on PCs,” in Proceedings of the RSA Conference on Topics in Cryptology - CT-RSA 2016 - Volume 9610 . Springer-Verlag New York, Inc., pp. 219–235. [Online]. Available: http://dx.doi.org/10.1007/978-3-319-29485-8 13
-
[7]
Low cost attacks on smart cards
A. Matthews, “Low cost attacks on smart cards.” Next Generation Security Software Ltd. [Online]. Available: https://pdfs.semanticscholar. org/1b5a/48426397d3e5d7d56b35ffe2d8456e29834e.pdf 12
-
[8]
EM side-channel attacks on commercial contactless smartcards using low-cost equipment,
T. Kasper, D. Oswald, and C. Paar, “EM side-channel attacks on commercial contactless smartcards using low-cost equipment,” in Infor- mation Security Applications , ser. Lecture Notes in Computer Science, H. Y . Youm and M. Yung, Eds. Springer Berlin Heidelberg, pp. 79–93
Show all 24 references
-
[9]
IoT goes nuclear: Creating a ZigBee chain reaction,
E. Ronen, A. Shamir, A.-O. Weingarten, and C. OFlynn, “IoT goes nuclear: Creating a ZigBee chain reaction,” in 2017 IEEE Symposium on Security and Privacy (SP) . IEEE, pp. 195–212. [Online]. Available: http://ieeexplore.ieee.org/document/7958578/
2017
-
[10]
The EM sidechannel(s),
D. Agrawal, B. Archambeault, J. R. Rao, and P. Rohatgi, “The EM sidechannel(s),” in Cryptographic Hardware and Embedded Systems - CHES 2002, ser. Lecture Notes in Computer Science, B. S. Kaliski, . K. Ko, and C. Paar, Eds. Springer Berlin Heidelberg, pp. 29–45
2002
-
[11]
Tempest attacks against aes,
C. Ramsay and J. Lohuis, “Tempest attacks against aes,” Technical Report White paper, Fox-IT, Tech. Rep., 2017. [Online]. Available: https://hardwear.io/document/slides-craig-ramsay.pdf
2017
-
[12]
Correlation power analysis with a leakage model,
E. Brier, C. Clavier, and F. Olivier, “Correlation power analysis with a leakage model,” in Cryptographic Hardware and Embedded Systems - CHES 2004, ser. Lecture Notes in Computer Science, M. Joye and J.-J. Quisquater, Eds. Springer Berlin Heidelberg, pp. 16–29
2004
-
[13]
Test vector leakage assessment (tvla) methodology in practice,
G. Becker, J. Cooper, E. DeMulder, G. Goodwill, J. Jaffe, G. Kenworthy, T. Kouzminov, A. Leiserson, M. Marson, P. Rohatgi et al., “Test vector leakage assessment (tvla) methodology in practice,” in International Cryptographic Module Conference , vol. 1001, 2013, p. 13
2013
-
[14]
Hardware countermeasures against DPA a statistical analysis of their effectiveness,
S. Mangard, “Hardware countermeasures against DPA a statistical analysis of their effectiveness,” in Topics in Cryptology CT-RSA 2004 , ser. Lecture Notes in Computer Science, T. Okamoto, Ed. Springer Berlin Heidelberg, pp. 222–235
-
[15]
Fully time-domain scanning of EM near-field radiated by RF circuits,
Y . Liu and B. Ravelo, “Fully time-domain scanning of EM near-field radiated by RF circuits,”Progress In Electromagnetics Research, vol. 57, pp. 21–46, 2014
2014
-
[16]
Modeling time domain magnetic emissions of ICs,
V . Lomn, P. Maurine, L. Torres, T. Ordas, M. Lisart, and J. Toublanc, “Modeling time domain magnetic emissions of ICs,” in Integrated Circuit and System Design. Power and Timing Modeling, Optimization, and Simulation, ser. Lecture Notes in Computer Science, R. van Leuken and ...
-
[17]
Electromagnetic radiations of fpgas: High spatial resolution cartography and attack on a cryptographic module,
L. Sauvage, S. Guilley, and Y . Mathieu, “Electromagnetic radiations of fpgas: High spatial resolution cartography and attack on a cryptographic module,” ACM Transactions on Reconfigurable Technology and Systems (TRETS), vol. 2, no. 1, pp. 1–24, 2009
2009
-
[18]
Localized electromagnetic analysis of cryptographic implementations,
J. Heyszl, S. Mangard, B. Heinz, F. Stumpf, and G. Sigl, “Localized electromagnetic analysis of cryptographic implementations,” in Topics in Cryptology CT-RSA 2012 , ser. Lecture Notes in Computer Science, O. Dunkelman, Ed. Springer Berlin Heidelberg, pp. 231–244
-
[19]
[Online]
EM probe station: Electromagnetic analysis solution. [Online]. Available: https://www.riscure.com/product/em-probe-station/
-
[20]
[Online]
Creality3d ender-3 3d printer economic ender DIY KITS. [Online]. Available: https://www.creality3d.shop/products/ creality3d-ender-3-pro-high-precision-3d-printer
-
[21]
ChipWhisperer: An open-source platform for hardware embedded security research,
C. OFlynn and Z. D. Chen, “ChipWhisperer: An open-source platform for hardware embedded security research,” in Constructive Side-Channel Analysis and Secure Design , ser. Lecture Notes in Computer Science, E. Prouff, Ed. Springer International Publishing, pp. 243–260
-
[22]
An overview of power analysis attacks against field programmable gate arrays,
O. Standaert, E. Peeters, G. Rouvroy, and J. Quisquater, “An overview of power analysis attacks against field programmable gate arrays,” vol. 94, no. 2, pp. 383–394. [Online]. Available: https://ieeexplore.ieee.org/document/1580507
-
[23]
CC meets fips: A hybrid test methodology for first order side channel analysis,
D. B. Roy, S. Bhasin, S. Guilley, A. Heuser, S. Patranabis, and D. Mukhopadhyay, “CC meets fips: A hybrid test methodology for first order side channel analysis,” IEEE Transactions on Computers, vol. 68, no. 3, pp. 347–361, 2018
2018
-
[24]
Leak me if you can: Does tvla reveal success rate,
D. B. Roy, S. Bhasin, S. Guilley, A. Heuser, S. Patranabis, and D. Mukhopadhyay, “Leak me if you can: Does tvla reveal success rate,” IACR Cryptology ePrint Archive, Tech. Rep., 2016. [Online]. Available: https://eprint.iacr.org/2016/1152
2016
Reviewed August 14, 2026 · model on record in the stance chip above.
Discussion (0). Continue with ORCID to comment.