REVIEW 2 major objections 5 minor 104 references
Review of annealing effects and superconductivity in Fe$_{1+y}$Te$_{1-x}$Se$_x$ superconductors
T0 review · 2 major / 5 minor · reviewed 2026-08-14 · deepseek-v4-flash
Pith's one-line read Annealing in O2 or chalcogen vapors can strip excess iron from Fe1+yTe1−xSex and turn it into a bulk superconductor.
desk verdict A genuinely useful methods review of annealing in Fe1+yTe1-xSex, but the 'totally remove excess Fe' claim overstates what surface STM and residual ICP can prove. read the letter →
The pith
A machine-rendered reading of the paper's core claim, the machinery that carries it, and where it could break.
The reading
What carries the argument
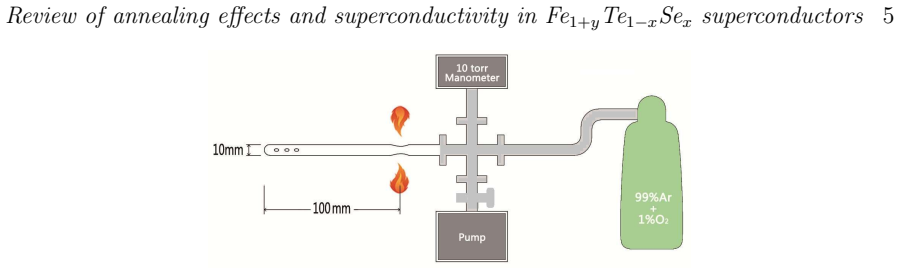
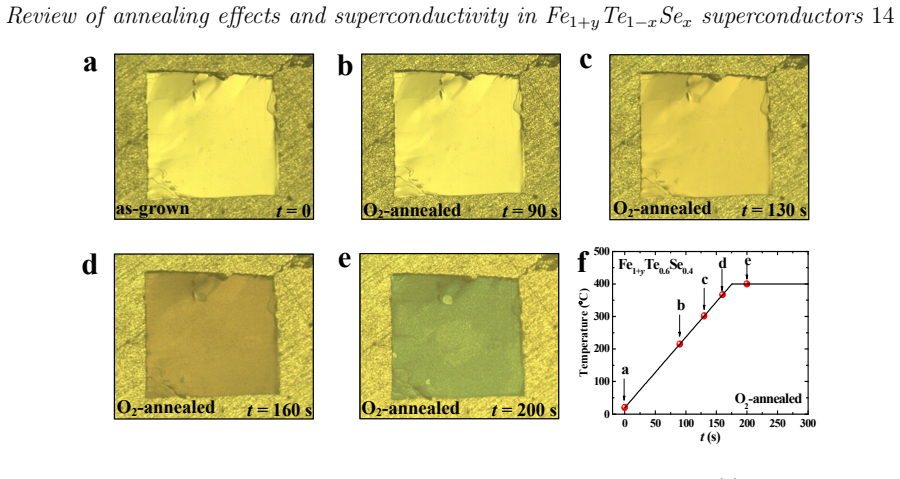
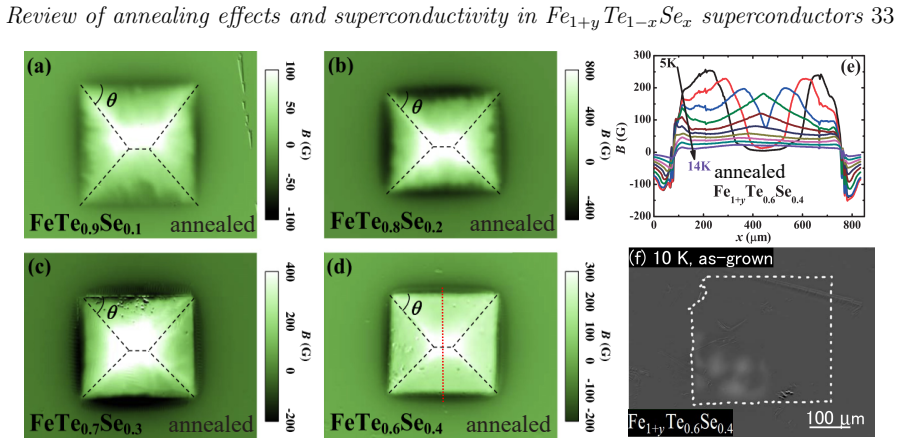
The central object is the interstitial excess Fe atom (the second Fe site, written as y in Fe1+yTe1−xSex) sitting in the van der Waals gap of the Te/Se layers. The load-bearing mechanism is the 'deintercalation reaction': during annealing in a reactive atmosphere, the excess Fe migrates to the crystal surface, reacts with the atmosphere element to form a FeMx surface layer, and is thereby removed from the bulk. This reaction front propagates from the edges and surfaces toward the center, as shown by magneto-optical imaging, and the stoichiometric interior left behind shows bulk superconductivity.
What would settle it
Measure the interstitial Fe occupancy directly in a fully O2-annealed crystal using neutron or resonant X-ray diffraction, or perform STM on a cleaved surface prepared by a different method (for example, cleavage at low temperature or after ion milling) to test whether the Te/Se termination assumption holds; a detectable interstitial occupancy above about 0.1% in the annealed bulk would contradict the total-removal claim.
Extended reading notes
Core claim
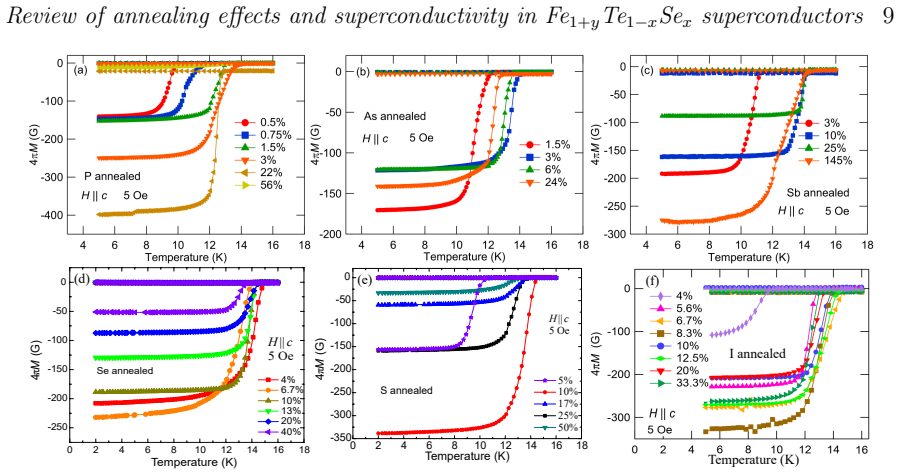
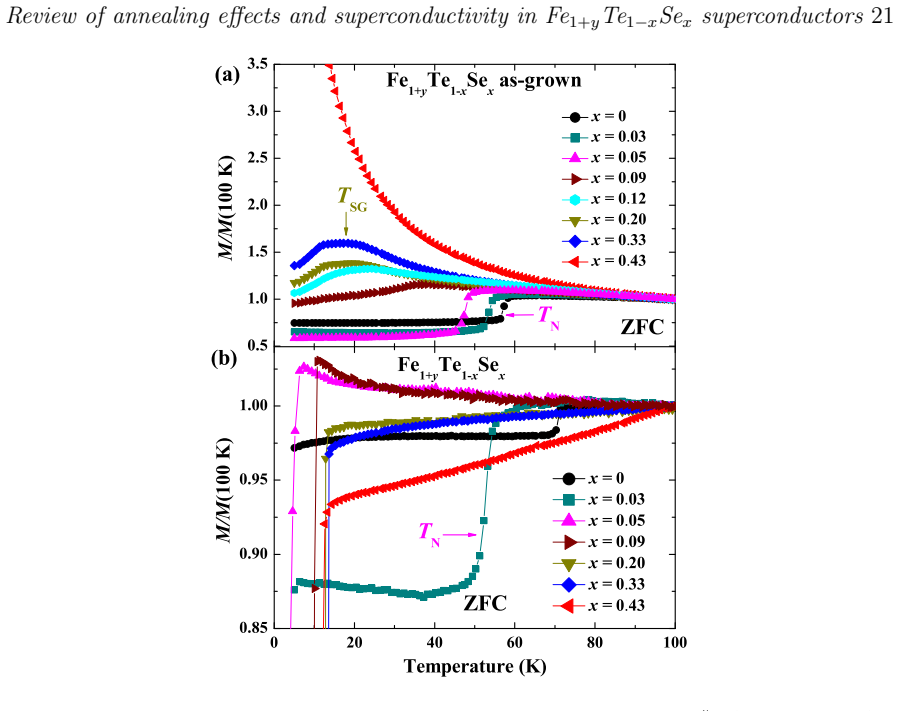
The paper establishes that the excess iron residing in the Te/Se interstitial site acts as an electron donor, a strong local moment, a pair breaker, and a charge-carrier localizer, so its presence masks the intrinsic physics of Fe1+yTe1−xSex. By annealing in a reactive atmosphere, the excess Fe is drawn to the surface, reacts to form an FeMx layer (for example Fe2O3, FeTe2, FeSe, or FeS), and the interior is left with essentially zero interstitial Fe. The evidence is atomic-resolution STM imaging showing the disappearance of bright interstitial spots, together with the emergence of a bulk superconducting signal, a sharp specific-heat jump, and metallic resistivity. The annealed crystals show a revised doping-temperature phase diagram in which antiferromagnetism is confined to x < 0.05, the spin-glass state disappears, and bulk superconductivity appears for x ≥ 0.05 without AFM/SC coexistence.
Load-bearing premise
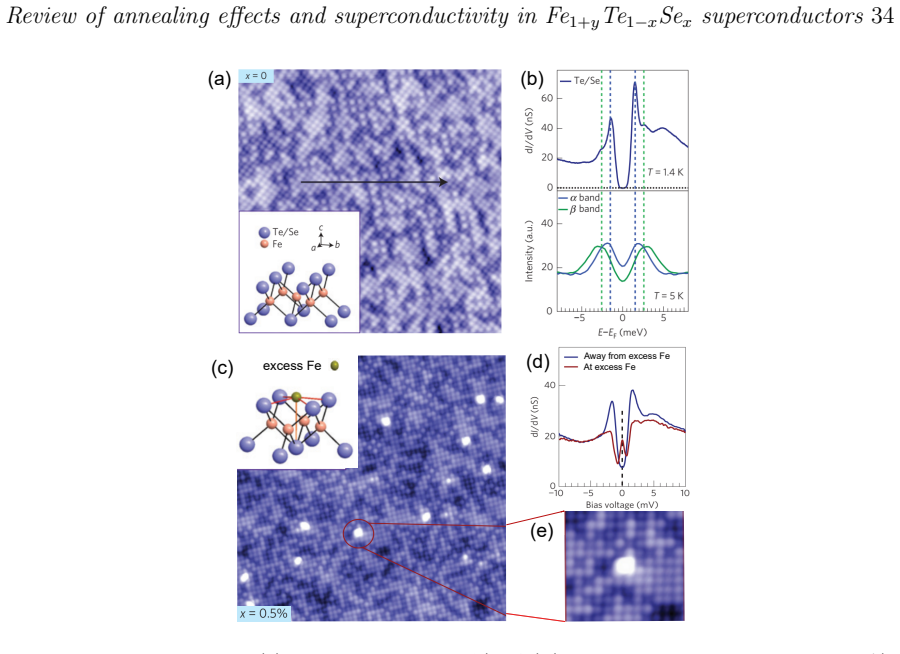
The claim that all excess iron is removed rests on STM images of cleaved surfaces, which assume that the cleave always exposes the Te/Se layer and that every bright spot is an interstitial iron atom, while the paper's own ICP analysis still finds non-stoichiometric iron, attributed to surface oxides.
Editorial extensions
If this is right
- Crystals annealed in O2, S, Se, Te, P, As, Sb, or I at 200–400°C should show bulk superconductivity with Tc ≈ 14.3 K and near-100% diamagnetic shielding, representing the intrinsic response of stoichiometric FeTe1−xSex.
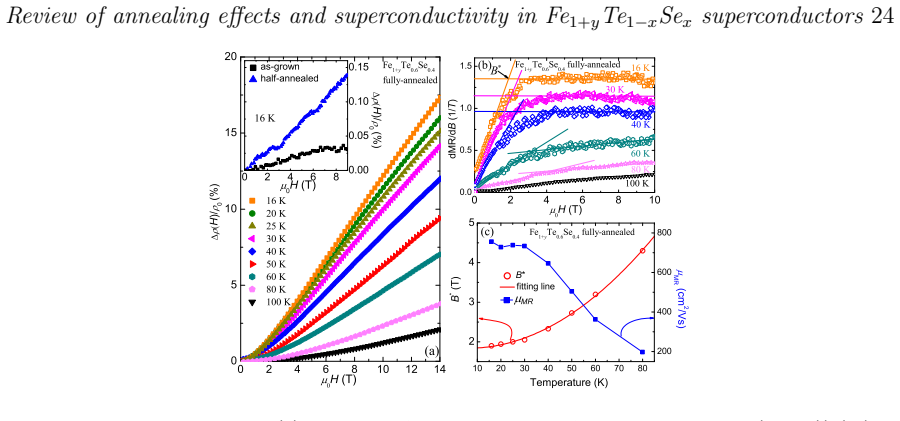
- The metallic resistivity, the sign change of the Hall coefficient at low temperature, and a large linear magnetoresistance consistent with Dirac fermions are intrinsic to the clean compound, not artifacts of the measurement.
- The phase diagram of the stoichiometric compound has no AFM/SC coexistence and no spin-glass region; those features in as-grown crystals are induced by excess Fe.
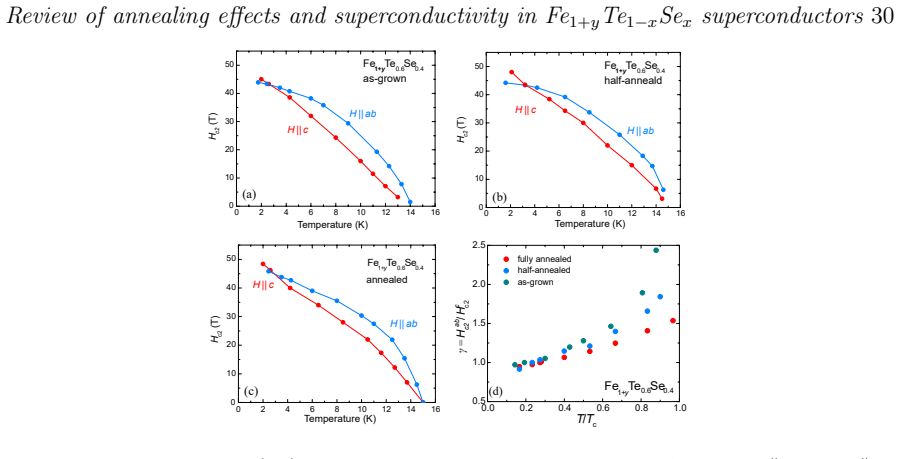
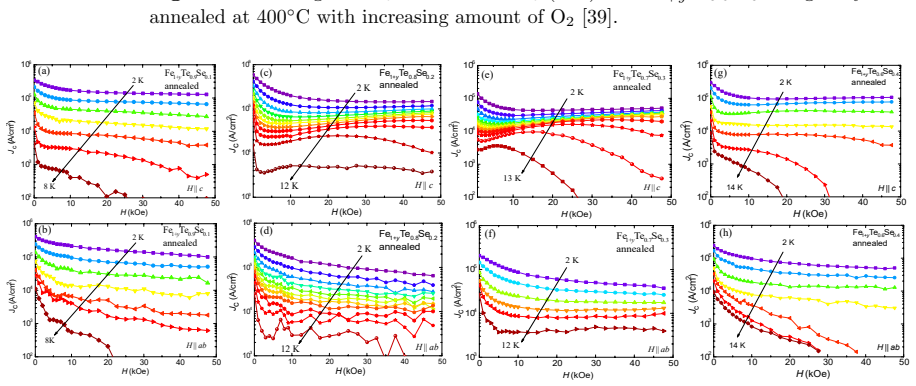
- Reported values of critical current density, upper critical field, and superconducting anisotropy should be re-evaluated on annealed crystals, since excess Fe suppresses Jc and alters the anisotropy.
- Future studies of the topological surface superconductivity and Majorana bound states should use fully annealed crystals, since excess Fe obscures the surface state and contaminates tunneling spectra.
Reading between the lines
- The same deintercalation logic might be extendable to other chalcogenide systems with interstitial magnetic impurities, such as Fe1+yTe1−xSx, where the interstitial site appears even more robust against removal.
- If the STM-cleavage assumption (that the cleaved surface always terminates at the Te/Se layer and each bright spot is an interstitial Fe) ever fails on a particular surface, the 'total removal' claim would need supporting bulk probes beyond magnetization, for instance neutron or resonant X-ray measurements of interstitial site occupancy.
- The paper's mechanism implies that a tunable, time-dependent annealing protocol could produce a controlled gradient of excess Fe in a single crystal, enabling spatially resolved studies of the crossover from filamentary to bulk superconductivity.
- The reported linear magnetoresistance and small Fermi energy on annealed crystals suggest that the stoichiometric compound sits close to a BCS-BEC crossover, and that the carrier density, not just the scattering, is altered by removing interstitial Fe.
Signed reviews
Editorial analysis
A structured set of objections, weighed in public.
Referee Report
Summary. This topical review addresses the long-standing sample dependence of Fe1+yTe1−xSex by cataloguing methods to remove interstitial excess Fe (y) and by arguing that annealing in O2, S, Se, Te, P, As, Sb, or I atmospheres at 200–400 °C removes essentially all excess Fe and induces bulk superconductivity with Tc ≈ 14.3 K. The authors present their own controlled O2 and chalcogen annealing protocols, discuss the mechanism (reaction of mobile excess Fe with the atmosphere at the surface to form FeMx layers), and review effects on magnetism, transport, Hall effect, band structure, upper critical field, anisotropy, critical current, gap structure, and the x–T phase diagram. A revised phase diagram for 'fully annealed' (y=0) crystals is proposed, with bulk superconductivity for x≥0.05 and no AFM/SC coexistence.
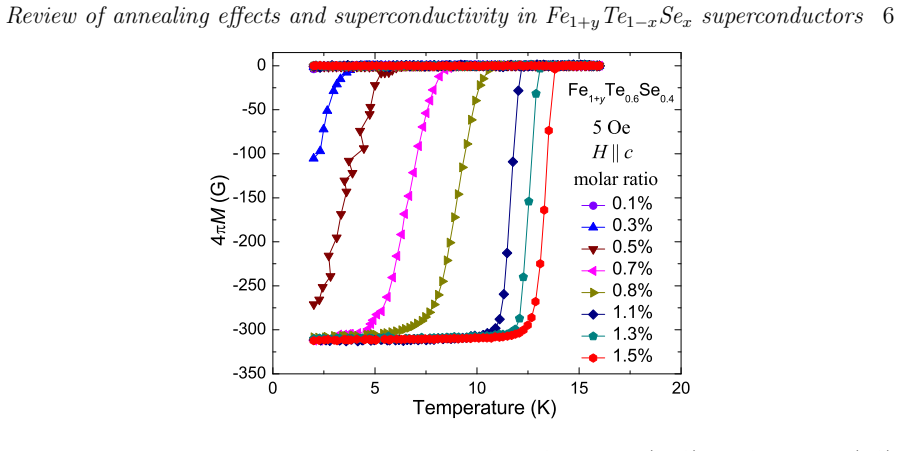
Significance. The review is a valuable consolidation of a large body of work, much of it from the authors' own laboratory, and it makes a practically important and falsifiable set of claims: controlled annealing reproducibly converts non-bulk-superconducting as-grown crystals into homogeneous bulk superconductors with a specific-heat jump of ΔC/γnTc ≈ 3.0 (Fig. 25), full Meissner shielding (Fig. 3), and Jc above 10^5 A/cm2. The MO imaging demonstration that the superconducting region evolves from edges to interior (Fig. 16) and the check that O2 is not incorporated into the bulk (Sec. 2.3) are particularly strong. If the quantitative 'total removal' claim is corrected to a clearly bounded statement, the review will be a useful reference for crystal preparation and for interpreting intrinsic properties.
major comments (2)
- [Sec. 2.3 and Sec. 5] The central claim stated in Sec. 5 that annealing 'can totally remove the excess Fe' is stronger than the evidence presented. The direct evidence in Sec. 2.3 (Fig. 11) is STM imaging of cleaved surfaces, which certifies only the Te/Se termination layer, not the bulk interstitial occupancy; the paper's own ICP analyses of O2-annealed crystals give nonzero excess Fe, and the attribution of this residual to surface oxides is not backed by a quantitative bulk-versus-surface separation. No post-annealing interstitial-site occupancy from bulk neutron diffraction is reported, although [51] provides such data for as-grown crystals. The results firmly establish a strong reduction of excess Fe sufficient for bulk superconductivity (specific-heat jump, Fig. 25, and MO images, Fig. 16), but 'total removal' should be replaced by a bounded or qualified statement.
- [Sec. 4.1 and Fig. 26(d)] The revised phase diagram is presented as the 'y=0' phase diagram for 'fully-annealed (without excess Fe)' crystals. Since the bulk composition of annealed crystals is not quantitatively established (see previous comment), labeling the diagram y=0 overstates the certainty. I recommend relabeling it as the phase diagram of optimally annealed crystals and describing the inferred intrinsic properties as those of strongly deintercalated crystals, with the residual bulk y treated as an upper bound rather than zero.
minor comments (5)
- [Sec. 2.2] The sentence describing the alcoholic beverage effect contains the typo 'excees Fe'; please correct to 'excess Fe' throughout.
- [References] References [35] and [89] are cited as a private communication and a paper in preparation; these should be replaced by published versions or removed, since readers cannot verify the claims.
- [Sec. 3.2 and Fig. 23(c)] The B* analysis fits vF and EF as adjustable parameters; please state this explicitly and, if possible, show the fit residuals or compare with independent ARPES values, because the good agreement alone does not uniquely establish the Dirac-fermion model.
- [Sec. 2.4] The mechanism section would benefit from a schematic summary of the proposed edge-to-center and surface-to-interior evolution, since the MO images in Fig. 16 are the main support but are discussed only in words.
- [Fig. 26] Please define all symbols in the caption and indicate which quantities are taken from susceptibility, resistivity, and Hall measurements.
Circularity Check
No significant circularity: annealing-removal claims rest on external STM, neutron-diffraction, and EELS evidence, and the B* Dirac inference is a model-based consistency check rather than a constructional circle.
full rationale
This manuscript is a topical review rather than a derivation, and I find no step in which a claimed result is equivalent by construction to its input. The central claim that annealing in O2, S, Se, Te, P, As, Sb, and I removes excess Fe rests on multiple independent lines of evidence: STM imaging showing disappearance of bright spots assigned to interstitial Fe, with the assignment citing external work [61] and the Te/Se-only termination citing external work [60]; neutron diffraction showing lattice-constant changes on deintercalation [51], an external structural study; EELS and EPMA identifying surface FeOx layers in external reports [62,42]; and magneto-optical imaging showing a bulk superfluid response. The review's own ICP data still find non-zero Fe in O2-annealed crystals, which the authors attribute to surface oxides; this is a quantitative-support gap for the literal phrase 'totally removed,' but it is a completeness concern, not a circular one. The B* analysis in Sec. 3.2 fits vF and EF to the measured B*(T) curve using an external Dirac-fermion formula [72,75]; this is a consistency check rather than an independent prediction, and it is not circular because the functional form is not constructed from the data being explained. Moreover, the Dirac cone is independently supported by external ARPES [15]. The paper cites the authors' own prior work extensively ([24,39,46-49,57], etc.), as expected for a review of their own annealing program, but the load-bearing facts also have external support, and no equation in the paper reduces to its inputs by definition. Therefore the derivation chain is not circular; concerns about the strength of the 'total removal' evidence belong to correctness risk rather than circularity.
Assumptions & free parameters
free parameters (5)
- O2 annealing dose =
1.5% molar ratio of O2 to nominal Fe
- Te vapor annealing dose =
molar ratio Te/sample approximately 0.1
- Annealing temperature =
400 C, with useful range 200 to 400 C
- Fermi velocity vF from B* fit =
1.1 x 10^5 m/s
- Fermi energy EF from B* fit =
5.5 meV
assumptions (5)
- domain assumption Each bright spot observed in STM on the Te/Se termination layer is an interstitial excess Fe atom.
- domain assumption Cleaved Fe1+yTe1-xSe crystals always terminate at the Te/Se layer, so STM directly images the layer containing excess Fe.
- domain assumption Residual O2, not vacuum, is responsible for the apparent vacuum-annealing effect on excess Fe.
- domain assumption ICP analysis reliably quantifies excess Fe in as-grown crystals but not in annealed crystals, where non-zero Fe is attributed to surface oxides.
- standard math The extended Bean model applies to the rectangular crystals used for Jc extraction.
Cite this review
Pith. "Pith review of Review of annealing effects and superconductivity in Fe$_{1+y}$Te$_{1-x}$Se$_x$ superconductors." pith.science (2026). https://pith.science/paper/JAV6O4M4
@misc{pith2026190809455,
  author       = {Pith},
  title        = {Pith review of: Review of annealing effects and superconductivity in Fe$_1+y$Te$_1-x$Se$_x$ superconductors},
  year         = {2026},
  howpublished = {\url{https://pith.science/paper/JAV6O4M4}},
  note         = {Machine review of arXiv:1908.09455}
}
abstract
Fe$_{1+y}$Te$_{1-x}$Se$_x$ is unique in their structural simplicity, consisting of only FeTe/Se layers, which is favorable for probing the mechanism of superconductivity. Recently, a topological surface superconductivity as well as the Majorana Fermions has been observed, which makes Fe$_{1+y}$Te$_{1-x}$Se$_x$ the first high temperature topological superconductor. Since large size single crystal of Fe$_{1+y}$Te$_{1-x}$Se$_x$ can be easily grown, many researches have been performed. However, a large part of the reported results are under controversy, including the resistivity, susceptibility, Hall effect, gap structure, phase diagram, etc. These controversies are believed to come from the sample-dependent Fe nonstoichiometries, which originate from the partial occupation of the second Fe site (excess Fe) in the Te/Se layer. The excess Fe with valence near Fe$^+$ will provide electron doping into the system. Meanwhile, the excess Fe is also strongly magnetic, which will act as a paring breaker and also localize the charge carriers. Removing the excess Fe is essential to probe the intrinsic properties and mechanism of superconductivity of Fe$_{1+y}$Te$_{1-x}$Se$_x$ compounds. In this topical review, we propose the effective approaches to remove excess Fe in Fe$_{1+y}$Te$_{1-x}$Se$_x$. Furthermore, we discuss the mechanism of annealing based on the evolutions of structure, composition, and morphology with annealing. Moreover, we also review the annealing effects on the normal state and superconducting properties, including the magnetism, transport properties, band structure, $T_{\rm{c}}$, phase diagram, upper critical field, anisotropy, critical current density, gap structure, and superconducting pairing. This review presents not only the optimal way to prepare crystals without excess Fe, but also the intrinsic properties of Fe$_{1+y}$Te$_{1-x}$Se$_x$ without the influence of excess Fe.
Figures

Figures from the paper (30 more)












Reference graph
Works this paper leans on
-
[51]
Rodriguez E E, Stock C, Hsieh P Y, Butch N P, Paglione J and Green M A 2011 Chem. Sci. 2 1782
work page 2011
-
[1]
Hsu F C, Luo J Y, Yeh K W, Chen T K, Huang T W, Wu P M, Lee Y C, Huang Y L, Chu Y Y, Yan D C and Wu M K 2008 Proc. Nat. Acad. Sci. 105 14262
2008
-
[2]
Sales B C, Sefat A S, McGuire M A, Jin R Y, Mandrus D and Mozharivskyj Y 2009 Phys. Rev. B 79 094521
2009
-
[3]
Medvedev S, McQueen T M, Troyan I A, Palasyuk T, Eremets M I, Cava R J, Naghavi S, Casper F, Ksenofontov V, Wortmann G and Felser C 2009 Nat. Mater. 8 630
2009
-
[4]
Burrard-Lucas M, Free D G, Sedlmaier S J, Wright J D, Cassidy S J, Hara Y, Corkett A J, Lancaster T, Baker P J, Blundell S J and Clarke S J 2013 Nat. Mater. 12 15
2013
-
[5]
Lu X F, Wang N Z, Wu H, Wu Y P, Zhao D, Zeng X Z, Luo X G, Wu T, Bao W, Zhang G H, Huang F Q, Huang Q Z and Chen X H 2015 Nat. Mater. 14 325
2015
-
[6]
Hayashi F, Lei H, Guo J and Hosono H 2015 Inorg. Chem. 54 3346
2015
-
[7]
He S, He J, Zhang W, Zhao L, Liu D, Liu X, Mou D, Ou Y B, Wang Q Y, Li Z, Wang L, Peng Y, Liu Y, Chen C, Yu L, Liu G, Dong X, Zhang J, Chen C, Xu Z, Chen X, Ma X, Xue Q and Zhou X J 2013 Nat. Mater. 12 605
2013
Show all 104 references
-
[8]
Ge J F, Liu Z L, Liu C, Gao C L, Qian D, Xue Q K, Liu Y and Jia J F 2015 Nat. Mater. 14 285
2015
-
[9]
Subedi A, Zhang L, Singh D J and Du M H 2008 Phys. Rev. B 78 134514
2008
-
[10]
Xia Y, Qian D, Wray L, Hsieh D, Chen G F, Luo J L, Wang N L and Hasan M Z 2009 Phys. Rev. Lett. 103 037002
2009
-
[11]
Liu T J, Hu J, Qian B, Fobes D, Mao Z Q, Bao W, Reehuis M, Kimber S A J, Proke K, Matas S, Argyriou D N, Hiess A, Rotaru A, Pham H, Spinu L, Qiu Y, Thampy V, Savici A T, Rodriguez J A and Broholm C 2010 Nat. Mater. 9 718
2010
-
[12]
Bao W, Qiu Y, Huang Q, Green M A, Zajdel P, Fitzsimmons M R, Zhernenkov M, Chang S, Fang M, Qian B, Vehstedt E K, Yang J, Pham H M, Spinu L and Mao Z Q 2009 Phys. Rev. Lett. 102 247001
2009
-
[13]
Li S, de la Cruz C, Huang Q, Chen Y, Lynn J W, Hu J, Huang Y L, Hsu F C, Yeh K W, Wu M K and Dai P 2009 Phys. Rev. B 79 054503
2009
-
[14]
Lubashevsky Y, Lahoud E, Chashka K, Podolsky D and Kanigel A 2012 Nat. Phys. 8 309 Review of annealing effects and superconductivity in Fe 1+yTe1−xSex superconductors 36
2012
-
[15]
Zhang P, Yaji K, Hashimoto T, Ota Y, Kondo T, Okazaki K, Wang Z, Wen J, Gu G D, Ding H and Shin S 2018 Science 360 182
2018
-
[16]
Zhang P, Wang Z, Wu X, Yaji K, Ishida Y, Kohama Y, Dai G, Sun Y, Bareille C, Kuroda K, Kondo T, Okazaki K, Kindo K, Wang X, Jin C, Hu J, Thomale R, Sumida K, Wu S, Miyamoto K, Okuda T, Ding H, Gu G D, Tamegai T, Kawakami T, Sato M and Shin S 2019 Nat. Phys. 15 41
2019
-
[17]
Wang D, Kong L, Fan P, Chen H, Zhu S, Liu W, Cao L, Sun Y, Du S, Schneeloch J, Zhong R, Gu G, Fu L, Ding H and Gao H J 2018 Science 362 333
2018
-
[18]
Machida T, Sun Y, Pyon S, Takeda S, Kohsaka Y, Hanaguri T, Sasagawa T and Tamegai T arXiv:1812.08995
-
[19]
Si W, Han S J, Shi X, Ehrlich S N, Jaroszynski J, Goyal A and Li Q 2013 Nat. Commun. 4 1347
2013
-
[20]
Taen T, Tsuchiya Y, Nakajima Y and Tamegai T 2009 Phys. Rev. B 80 092502
2009
-
[21]
Noji T, Suzuki T, Abe H, Adachi T, Kato M and Koike Y 2010 J. Phys. Soc. Jpn. 79 084711
2010
-
[22]
Liu T J, Ke X, Qian B, Hu J, Fobes D, Vehstedt E K, Pham H, Yang J H, Fang M H, Spinu L, Schiffer P, Liu Y and Mao Z Q 2009 Phys. Rev. B 80 174509
2009
-
[23]
Liu Y, Kremer R K and Lin C T 2011 Supercond. Sci. Technol. 24 035012
2011
-
[24]
Sun Y, Taen T, Yamada T, Pyon S, Nishizaki T, Shi Z and Tamegai T 2014 Phys. Rev. B 89 144512
2014
-
[25]
Dong C, Wang H, Li Z, Chen J, Yuan H Q and Fang M 2011 Phys. Rev. B 84 224506
2011
-
[26]
Bonura M, Giannini E, Viennois R and Senatore C 2012 Phys. Rev. B 85 134532
2012
-
[27]
Das P, Thakur A D, Yadav A K, Tomy C V, Lees M R, Balakrishnan G, Ramakrishnan S and Grover A K 2011 Phys. Rev. B 84 214526
2011
-
[28]
Yadav C S and Paulose P L 2009 New J. Phys. 11 103046
2009
-
[29]
Noji T, Imaizumi M, Suzuki T, Adachi T, Kato M and Koike Y 2012 J. Phys. Soc. Jpn. 81 054708
2012
-
[30]
Miao H, Richard P, Tanaka Y, Nakayama K, Qian T, Umezawa K, Sato T, Xu Y M, Shi Y B, Xu N, Wang X P, Zhang P, Yang H B, Xu Z J, Wen J S, Gu G D, Dai X, Hu J P, Takahashi T and Ding H 2012 Phys. Rev. B 85 094506
2012
-
[31]
Okazaki K, Ito Y, Ota Y, Kotani Y, Shimojima T, Kiss T, Watanabe S, Chen C T, Niitaka S, Hanaguri T, Takagi H, Chainani A and Shin S 2012 Phys. Rev. Lett. 109 237011
2012
-
[32]
Zeng B, Mu G, Luo H Q, Xiang T, Mazin I I, Yang H, Shan L, Ren C, Dai P C and Wen H H 2010 Nat. Commun. 1 112
2010
-
[34]
Zhang L, Singh D J and Du M H 2009 Phys. Rev. B 79 012506
2009
-
[35]
Zhang P Private communication
-
[36]
Yin J X, Wu Z, Wang J H, Ye Z Y, Gong J, Hou X Y, Shan L, Li A, Liang X J, Wu X X, Li J, Ting C S, Wang Z Q, Hu J P, Hor P H, Ding H and Pan S H 2015 Nat. Phys. 11 543
2015
-
[37]
Sun Y, Taen T, Tsuchiya Y, Shi Z X and Tamegai T 2013 Supercond. Sci. Technol. 26 015015
2013
-
[38]
Wen J, Xu G, Gu G, Tranquada J M and Birgeneau R J 2011 Rep. Prog. Phys. 74 124503
2011
-
[39]
Sun Y, Tsuchiya Y, Taen T, Yamada T, Pyon S, Sugimoto A, Ekino T, Shi Z X and Tamegai T 2014 Sci. Rep. 4 4585
2014
-
[40]
Sun Y, Taen T, Yamada T, Tsuchiya Y, Pyon S and Tamegai T 2015 Supercond. Sci. Technol. 28 044002
2015
-
[41]
Fujitsu S, Matsuishi S and Hosono H 2012 Int. Mater. Rev. 57 311
2012
-
[42]
Komiya S, Hanawa M, Tsukada I and Maeda A 2013 J. Phys. Soc. Jpn. 82 064710
2013
-
[43]
Hu J, Wang G C, Qian B and Mao Z Q 2012 Supercond. Sci. Technol. 25 084011
2012
-
[44]
Friederichs G M, Wrsching M P B and Johrendt D 2015 Supercond. Sci. Technol. 28 095005
2015
-
[45]
Li X, Sun Y, Zhang Y, Zhou W, Yuan F and Shi Z 2015 PhysicaC 517 16
2015
-
[46]
Sun Y, Tsuchiya Y, Yamada T, Taen T, Pyon S, Shi Z X and Tamegai T 2013 J. Phys. Soc. Jpn. 82 093705 Review of annealing effects and superconductivity in Fe 1+yTe1−xSex superconductors 37
2013
-
[47]
Sun Y, Tsuchiya Y, Yamada T, Taen T, Pyon S, Shi Z X and Tamegai T 2013 J. Phys. Soc. Jpn. 82 115002
2013
-
[48]
Yamada T, Sun Y, Pyon S and Tamegai T 2016 J. Phys. Soc. Jpn. 85 024712
2016
-
[49]
Chen J, Sun Y, Yamada T, Pyon S and Tamegai T 2016 J. Phys. Soc. Jpn. 85 104714
2016
-
[50]
Koshika Y, Usui T, Adachi S, Watanabe T, Sakano K, Simayi S and Yoshizawa M 2013 J. Phys. Soc. Jpn. 82 023703
2013
-
[52]
Zhou W, Sun Y, Zhang S, Zhuang J, Yuan F, Li X, Shi Z, Yamada T, Tsuchiya Y and Tamegai T 2014 J. Phys. Soc. Jpn. 83 064704
2014
-
[53]
Deguchi K, Mizuguchi Y, Kawasaki Y, Ozaki T, Tsuda S, Yamaguchi T and Takano Y 2011 Supercond. Sci. Technol. 24 055008
2011
-
[54]
Okada K, Takagi T, Kobayashi M, Ohnuma H, Noji T, Koike Y, ya Ayukawa S and Kitano H 2018 Jpn. J. Appl. Phys. 57 040305
2018
-
[55]
Yamashita A, Demura S, Tanaka M, Deguchi K, Yamaki T, Hara H, Suzuki K, Zhang Y, Denholme S J, Okazaki H, Fujioka M, Yamaguchi T, Takeya H and Takano Y 2014 Solid State Commun. 200 29
2014
-
[56]
Yamashita A, Demura S, Tanaka M, Fujioka M, Denholme S J, Deguchi K, Yamaki T, Hara H, Suzuki K, Okazaki H, Yamaguchi T, Takeya H and Takano Y 2015 J. Phys. Soc. Jpn. 84 034706
2015
-
[57]
Sun Y, Yamada T, Pyon S and Tamegai T 2016 Sci. Rep. 6 32290
2016
-
[58]
Bendele M, Babkevich P, Katrych S, Gvasaliya S N, Pomjakushina E, Conder K, Roessli B, Boothroyd A T, Khasanov R and Keller H 2010 Phys. Rev. B 82 212504
2010
-
[59]
Solid State Chem
Viennois R, Giannini E, van der Marel D and ern R 2010 J. Solid State Chem. 183 769
2010
-
[60]
Massee F, de Jong S, Huang Y, Kaas J, van Heumen E, Goedkoop J B and Golden M S 2009 Phys. Rev. B 80 140507
2009
-
[61]
Hanaguri T, Niitaka S, Kuroki K and Takagi H 2010 Science 328 474
2010
-
[62]
Hu H, Zuo J M, Zheng M, Eckstein J N, Park W K, Greene L H, Wen J, Xu Z, Lin Z, Li Q and Gu G 2012 Phys. Rev. B 85 064504
2012
-
[63]
Sun Y, Tsuchiya Y, Yamada T, Taen T, Pyon S, Shi Z and Tamegai T 2014 PhysicaC 504 12
2014
-
[64]
Lin W, Ganesh P, Gianfrancesco A, Wang J, Berlijn T, Maier T A, Kalinin S V, Sales B C and Pan M 2015 Phys. Rev. B 91 060513
2015
-
[65]
Sun Y, Tsuchiya Y, Pyon S, Tamegai T, Zhang C, Ozaki T and Li Q 2014Supercond. Sci. Technol. 28 015010
-
[66]
Ducatman S, Fernandes R M and Perkins N B 2014 Phys. Rev. B 90 165123
2014
-
[67]
Thampy V, Kang J, Rodriguez-Rivera J A, Bao W, Savici A T, Hu J, Liu T J, Qian B, Fobes D, Mao Z Q, Fu C B, Chen W C, Ye Q, Erwin R W, Gentile T R, Tesanovic Z and Broholm C 2012 Phys. Rev. Lett. 108 107002
2012
-
[68]
Katayama N, Ji S, Louca D, Lee S, Fujita M, J Sato T, Wen J, Xu Z, Gu G, Xu G, Lin Z, Enoki M, Chang S, Yamada K and M Tranquada J 2010 J. Phys. Soc. Jpn. 79 113702
2010
-
[69]
Eom M J, Na S W, Hoch C, Kremer R K and Kim J S 2012 Phys. Rev. B 85 024536
2012
-
[70]
Chang H H, Luo J Y, Wu C T, Hsu F C, Huang T W, Wu P M, Wu M K and Wang M J 2012 Supercond. Sci. Technol. 25 035004
2012
-
[71]
Hu J, Liu T J, Qian B and Mao Z Q 2013 Phys. Rev. B 88 094505
2013
-
[72]
Abrikosov A A 1998 Phys. Rev. B 58 2788–2794
1998
-
[73]
Abrikosov A A 2000 Europhys. Lett. 49 789
2000
-
[74]
Novoselov K S, Geim A K, Morozov S V, Jiang D, Katsnelson M I, Grigorieva I V, Dubonos S V and Firsov A A 2005 Nature 438 197
2005
-
[75]
Taskin A A, Ren Z, Sasaki S, Segawa K and Ando Y 2011 Phys. Rev. Lett. 107 016801
2011
-
[76]
Xu R, Husmann A, Rosenbaum T F, Saboungi M L, Enderby J E and Littlewood P B 1997 Nature 390 57 Review of annealing effects and superconductivity in Fe 1+yTe1−xSex superconductors 38
1997
-
[77]
Katayama S, Kobayashi A and Suzumura Y 2007 J. Phys. Soc. Jpn. 75 054705
2007
-
[78]
Park J, Lee G, Wolff-Fabris F, Koh Y Y, Eom M J, Kim Y K, Farhan M A, Jo Y J, Kim C, Shim J H and Kim J S 2011 Phys. Rev. Lett. 107 126402
2011
-
[79]
Wang K, Graf D, Lei H, Tozer S W and Petrovic C 2011 Phys. Rev. B 84 220401
2011
-
[80]
Richard P, Nakayama K, Sato T, Neupane M, Xu Y M, Bowen J H, Chen G F, Luo J L, Wang N L, Dai X, Fang Z, Ding H and Takahashi T 2010 Phys. Rev. Lett. 104 137001
2010
-
[81]
Huynh K K, Tanabe Y and Tanigaki K 2011 Phys. Rev. Lett. 106 217004
2011
-
[82]
Chong S V, Williams G V M, Kennedy J, Fang F, Tallon J L and Kadowaki K 2013 Europhys. Lett. 104 17002
2013
-
[83]
Pallecchi I, Bernardini F, Tropeano M, Palenzona A, Martinelli A, Ferdeghini C, Vignolo M, Massidda S and Putti M 2011 Phys. Rev. B 84 134524
2011
-
[84]
Bhoi D, Mandal P, Choudhury P, Pandya S and Ganesan V 2011 Appl. Phys. Lett. 98 172105
2011
-
[85]
Rinott S, Chashka K B, Ribak A, Rienks E D L, Taleb-Ibrahimi A, Le Fevre P, Bertran F, Randeria M and Kanigel A 2017 Sci. Adv. 3 e1602372
2017
-
[86]
152 1135
Kawasaki Y, Deguchi K, Demura S, Watanabe T, Okazaki H, Ozaki T, Yamaguchi T, Takeya H and Takano Y 2012 Solid State Commun. 152 1135
2012
-
[87]
Luetkens H, Klauss H H, Kraken M, Litterst F J, Dellmann T, Klingeler R, Hess C, Khasanov R, Amato A, Baines C, Kosmala M, Schumann O J, Braden M, Hamann-Borrero J, Leps N, Kondrat A, Behr G, Werner J and Buchner B 2009 Nat. Mater. 8 305
2009
-
[88]
Zhao J, Huang Q, de la Cruz C, Li S L, Lynn J W, Chen Y, Green M A, Chen G F, Li G, Li Z, Luo J L, Wang N L and Dai P C 2008 Nat. Mater. 7 953
2008
-
[89]
Pan Y Q in preparation
-
[90]
Liu L, Mikami T, Takahashi M, Ishida S, Kakeshita T, Okazaki K, Fujimori A and Uchida S 2015 Phys. Rev. B 91 134502
2015
-
[91]
Chu J H, Analytis J G, De Greve K, McMahon P L, Islam Z, Yamamoto Y and Fisher I R 2010 Science 329 824
2010
-
[92]
Ishida S, Nakajima M, Liang T, Kihou K, Lee C H, Iyo A, Eisaki H, Kakeshita T, Tomioka Y, Ito T and Uchida S 2013 Phys. Rev. Lett. 110 207001
2013
-
[93]
Bean C P 1964 Rev. Mod. Phys. 36 31
1964
-
[94]
Sun Y, Taen T, Tsuchiya Y, Ding Q, Pyon S, Shi Z X and Tamegai T 2013 Appl. Phys. Express 6 043101
2013
-
[95]
Sun Y, Taen T, Tsuchiya Y, Pyon S, Shi Z X and Tamegai T 2013 Europhys. Lett. 103 57013
2013
-
[96]
Tamegai T, Sun Y, Yamada T and Pyon S 2016 IEEE Trans. Appl. Supercond. 26 1
2016
-
[97]
Sun Y, Pyon S, Tamegai T, Kobayashi R, Watashige T, Kasahara S, Matsuda Y and Shibauchi T 2015 Phys. Rev. B 92 144509
2015
-
[98]
Hu R, Bozin E S, Warren J B and Petrovic C 2009 Phys. Rev. B 80 214514
2009
-
[99]
Lei H and Petrovic C 2011 Phys. Rev. B 83 184504
2011
-
[100]
Sun Y, Pyon S, Yang R, Qiu X, Feng J, Shi Z and Tamegai T 2019 J. Phys. Soc. Jpn. 88 034703
2019
-
[101]
Bourgeois-Hope P, Chi S, Bonn D A, Liang R, Hardy W N, Wolf T, Meingast C, Doiron-Leyraud N and Taillefer L 2016 Phys. Rev. Lett. 117 097003
2016
-
[102]
Sun Y, Kittaka S, Nakamura S, Sakakibara T, Zhang P, Shin S, Irie K, Nomoto T, Machida K, Chen J and Tamegai T 2018 Phys. Rev. B 98 064505
2018
-
[103]
Sun Y, Park A, Pyon S, Tamegai T and Kitamura H 2017 Phys. Rev. B 96 140505
2017
-
[104]
Mizuguchi Y, Deguchi K, Tsuda S, Yamaguchi T and Takano Y 2010 Europhys. Lett. 90 57002
2010
-
[105]
Yamamoto K, Yamazaki T, Yamanaka T, Ueta D, Yoshizawa H and Yaguchi H 2018 J. Phys. Soc. Jpn. 87 054705
2018
Reviewed August 14, 2026 · model on record in the stance chip above.
Discussion (0). Continue with ORCID to comment.