REVIEW 4 major objections 4 minor 1 references
Multiview microscopy of single cells through microstructure-based indirect optical manipulation
T0 review · 4 major / 4 minor · reviewed 2026-08-14 · deepseek-v4-flash
Pith's one-line read Rotating a single cell held by a polymer microtool in holographic optical tweezers, recording fluorescence z-stacks from several directions, and fusing them shortens the apparent axial width of point-like beads from 1.37 µm to 0.58 µm…
desk verdict Solid engineering demonstration of indirect optical micromanipulation for multiview single-cell imaging, with a real but fixable quantitative overreach in the resolution claim. read the letter →
The pith
A machine-rendered reading of the paper's core claim, the machinery that carries it, and where it could break.
The reading
What carries the argument
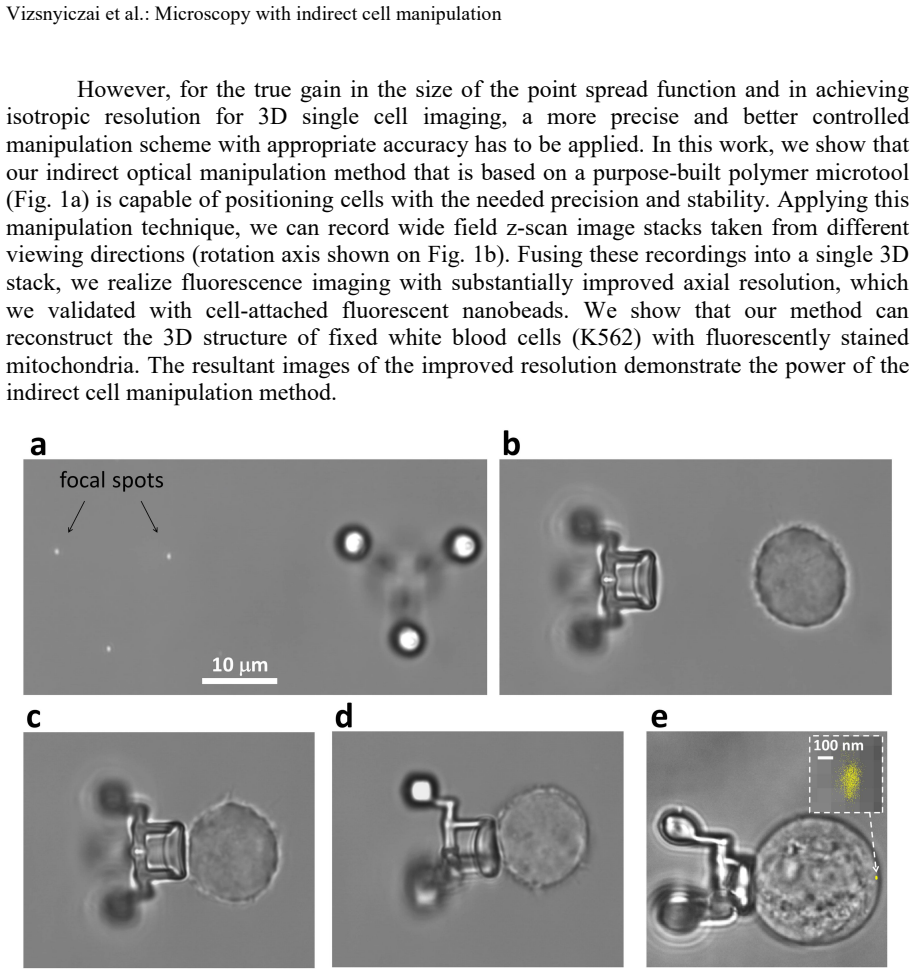
The load-bearing mechanism is the polymer microtool: a two-photon-polymerized SU-8 structure with three 4 µm trapping spheres, a spacer arm, and a concave 8 µm-radius attachment disk, surface-coated through biotin-streptavidin-concanavalin A chemistry so it binds a cell within seconds. Three holographic traps hold the spheres, giving six-degree-of-freedom control while keeping the intense trapping foci about 10 µm from the cell. The imaging pipeline is the second pillar: Richardson-Lucy deconvolution with a measured PSF, correlation-based rigid registration of tilted stacks, and Fourier-domain weighted fusion which combines the orientations to fill in missing axial spatial frequencies.
What would settle it
Record two z-stacks at the same orientation at different times on a bead-decorated cell and register them; if apparent bead centers move by more than the measured roughly 80-160 nm fluctuation, transient bead or cell motion contributes to the reported axial narrowing. A sharper test is to fuse two opposite views (0 and 180 degrees) with a simulated rigid-sample PSF and check whether the predicted axial width near 0.58 µm is reproduced without free fitting parameters.
Extended reading notes
Core claim
The central claim is that indirect optical manipulation with purpose-built microtools can deliver the precision and stability needed for multiview fluorescence microscopy of single cells, and that fusing four views spaced by 45 degrees yields nearly isotropic resolution. Averaged 1/e widths of bead images along the optical axis fall from 1.37 µm in the original stack to 0.58 µm after deconvolution and Fourier-domain fusion, a 2.4-fold reduction, while lateral widths stay close to the diffraction limit. On mitochondria-stained K562 cells, the fused array resolves axial features that a single stack cannot, and its power spectrum becomes approximately radially symmetric instead of elongated along $k_z$. The method needs no mechanical sample rotation and runs on a standard single-objective microscope.
Load-bearing premise
The fluorescent markers used to measure resolution must stay rigidly attached to the cell, and the cell rigidly attached to the microtool, throughout every rotation and z-scan; the paper itself notes that not completely rigid bead attachment could broaden the images and bias the measured improvement.
Editorial extensions
If this is right
- Four fluorescence stacks taken at 0, 45, 90, and 135 degrees are sufficient to reach the best axial width; the paper finds that adding five more intermediate views does not improve it further.
- Because the same high-NA objective both traps and images, any wide-field, confocal, or light-sheet microscope that can host holographic tweezers could adopt the scheme without rebuilding the optics.
- The cell can be rotated about any axis, not just the one fixed axis used in mechanical sample rotation, so viewing directions can be chosen to avoid the manipulator blocking the cell.
- Live-cell dynamic imaging would require faster acquisition, such as scanned light-sheet illumination, and gentler cell-tool attachment chemistry.
Reading between the lines
- If the reported positional stability (about 0.34 degrees of angular fluctuation and tens of nanometers lateral) holds at higher trap power, the same microtool could support correlative fluorescence and electron microscopy of the same cell because the full orientation history is known.
- The Fourier fusion weights each frequency by the square root of its spectral magnitude; using orientation-dependent masks derived from the measured PSF might suppress the 5-15 percent sidelobes the authors observe in Fourier-fused bead images.
- Since only four views are needed, a plausible route to live-cell isotropic imaging is four light-sheet scans of about one second each, replacing the current roughly one minute per orientation wide-field scan.
Signed reviews
Editorial analysis
A structured set of objections, weighed in public.
Referee Report
Summary. The manuscript reports an approach to multiview fluorescence imaging of single cells by indirectly manipulating them with polymer microtools held in holographic optical tweezers. The authors acquire wide-field z-stacks at several rotation angles around the optical axis, deconvolve the stacks with a measured PSF, register them, and fuse them in Fourier space. On 100 nm beads attached to fixed K562 cells, they report that the average 1/e width along the optical axis decreases from 1.37 µm to 0.58 µm after fusion of four views, and they demonstrate the method on MitoTracker-stained mitochondria, where fused arrays separate features along z and show more radially symmetric power spectra. The authors argue that indirect manipulation decouples the trapping light from the cell, provides 6DoF control, and yields sub-100-nm positional stability in the relevant direction.
Significance. If the quantitative resolution claim is reproducible, the method offers a relatively simple single-objective route to near-isotropic fluorescence imaging of single cells in aqueous environments, without 4Pi optics or mechanical sample rotation. Strengths include a direct bead-based measurement of resolution, the use of a measured PSF for deconvolution, and a fusion pipeline based on established multiview practice; the qualitative demonstration on mitochondria is also convincing. The principal weakness is that the headline improvement is not yet pinned down by an independent, parameter-free measurement, and the reported widths lack statistical detail.
major comments (4)
- [Results, 'Resolution improvement along the optical axis'; Figs. 3 and 5] The reported 0.58 µm axial width is the outcome of two parameter choices made on the same bead images: the RL deconvolution is stopped at 26 iterations because the average lateral bead width reaches the theoretical 310 nm (Fig. 3a), and the number of fused directions is set to 4 because Fig. 3c shows a weak minimum at that point. Reporting the same bead images as the final resolution in Fig. 5b therefore combines a selection effect with a noisy, data-dependent minimum. Please provide an independent validation of the resolution claim, for example a separately prepared phantom with known feature spacing or a resolution estimate from Fourier ring correlation, and state the sensitivity of the result to the deconvolution iteration count and to the number of fused directions.
- [Fig. 5b and surrounding text] The average widths in Fig. 5b are reported without error bars, without the number of beads or cells used, and without the bead-selection criterion. This makes it impossible to assess whether the difference between 1.37 µm and 0.58 µm, or the 20% lateral broadening attributed to fusion, is statistically significant. In addition, the fused axial width is still larger than the lateral width, so the abstract's statement of 'isotropic optical resolution' is stronger than the measured values support; please report per-bead statistics with confidence intervals and qualify the claim as near-isotropic unless the residual anisotropy is quantified and shown to be negligible.
- [Results, 'Resolution improvement along the optical axis'; Methods, 'Data evaluation procedure'] The resolution improvement on mitochondria is supported only by visual separation of spots in selected slices (Fig. 6a,b) and by visual inspection of power spectra (Fig. 6c), while the stopping criterion of 60 RL iterations is justified qualitatively as approximating the MTF. Please add a quantitative metric for the organelle data, such as the cutoff of the radially averaged power spectrum or a Fourier ring correlation–style measure, and show how the conclusion depends on the iteration number.
- [Results, bead experiments; Discussion] The authors note that 'not completely rigid attachment of some beads' and cell fluctuation may contribute to lateral broadening. Because the same beads are used to measure the axial improvement, residual bead motion or imperfect registration during multi-orientation acquisition could also bias the fused axial width. Please report the registration residuals and the positional stability over the full multi-stack acquisition time, and, if possible, compare bead widths on individual deconvolved stacks before and after fusion to bound the effect of motion on the reported 0.58 µm value.
minor comments (4)
- [Fig. 3 caption] The caption contains the typos 'decovolution' twice; it also states that widths of 'six selected bead images' are used, but the selection criterion is not given.
- [References] References 40 and 42 are the same article (Kolb et al., J. Biophotonics 8, 239–246, 2015); the citation in the Discussion to 'multiview microscopy setups32,42' should be corrected or replaced with the intended source.
- [Eq. (1)] Equation (1) is difficult to read because the summation indices and subscripts are garbled in the typesetting; please re-typeset it and explicitly define St_i(x) and the norm used.
- [Methods, registration] The registration step is described as always converging within 10 iterations, but no residual translation or rotation values are reported; adding these values would strengthen reproducibility.
Circularity Check
Headline axial-resolution improvement is partly self-selected: the same beads used to choose 4 fusion directions at the 580 nm minimum are then reported as the achieved 0.58 μm resolution.
-
fitted input called prediction
[Results, 'Resolution improvement along the optical axis', Fig. 3c and Fig. 5b]
"Increasing the number of fused images results in a decrease of the axial width to about 600 nm for 9 orientations, displaying a weak minimum (580 nm) at 4 fused directions (0o, 45o, 90o and 135o). ... Although there was no significant difference between 4, 5 or 9 directions, because of the presence of the minimum of the axial width we used the above 4 directions to assess the resolution improvement. The averaged 1/e width along the optical axis was reduced from 1.37 μm (original array) to 0.58 μm (fused array)."
The same bead dataset is used twice: it supplies the axial-width curve from which the fusion count N=4 is selected (as the minimum, 580 nm), and it then supplies the final reported fused width (0.58 μm) for that selected count. The headline 2.4× reduction is therefore the selected minimum of a noisy curve, not an independent resolution measurement. The authors explicitly note that 4, 5, or 9 directions were not significantly different, so the choice of the minimum is what creates the exact 0.58 μm figure. No held-out beads or independent phantom are used.
-
fitted input called prediction
[Results, 'Resolution improvement along the optical axis', Fig. 3a-b and Fig. 5b]
"The halt of the iteration was linked to that number where the average 1/e width of the Gaussian fits of the bead images reaches 310 nm (Fig. 3a) and where the relative difference (Fig. 3b) levels; therefore we stopped the deconvolution after 26 iterations."
The stopping criterion forces the average lateral width of the deconvolved bead images to match the theoretical 310 nm diffraction limit, so the later statement that deconvolution reduced the lateral width is a restatement of the stopping rule rather than an independent measurement. This step does not force the axial result, but it is another instance of using the same bead measurements both to set processing parameters and to quantify the reported resolution.
full rationale
The paper's core demonstration—that rotating a trapped cell with a polymer microtool and fusing multi-view stacks shortens the axial point-spread function—is not circular: the widths are direct image-space measurements, and the mitochondria power spectra independently show broadening along kz. The circularity is confined to the quantitative headline. The fusion count was chosen by looking for a minimum in the axial bead width on the same bead dataset, and the same dataset's minimum (580 nm) is then quoted as the fused resolution (0.58 μm). Similarly, the RL deconvolution stopping criterion forces the lateral bead width to 310 nm, so the reported lateral improvement after deconvolution is a restatement of the stopping rule. These are parameter-selection loops rather than definitional equivalence, and the qualitative multi-view improvement remains independently visible, so the score is moderate rather than extreme. Self-citations to the authors' prior microtool work are descriptive and not load-bearing for the resolution claim.
Assumptions & free parameters
free parameters (3)
- Deconvolution iteration count for bead images =
26
- Deconvolution iteration count for mitochondria images =
60
- Number of fused orientations =
4
assumptions (2)
- domain assumption The cell-microtool complex behaves as a rigid body during rotation.
- domain assumption The measured PSF (from 100 nm nanoholes) accurately represents the system response for all orientations and depths.
Cite this review
Pith. "Pith review of Multiview microscopy of single cells through microstructure-based indirect optical manipulation." pith.science (2026). https://pith.science/paper/27SKWFVH
@misc{pith2026190810746,
  author       = {Pith},
  title        = {Pith review of: Multiview microscopy of single cells through microstructure-based indirect optical manipulation},
  year         = {2026},
  howpublished = {\url{https://pith.science/paper/27SKWFVH}},
  note         = {Machine review of arXiv:1908.10746}
}
read the original abstract
Fluorescent observation of cells generally suffers from the limited axial resolution due to the elongated point spread function of the microscope optics. Consequently, three-dimensional imaging results in axial resolution being several times worse than the transversal. The optical solutions to this problem usually require complicated optics and extreme spatial stability. A straightforward way to eliminate anisotropic resolution is to fuse images recorded from multiple viewing directions achieved mostly by the mechanical rotation of the entire sample. In the presented approach, multiview imaging of single cells is implemented by rotating them around an axis perpendicular to the optical axis by means of holographic optical tweezers. For this, the cells are indirectly trapped and manipulated with special microtools made with two-photon polymerization. The cell is firmly attached to the microtool and is precisely manipulated with 6 degrees of freedom. The total control over the cells position allows for its multiview fluorescence imaging from arbitrarily selected directions. The image stacks obtained this way are combined into one 3D image array with a special image processing algorithm resulting in isotropic optical resolution. The presented tool and manipulation scheme can be readily applied in various microscope platforms.
Figures


Figures from the paper (6 more)


Reference graph
Works this paper leans on
-
[1]
1 Abbondanzieri, E. A., Greenleaf, W. J., Shaevitz, J. W., Landick, R. & Block, S. M. Direct observation of base-pair stepping by RNA polymerase. Nature 438, 460-465, doi:10.1038/nature04268 (2005). 2 Meiners, J. C. & Quake, S. R. Femtonewton force spectroscopy of single extended DNA molecules. Phys Rev Lett 84, 5014-5017, doi:10.1103/PhysRevLett.84.5014 ...
Reviewed August 14, 2026 · model on record in the stance chip above.
Discussion (0). Continue with ORCID to comment.