REVIEW 4 major objections 5 minor 65 references
Measurement-induced phase transition: A case study in the non-integrable model by density-matrix renormalization group calculations
T0 review · 4 major / 5 minor · reviewed 2026-08-14 · deepseek-v4-flash
Pith's one-line read Random measurements switch entanglement from volume to area law
desk verdict First non-integrable lattice demonstration of the measurement-induced transition, but quantitative claims are undercut by a missing truncation benchmark and a drifting mutual-information exponent. read the letter →
The pith
A machine-rendered reading of the paper's core claim, the machinery that carries it, and where it could break.
The reading
What carries the argument
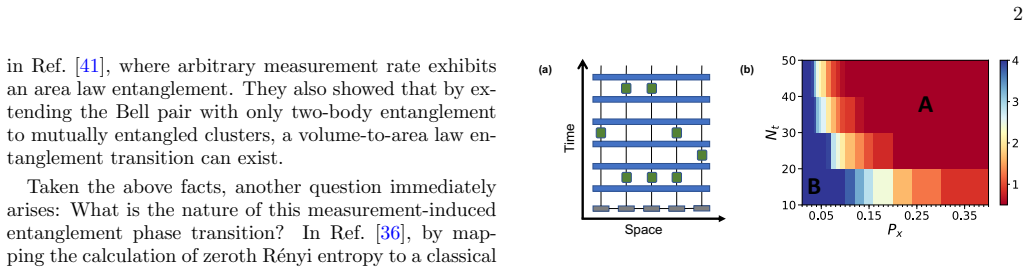
The carrying mechanism is the matrix-product-state time-evolving block decimation simulation of the Bose-Hubbard Hamiltonian $H=-J_0\sum_i(b_i^\dagger b_{i+1}+\mathrm{h.c.})+\frac{U}{2}\sum_i n_i(n_i-1)$, with projective measurements inserted at randomly chosen time layers and spatial sites. Two rates control the dynamics: $N_t$, the number of measured layers per unit time (which sets the scrambling depth between measurements), and $P_x$, the probability a given site is projected on a measured layer. The finite-size scaling ansatz $S(P_x)-S(P_{x,c})=F((P_x-P_{x,c})L^{1/\nu})$ is the instrument that turns the entropy curves into a transition: data collapse yields the quoted critical rate and exponent.
What would settle it
Compute the same quench with successively larger bond dimensions (or a different trotterization) at $N_t=50$, $P_x=0.06$ on $L_0=48$ and check whether the area-law saturated entropy and the data collapse of Eq. (2) are stable; if the entropy at fixed $P_x>P_{x,c}$ decreases systematically with bond dimension, or if the collapse fails when $L_0=48$ data are included at the quoted exponents, the central claim is not supported.
Extended reading notes
Core claim
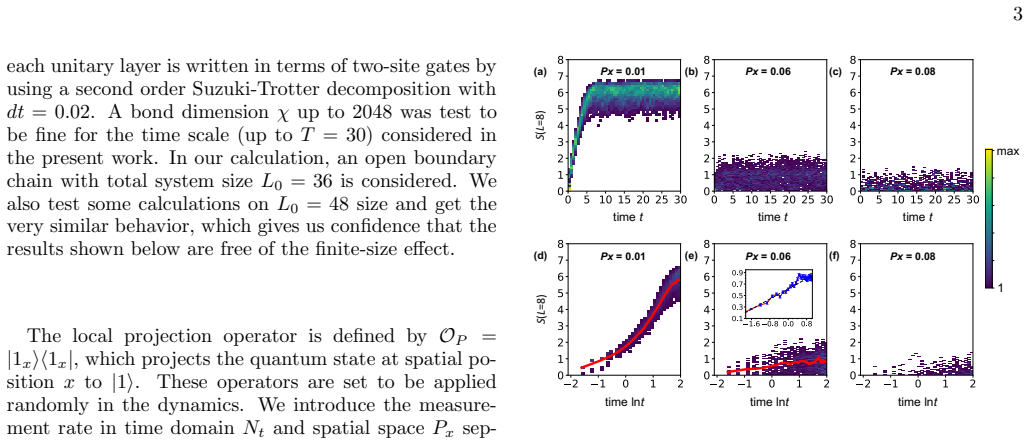
The central claim is that repeated local projective measurements $|1_x\rangle\langle 1_x|$ compete with unitary evolution to produce a genuine dynamical phase transition in the entanglement structure of the post-quench steady state. In the entangling phase, the von Neumann entropy of a subsystem saturates near its volume-law value; in the disentangling phase it saturates at small area-law values. At the transition the entropy grows logarithmically both in time ($S\simeq a\ln t+b$ with $a\approx 0.22$) and in subsystem size ($a\approx 0.21$), and the mutual information between distant sites decays as a power law. A finite-size scaling collapse using $S(P_x)-S(P_{x,c})=F((P_x-P_{x,c})L^{1/\nu})$ gives $P_{x,c}\approx 0.060\pm0.004$ and $\nu\approx 2.00\pm 0.15$. The authors read these results as evidence that the transition belongs to a single universality class shared with random unitary circuit models and, through the boundary percolation value $\nu=2$, may admit a conformal field theory description.
Load-bearing premise
The identification of the phase transition rests on the numerical premise that matrix-product-state simulations with bond dimension up to 2048 over time $T=30$ faithfully capture the post-measurement dynamics on chains of length 36 and 48, and on the assumed one-parameter finite-size scaling form; if truncation error grows under repeated projections or the scaling form is invalid, the extracted $P_{x,c}$ and $\nu$ could be numerical artifacts.
Editorial extensions
If this is right
- The volume-law phase survives small but finite measurement rates in a non-integrable lattice model, so the transition is not an artifact of Clifford or random-unitary circuit structure.
- The extracted exponent $\nu\approx 2$ places the transition in the same universality class as random unitary circuit numerics and the boundary percolation prediction, making a unified CFT description plausible.
- At criticality, scale invariance shows up as logarithmic entropy growth in time and space and as power-law mutual information decay, giving concrete signatures for other models.
- The critical spatial rate grows faster than linearly as $N_t$ decreases, showing that the density of measurements alone ($N_t P_x$) does not set the phase boundary; scrambling between measurements matters.
- The single-site entanglement entropy distribution changes character across the transition, offering a local probe that connects the measurement transition to the thermal-to-MBL transition.
Reading between the lines
- If the mutual-information exponent keeps moving toward the CFT value $\Delta=2$ with system size as the paper's $L_0=36$ to $48$ trend suggests, the apparent non-universality is finite-size, and larger simulations should find $\Delta$ approaching 2.
- The role of randomness in the unitary layers could be tested by replacing the Bose-Hubbard Trotter evolution with a periodic (non-random) drive at fixed $N_t$; if $\nu$ changes, randomness of the unitary gates is essential, and if not, the transition is driven by measurement randomness alone.
- A direct cold-atom realization would use a quantum gas microscope to perform projective number measurements on individual sites; the predicted markers are the crossover of the subsystem entropy from volume to area scaling and the critical logarithmic growth, measurable in principle.
Signed reviews
Editorial analysis
A structured set of objections, weighed in public.
Referee Report
Summary. This paper studies the quench dynamics of a one-dimensional Bose-Hubbard model subject to random local projective measurements, using matrix product states and the time-evolving block decimation algorithm. The authors introduce two tuning parameters, the spatial measurement rate Px and the temporal measurement rate Nt, and map out a two-dimensional phase diagram. They report a volume-to-area-law entanglement phase transition at Px,c≈0.060±0.004 with correlation-length exponent ν≈2.00±0.15 for Nt=50, a logarithmic growth of entanglement in time and in subsystem size at criticality, a power-law decay of mutual information, and a single-site entropy distribution that distinguishes the two phases. The paper interprets these results as evidence for a universal measurement-induced entanglement transition in a non-integrable lattice model, possibly describable by a conformal field theory.
Significance. If the numerical results are correct, this is an important extension of measurement-induced entanglement transitions from random circuit models to a concrete, non-integrable lattice Hamiltonian. The paper provides a useful demonstration that a stable volume-law phase survives finite measurement rates in a bosonic lattice model, and the data collapse with stated parameters is a credible first step. The L0=48 test, the focus on a microscopic lattice model, and the comparison with percolation/CFT expectations are valuable. However, the central quantitative claims rest on numerical simulations whose truncation error is never quantified, and the scaling analysis is used both to locate and to characterize the critical point. These issues must be addressed before the paper can be considered fully convincing.
major comments (4)
- [Section II, bond-dimension statement] The central numerical premise — that TEBD with bond dimension up to 2048 faithfully simulates the post-measurement dynamics up to T=30 — is asserted but not demonstrated. The text states that χ=2048 was "test to be fine", yet no discarded-weight curves, no S versus χ comparisons, and no dependence of the extracted Px,c on χ are shown. This is particularly serious on the volume-law side of the transition (e.g., Px=0.02–0.04 in Fig. 3), where a rank-2048 MPS can carry at most about 11 ebits of von Neumann entropy across a cut; if the true entropy exceeds this ceiling, the computed curves would saturate at the bond-dimension bound and could mimic the observed area-law behavior. The L0=48 check in Fig. 6 does not rule this out, because truncation error accumulates with time and with the number of projections. I ask the authors to add a systematic convergence test for representative Px on both sides and at the putative critical point, showing, for example, S(L=8,t=T) versus χ, discarded weight versus time, or a comparison of the phase boundary at two or more bond dimensions.
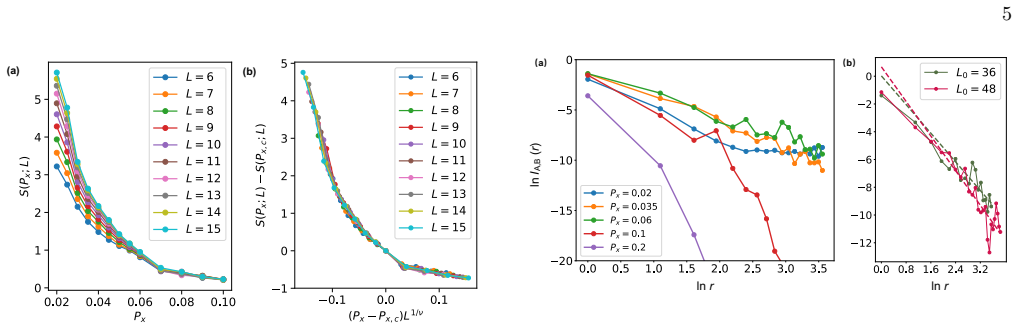
- [Section III, Eq. (2) and Fig. 5] The finite-size scaling analysis that yields Px,c≈0.060±0.004 and ν≈2.00±0.15 is not described in sufficient detail. The same data are used to determine both the critical point and the exponent, but the paper does not state how the values and uncertainties were obtained, how many subsystem sizes were included, or whether the collapse is stable under excluding the smallest L. Without a defined collapse metric or a bootstrap over disorder realizations, the quoted error bars are not reproducible. In addition, the inference of a "single universality class" from one model and one exponent is stronger than the evidence supports; the agreement with ν≈2 from random circuits is suggestive but not a demonstration of universality. At minimum, I request a more robust fitting procedure and a more cautious interpretation, or a collapse of additional observables such as the mutual information.
- [Section III, Fig. 6] The mutual information at the critical point yields an exponent Δ≈1.29 for L0=36 and Δ≈1.56 for L0=48, while the CFT argument quoted in the paper predicts Δ=2. The paper attributes the discrepancy to finite-size effects, but with only two system sizes there is no evidence of convergence, and the trend with L0 is in the right direction but still far from the predicted value. To support the CFT description, the authors should either provide a finite-size extrapolation of Δ (e.g., Δ versus 1/L0) or explicitly state that the current data are consistent with a power-law decay but do not yet determine the universal exponent.
- [Section III, Fig. 1(b)] The phase diagram reports critical spatial rates Px,c≈0.06, 0.08, 0.12, 0.24 for Nt=50, 40, 30, 20, but no error bars or extraction method are given for the Nt<50 values. Since the paper uses the Nt-dependence of Px,c to argue for the robustness of the transition and the role of information scrambling, please specify how these estimates were obtained and provide uncertainties. The current presentation makes it difficult to assess whether the claimed trend is significant.
minor comments (5)
- [Section II] The phrase "test to be fine" should read "tested to be fine". In addition, the statement about the maximum boson number per site being 5 should be accompanied by a check that this truncation does not affect the results.
- [Section III, Fig. 2] The number of random realizations is stated as "up to 900" in the text, but the figure does not show error bars or standard errors. Please specify the number of realizations used for each Px and include error estimates on the averaged entropy curves.
- [Section III, Fig. 4] The probability distributions of the single-site entropy are described only qualitatively. Please specify how the distributions are computed (binning, number of samples, whether they are averaged over sites and realizations) and provide the sample size for each curve.
- [Section III, Fig. 2 and text] The growth in the volume-law phase is described as "ballistically" in one place and as "linear dependence (with possible logarithmic correlations)" in another; please use consistent terminology and clarify which quantity is being fit.
- [Section III, Eq. (2)] The quantity S(Px,c) in Eq. (2) is not precisely defined: is it the measured entropy at the estimated critical point for each L, or a fitting parameter? Please clarify the definition and how it is evaluated.
Circularity Check
No significant circularity: the transition is a numerical observation with standard finite-size scaling, and all cited comparisons are external to this work.
full rationale
The paper's central claim—a volume-to-area-law measurement-induced entanglement transition in a 1D Bose-Hubbard model—rests on direct MPS/TEBD simulations, not on an assumption that contains the conclusion. The critical point Px,c≈0.060 and exponent ν≈2.00 are obtained from a standard finite-size data collapse using Eq. 2, and comparing that exponent with the random-circuit value of Ref. [36] is an external consistency check, not a self-citation or a fitted input renamed as a prediction. No parameter is fit to a subset of data and then used to predict a closely related constructed quantity; the same entropy curves are used consistently for the collapse, which is standard practice. The paper does not invoke a uniqueness theorem, does not smuggle an ansatz in through a self-citation, and no result is defined in terms of the target claim. The assumption of the scaling form in Eq. 2 is a modeling choice that could be questioned on numerical-convergence grounds, but that is a correctness or reliability concern, not circularity. The absence of quantified truncation-error data is a numerical robustness issue and does not make the derivation circular. Overall, the derivation chain is self-contained and the cited circuit-model results serve as independent external benchmarks rather than load-bearing self-references.
Assumptions & free parameters
free parameters (8)
- Px,c for Nt=50 =
0.060 ± 0.004
- Px,c for Nt=40, 30, 20 =
0.08, 0.12, 0.24
- nu (correlation length exponent) =
2.00 ± 0.15
- S(Px,c,L) baseline in Eq. 2 =
not stated; values at Px=0.06
- log-growth coefficients a,b for S vs ln t =
a≈0.22±0.02, b≈0.58±0.02
- log-growth coefficients a,b for S vs ln L =
a≈0.21±0.01, b≈0.41±0.01
- mutual information power-law exponent Delta =
1.29 (L0=36), 1.56 (L0=48)
- interaction strength U/J0 =
0.14
assumptions (6)
- domain assumption Projective measurements are implemented as OP = |1_x><1_x| and the state is renormalized after each measurement.
- domain assumption MPS/TEBD with bond dimension up to 2048, dt=0.02, and times up to T=30 gives converged entanglement for system sizes L0=36 and 48, including after measurements.
- domain assumption The finite-size scaling form Eq. 2 with a single exponent nu holds for this transition.
- domain assumption The time-space symmetry underlying the percolation picture (Ref. [36]) applies to this model, so logarithmic growth in time and subsystem size are equivalent signatures.
- domain assumption The 1D Bose-Hubbard model at U/J0=0.14 is non-integrable and its quench from a unit-filling product state produces volume-law entanglement in the absence of measurements.
- domain assumption The mutual-information critical exponent from CFT is Delta=2 and deviations seen here are finite-size effects.
Cite this review
Pith. "Pith review of Measurement-induced phase transition: A case study in the non-integrable model by density-matrix renormalization group calculations." pith.science (2026). https://pith.science/paper/S7ZBE7IL
@misc{pith2026190811253,
  author       = {Pith},
  title        = {Pith review of: Measurement-induced phase transition: A case study in the non-integrable model by density-matrix renormalization group calculations},
  year         = {2026},
  howpublished = {\url{https://pith.science/paper/S7ZBE7IL}},
  note         = {Machine review of arXiv:1908.11253}
}
read the original abstract
We study the effect of local projective measurements on the quantum quench dynamics. As a concrete example, a one-dimensional Bose-Hubbard model is simulated by the matrix product state and time-evolving block decimation. We map out a global phase diagram in terms of the measurement rate in spatial space and time domain, which demonstrates a volume-to-area law entanglement phase transition. When the measurement rate reaches the critical value, we observe a logarithmic growth of entanglement entropy as the subsystem size or evolved time increases. Moreover, we find that the probability distribution of the single-site entanglement entropy distinguishes the volume and area law phases, similar to the case of disorder-induced many-body localization. We also investigate the scaling behavior of entanglement entropy and mutual information between two separated sites, which is indicative of a single universality class and thus suggests a possible unified description of this transition.
Figures

Figures from the paper (1 more)
Reference graph
Works this paper leans on
-
[1]
Amico, R
L. Amico, R. Fazio, A. Osterloh, and V. Vedral, Rev. Mod. Phys. 80, 517 (2008)
2008
-
[2]
Eisert, M
J. Eisert, M. Cramer, and M. B. Plenio, Rev. Mod. Phys. 82, 277 (2010)
2010
-
[3]
Laflorencie, Quantum entanglement in condensed mat- ter systems , Physics Reports 646, 1 (2016)
N. Laflorencie, Quantum entanglement in condensed mat- ter systems , Physics Reports 646, 1 (2016)
work page 2016
-
[4]
Calabrese and J
P. Calabrese and J. Cardy, Journal of Statistical Mechan- ics: Theory and Experiment 2005, P04010 (2005)
2005
-
[5]
P. Calabrese and J. Cardy, Journal of Statistical Mechan- ics: Theory and Experiment 2007, P06008 (2007)
work page 2007
-
[6]
T. Hartman and J. Maldacena, Journal of High Energy Physics 2013, 14 (2013)
work page 2013
- [7]
- [8]
Show all 65 references
-
[9]
Alba and P
V. Alba and P. Calabrese, Proceedings of the National Academy of Sciences 114, 7947 (2017)
2017
-
[10]
Mezei and D
M. Mezei and D. Stanford, Journal of High Energy Physics 2017, 65 (2017)
2017
-
[11]
Tonni, J
E. Tonni, J. Rodr´ ıguez-Laguna, and G. Sierra, Journal of Statistical Mechanics: Theory and Experiment 2018, 043105 (2018)
2018
-
[12]
X. Wen, S. Ryu, and A. W. W. Ludwig, Journal of Statis- tical Mechanics: Theory and Experiment 2018, 113103 7 (2018)
2018
-
[13]
C. W. von Keyserlingk, T. Rakovszky, F. Pollmann, and S. L. Sondhi, Phys. Rev. X 8, 021013 (2018)
2018
-
[14]
Gong and M
Z. Gong and M. Ueda, Phys. Rev. Lett. 121, 250601 (2018)
2018
-
[15]
Rakovszky, F
T. Rakovszky, F. Pollmann, and C. W. von Keyserlingk, Phys. Rev. Lett. 122, 250602 (2019)
2019
-
[16]
Alba and P
V. Alba and P. Calabrese, Phys. Rev. B 100, 115150 (2019)
2019
-
[17]
Lieb-robinson bounds on entanglement gaps from symmetry-protected topology,
Z. Gong, N. Kura, M. Sato, and M. Ueda, “Lieb-robinson bounds on entanglement gaps from symmetry-protected topology,” (2019), arXiv:1904.12464 [quant-ph]
2019 arXiv
-
[18]
Basko, I
D. Basko, I. Aleiner, and B. Altshuler, Annals of Physics 321, 1126 (2006)
2006
-
[19]
ˇZnidariˇ c, T
M. ˇZnidariˇ c, T. c. v. Prosen, and P. Prelovˇ sek, Phys. Rev. B 77, 064426 (2008)
2008
-
[20]
J. H. Bardarson, F. Pollmann, and J. E. Moore, Phys. Rev. Lett. 109, 017202 (2012)
2012
-
[21]
S. Iyer, V. Oganesyan, G. Refael, and D. A. Huse, Phys. Rev. B 87, 134202 (2013)
2013
-
[22]
Kim and D
H. Kim and D. A. Huse, Phys. Rev. Lett. 111, 127205 (2013)
2013
-
[23]
Vosk and E
R. Vosk and E. Altman, Phys. Rev. Lett. 110, 067204 (2013)
2013
-
[24]
Serbyn, Z
M. Serbyn, Z. Papi´ c, and D. A. Abanin, Phys. Rev. Lett. 110, 260601 (2013)
2013
-
[25]
D. A. Huse, R. Nandkishore, and V. Oganesyan, Phys. Rev. B 90, 174202 (2014)
2014
-
[26]
Serbyn, Z
M. Serbyn, Z. Papi´ c, and D. A. Abanin, Phys. Rev. B 90, 174302 (2014)
2014
-
[27]
R. Vosk, D. A. Huse, and E. Altman, Phys. Rev. X 5, 031032 (2015)
2015
-
[28]
Singh, J
R. Singh, J. H. Bardarson, and F. Pollmann, New Jour- nal of Physics 18, 023046 (2016)
2016
-
[29]
Khemani, D
V. Khemani, D. N. Sheng, and D. A. Huse, Phys. Rev. Lett. 119, 075702 (2017)
2017
-
[30]
H. P. L¨ uschen, P. Bordia, S. Scherg, F. Alet, E. Altman, U. Schneider, and I. Bloch, Phys. Rev. Lett. 119, 260401 (2017)
2017
-
[31]
Bordia, H
P. Bordia, H. L¨ uschen, S. Scherg, S. Gopalakrishnan, M. Knap, U. Schneider, and I. Bloch, Phys. Rev. X 7, 041047 (2017)
2017
-
[32]
Nahum, J
A. Nahum, J. Ruhman, and D. A. Huse, Phys. Rev. B 98, 035118 (2018)
2018
-
[33]
X. Cao, A. Tilloy, and A. D. Luca, SciPost Phys. 7, 24 (2019)
2019
-
[34]
Degasperis, L
A. Degasperis, L. Fonda, and G. C. Ghirardi, Il Nuovo Cimento A (1965-1970) 21, 471 (1974)
1974
-
[35]
Misra and E
B. Misra and E. C. G. Sudarshan, Journal of Mathemat- ical Physics 18, 756 (1977)
1977
-
[36]
Skinner, J
B. Skinner, J. Ruhman, and A. Nahum, Phys. Rev. X 9, 031009 (2019)
2019
-
[37]
Y. Li, X. Chen, and M. P. A. Fisher, Phys. Rev. B 98, 205136 (2018)
2018
-
[38]
Y. Li, X. Chen, and M. P. A. Fisher, Phys. Rev. B 100, 134306 (2019)
2019
-
[39]
Quantum er- ror correction in scrambling dynamics and measurement induced phase transition,
S. Choi, Y. Bao, X.-L. Qi, and E. Altman, “Quantum er- ror correction in scrambling dynamics and measurement induced phase transition,” (2019), arXiv:1903.05124 [quant-ph]
2019 arXiv
-
[40]
Szyniszewski, A
M. Szyniszewski, A. Romito, and H. Schomerus, Phys. Rev. B 100, 064204 (2019)
2019
-
[41]
A. Chan, R. M. Nandkishore, M. Pretko, and G. Smith, Phys. Rev. B 99, 224307 (2019)
2019
-
[42]
Suzuki, Communications in Mathematical Physics 51, 183 (1976)
M. Suzuki, Communications in Mathematical Physics 51, 183 (1976)
1976
-
[43]
Vidal, Phys
G. Vidal, Phys. Rev. Lett. 93, 040502 (2004)
2004
-
[44]
S. R. White and A. E. Feiguin, Phys. Rev. Lett. 93, 076401 (2004)
2004
-
[45]
A. J. Daley, C. Kollath, U. Schollwck, and G. Vidal, Journal of Statistical Mechanics: Theory and Experi- ment 2004, P04005 (2004)
2004
-
[46]
Paeckel, T
S. Paeckel, T. Khler, A. Swoboda, S. R. Manmana, U. Schollwck, and C. Hubig, Annals of Physics 411, 167998 (2019)
2019
-
[47]
T. B. Wahl, A. Pal, and S. H. Simon, Nature Physics 15, 164 (2019)
2019
-
[48]
M. P. A. Fisher, P. B. Weichman, G. Grinstein, and D. S. Fisher, Phys. Rev. B 40, 546 (1989)
1989
-
[49]
V. A. Kashurnikov and B. V. Svistunov, Phys. Rev. B 53, 11776 (1996)
1996
-
[50]
V. A. Kashurnikov, A. V. Krasavin, and B. V. Svistunov, Journal of Experimental and Theoretical Physics Letters 64, 99 (1996)
1996
-
[51]
T. D. K¨ uhner, S. R. White, and H. Monien, Phys. Rev. B 61, 12474 (2000)
2000
-
[52]
Zakrzewski and D
J. Zakrzewski and D. Delande, AIP Conference Proceed- ings 1076, 292 (2008)
2008
-
[53]
A. M. Luchli and C. Kollath, Journal of Statistical Me- chanics: Theory and Experiment 2008, P05018 (2008)
2008
-
[54]
Ejima, H
S. Ejima, H. Fehske, and F. Gebhard, EPL (Europhysics Letters) 93, 30002 (2011)
2011
-
[55]
M. Pino, J. Prior, A. M. Somoza, D. Jaksch, and S. R. Clark, Phys. Rev. A 86, 023631 (2012)
2012
-
[56]
Ejima, H
S. Ejima, H. Fehske, F. Gebhard, K. zu M¨ unster, M. Knap, E. Arrigoni, and W. von der Linden, Phys. Rev. A 85, 053644 (2012)
2012
-
[57]
Rachel, N
S. Rachel, N. Laflorencie, H. F. Song, and K. Le Hur, Phys. Rev. Lett. 108, 116401 (2012)
2012
-
[58]
Carrasquilla, S
J. Carrasquilla, S. R. Manmana, and M. Rigol, Phys. Rev. A 87, 043606 (2013)
2013
-
[59]
Hauschild and F
J. Hauschild and F. Pollmann, SciPost Phys. Lect. Notes , 5 (2018)
2018
-
[60]
Vasseur, A
R. Vasseur, A. C. Potter, Y.-Z. You, and A. W. W. Ludwig, Phys. Rev. B 100, 134203 (2019)
2019
-
[61]
J. T. Chayes, L. Chayes, and R. Durrett, Journal of Statistical Physics 45, 933 (1986)
1986
-
[62]
V. G. Knizhnik, A. M. Polyakov, and A. B. Zamolod- chikov, Modern Physics Letters A 3, 819 (1988)
1988
-
[63]
Theory of the phase transition in random unitary circuits with mea- surements,
Y. Bao, S. Choi, and E. Altman, “Theory of the phase transition in random unitary circuits with mea- surements,” (2019), arXiv:1908.04305 [cond-mat.stat- mech]
2019 arXiv
-
[64]
Measurement-induced criticality in random quan- tum circuits,
C.-M. Jian, Y.-Z. You, R. Vasseur, and A. W. W. Lud- wig, “Measurement-induced criticality in random quan- tum circuits,” (2019), arXiv:1908.08051 [cond-mat.stat- mech]
2019 arXiv
-
[900]
(a-c) The full dynamics of the entropy with time up to T = 30, where the von Neu- mann entropy already reaches the platform saturated by the sub-system size
random realizations are presented in the form of a two- dimensional color-coded histogram. (a-c) The full dynamics of the entropy with time up to T = 30, where the von Neu- mann entropy already reaches the platform saturated by the sub-system size. (d-f) The short-time dynamic...
Reviewed August 14, 2026 · model on record in the stance chip above.
Discussion (0). Continue with ORCID to comment.