REVIEW 4 major objections 6 minor 36 references
Network-Based Approach for Modeling and Analyzing Coronary Angiography
T0 review · 4 major / 6 minor · reviewed 2026-08-14 · deepseek-v4-flash
Pith's one-line read Modeling a coronary angiogram as a weighted vessel network separates a healthy from a stenosed coronary tree.
desk verdict A clearly described two-case demonstration of network features on coronary angiograms, but the manual segmentation and missing artifacts make the headline comparisons suggestive rather than established. read the letter →
The pith
A machine-rendered reading of the paper's core claim, the machinery that carries it, and where it could break.
The reading
What carries the argument
The carrying object is the weighted directed coronary network, built by placing a node at every vessel intersection, an edge along each vessel segment in the direction of blood flow, and a weight equal to the vessel's diameter multiplied by its length in pixels. Around this object the paper deploys five measurement families: global network statistics (node and edge counts, average degree, clustering, diameter), the \Lambda$-branch motif, degree distributions and their quartile profiles, integration measures (shortest-path length, routing efficiency, search information), and the minimum set of driver nodes from controllability theory. The \Lambda$-branch is the named motif doing much of the interpretive work, and search information plus driver-node fraction are the two measures the paper singles out as promising classification features.
What would settle it
Take a cohort of at least 50 left coronary angiograms with independent stenosis labels, build each coronary network with automated segmentation or blinded manual tracing, and recompute the five measures; if the clustering gap, in-degree quartile shift, search-information difference, and driver-node fractions do not separate labeled healthy from diseased images, or if they track the acquisition site instead, the central claim is refuted. The paper's own admitted missing step, a rigorous study with more than two angiograms, is exactly this test.
Extended reading notes
Core claim
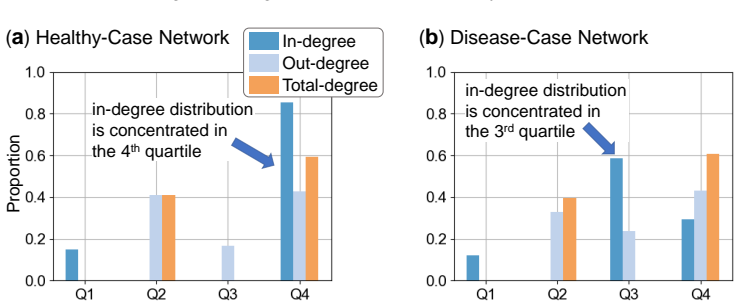
The central claim is that the graph structure of the coronary tree carries disease-relevant information that visual inspection and single-vessel quantitative measurements miss. On the two networks constructed here, disease is marked by a 36% lower average clustering coefficient, an abundance of \Lambda$-branches, an in-degree quartile shifted from the fourth to the third, larger search information between vessel-intersection pairs, and a smaller minimum driver-node set. The paper reads these signatures physiologically: extra \Lambda$-branches and small emergent vessels indicate neovascularization triggered by insufficient blood supply, and fewer driver nodes mean the diseased network is easier to control but less resilient to localized failure. It concludes that network-based measurements are a needed phase in automating coronary angiography interpretation, with the explicit caveat that validation on more than two angiograms remains to be done.
Load-bearing premise
Everything reported rests on two manually built networks being accurate and comparable: nodes were identified by eye with graphical filters, vessel widths were measured in pixels, and the healthy and diseased images come from different patients and different sources, so any systematic difference in acquisition or tracing could produce the reported network gaps without reflecting disease.
Editorial extensions
If this is right
- If the network approach is right, clustering, \Lambda$-branch count, degree quartiles, search information, and driver-node fraction become candidate features for training machine-learning classifiers on coronary angiograms.
- The same graph construction can be automated by existing 3D reconstruction and vessel-extraction pipelines, so the method does not depend on manual tracing once such tools are in place.
- Network features could sharpen follow-up care, for example by flagging early revascularization after stent implantation before visual changes are obvious.
- Because the representation is a tree rather than an imaging modality, the approach extends naturally to non-invasive coronary CT angiography.
- The authors themselves state that a rigorous study with more than two angiograms is the necessary next step before these case-study differences can become thresholds.
Reading between the lines
- A blinded cohort study with a fixed automated segmentation pipeline is the cleanest test: if the 36% clustering gap, the quartile shift, and the driver-node gap follow the acquisition site rather than the stenosis label, the apparent disease signal is an artifact of the two hand-built networks.
- The driver-node result suggests a resilience reading that the paper leaves implicit: healthier coronary networks need more driver nodes and are therefore harder to steer to a desired state but more robust to single-node failure; simulating progressive stenosis-induced branching on a synthetic coronary tree should shrink the minimum driver set.
- Search information may grade stenosis severity continuously rather than merely separating healthy from diseased; adding artificial occlusions to one angiogram and recomputing route hiddenness would test whether the measure rises monotonically with occlusion severity.
- The same directed, weighted-tree formalism connects coronary networks to other fluid-distribution networks such as leaf venation and river deltas, where \Lambda$-branch-like motifs and search information are already studied; a cross-system comparison could reveal whether the disease signature is a generic symptom of failing distribution networks.
Signed reviews
Editorial analysis
A structured set of objections, weighed in public.
Referee Report
Summary. The paper proposes to model the coronary artery tree extracted from coronary angiography (CA) images as a weighted network, in which nodes are vessel intersections and edge weights are diameter x length measured in pixels. Using one healthy and one diseased left-coronary angiogram, the authors compute global network characteristics (Table 1), degree and quartile-degree distributions (Figs. 6-7), integration measures including shortest-path length, routing efficiency, and search information (Fig. 8), and a controllability analysis giving the fraction of driver nodes (Fig. 9). They report that the diseased network has lower clustering, a quartile shift in in-degree, more lambda-branch motifs, larger search information, and fewer driver nodes, and they argue that such network features could eventually be used to automate CA interpretation and classification.
Significance. If validated, the proposed graph abstraction would be a useful supplement to Quantitative Coronary Angiography, adding topologically derived features (degree-distribution shape, routing efficiency, search information, driver-node fraction) to the visual and geometric features currently used. The manuscript applies standard network measures correctly and is transparent about the manual network-construction step and about the need for larger studies. Its main strength is the clarity of the proposed pipeline and the explicit acknowledgement that the current evidence is only a proof-of-concept. However, the reported between-group differences are single values on two manually segmented networks from unrelated patients, so the central claim that these features can capture disease state is not yet supported by the presented evidence.
major comments (4)
- [Section 3 and Section 3.1] The entire comparison rests on two manually constructed networks. Section 3 states that nodes were identified with graphical filters and that the steps were 'manually conducted,' and Section 3.1 states that the healthy and diseased angiograms 'are not related to each other' and come from different sources (references [27] and [28]). Consequently, every headline statistic -- average clustering 0.099 vs. 0.063 (Table 1), the quartile-degree shift (Fig. 7), the search-information values (Fig. 8), and the driver-node fractions 42% vs. 37% (Fig. 9) -- is a single value per group with no variance estimate, no blinding of the annotator, and no inter-annotator reproducibility. Because the manual tracing determines how many small branches are retained, it directly controls the degree distribution, the number of leaves, and the driver-node fraction. The observed differences could therefore be artifacts of patient anatomy, X-ray projection, magnification, contrast, or tracing effort rather than disease state. This is load-bearing for the Section 4 claim that the features 'pave the way' to classification; the authors' own final paragraph conceding that 'a rigorous study with more than two CAs should be done' does not cure the present lack of support. A revision must either add a multi-subject, blinded, reproducibility-aware study or explicitly reduce the claim to a methodological proposal.
- [Section 3.2 and Section 3.3] The lambda-branch motif is introduced after inspecting the disease-case angiogram (Figs. 2b and 3) and is then used to explain the quartile-degree shift observed in the same two networks (Section 3.3). This is a confirmatory loop: the motif is defined in hindsight on the same images that are later 'explained' by it. The manuscript does not show that lambda-branch abundance distinguishes the two networks under a degree-preserving null model, nor does it test the proposed neovascularization interpretation (reference [29]) against any independent data. Without such a test, the claimed link between lambda-branch abundance and the pathology is not established.
- [Section 3.5] The interpretation of driver-node fraction presupposes that 'a healthy network with a high percentage of driver nodes is more resilient to malfunctions.' This axiom is presented as intuitive, but it is not derived from the controllability framework of references [34,35] (which concerns structural controllability of linear dynamics) and is not tested against a model of blood-flow failure in a coronary tree. Moreover, the reported difference (42% vs. 37%) is small, and no sensitivity analysis shows how robust this difference is to plausible perturbations of the manually constructed networks. The resilience claim should either be formally justified or removed; at minimum, the driver-node fraction should be reported with confidence intervals from perturbed network ensembles.
- [Section 3.4 and Figure 8] The comparison of routing efficiency and search information between the healthy and diseased networks is not quantitatively meaningful in the absence of common calibration. Edge weights are diameter x length in pixels, but the two angiograms come from different patients and different sources, so the average pixel scale and the true vessel diameters are not comparable. The AvgTop10% values (e.g., 18.29 vs. 21.48 for the search-information maps) therefore mix anatomical scale with acquisition scale. The manuscript should normalize edge weights, use dimensionless summary statistics, and report full distributions with variance rather than a single top-10% average.
minor comments (6)
- [Author affiliation] The second author's affiliation contains typographical errors: 'Devision' should be 'Division' and 'Orthopeadic' should be 'Orthopaedic'.
- [Figure 3] Figure 3 contains stray 'aa' labels in the upper left of both panels; these appear to be leftover annotation artifacts and should be removed.
- [Figure 7] The term 'quartile-degree distribution' is not defined. Please specify whether the quartiles are computed over nodes ranked by degree, over degree values, or over edges, and how the bins were chosen.
- [References] Reference [27] ('What is coronary angiography') lacks full bibliographic details, and the source of the healthy angiogram should be described more precisely. Reference [28] should state which figure or panel was used and how the stenosis was confirmed.
- [Section 3.3] The phrase 'no significant difference' in the degree distributions is used without any statistical test. Since the networks are small and fixed, a significance statement is not supported unless a permutation or resampling test is provided.
- [Figure 10] Figure 10 reproduces a figure from Andrikos et al. [9] without an explicit permission statement or a license note; this should be addressed before publication.
Circularity Check
No circular derivation is exhibited: the network-analysis claims are direct empirical observations on manually constructed graphs, the sole self-citation is non-load-bearing, and the acknowledged n=2 limitation is a validity concern rather than circularity.
full rationale
The paper contains no fitted parameters, no equation that defines an output in terms of the target claim, and no prediction that is statistically forced by its inputs. The three showcased assessments (degree distribution, network integration, and controllability) are standard network measures computed directly from two manually constructed graphs; for example, the edge weight is defined as the vessel diameter multiplied by its length, and no subsequent quantity is re-fit from the healthy/diseased labels. The only self-citation, reference [35], is listed alongside the standard maximum-matching controllability reference [34] and is not load-bearing for the reported driver-node fractions. The authors' own closing statement in Section 4 that 'a rigorous study with more than two CAs should be done to further formalize and validate this approach' is an honest validity limitation rather than evidence of circularity. Likewise, the reliance on manually conducted segmentation steps is a correctness and confounding risk, not a definitional reduction: the reported differences could be artifacts of tracing effort or acquisition differences, but no metric is defined in terms of the disease label and no fitted parameter is renamed as a prediction. The qualitative discussion linking Lambda-branches to the degree-distribution shift is a cross-description of the same manual annotations, not a derived prediction, so it does not meet the hard-evidence threshold for circularity.
Assumptions & free parameters
free parameters (1)
- Top-10% summary threshold =
10%
assumptions (4)
- domain assumption Network measures such as degree distribution, clustering, global efficiency, and controllability are meaningful descriptors of coronary blood flow and disease state.
- domain assumption The two angiograms are comparable representatives of healthy and diseased coronary anatomy.
- domain assumption Manual identification of nodes and manual measurement of vessel lengths and diameters are accurate enough to support the reported network statistics.
- ad hoc to paper A higher fraction of driver nodes implies greater resilience to malfunction in a coronary network.
invented entities (1)
-
Lambda-branch motif
Cite this review
Pith. "Pith review of Network-Based Approach for Modeling and Analyzing Coronary Angiography." pith.science (2026). https://pith.science/paper/V4MRYUPW
@misc{pith2026190902664,
  author       = {Pith},
  title        = {Pith review of: Network-Based Approach for Modeling and Analyzing Coronary Angiography},
  year         = {2026},
  howpublished = {\url{https://pith.science/paper/V4MRYUPW}},
  note         = {Machine review of arXiv:1909.02664}
}
read the original abstract
Significant intra-observer and inter-observer variability in the interpretation of coronary angiograms are reported. This variability is in part due to the common practices that rely on performing visual inspections by specialists (e.g., the thickness of coronaries). Quantitative Coronary Angiography (QCA) approaches are emerging to minimize observer's error and furthermore perform predictions and analysis on angiography images. However, QCA approaches suffer from the same problem as they mainly rely on performing visual inspections by utilizing image processing techniques. In this work, we propose an approach to model and analyze the entire cardiovascular tree as a complex network derived from coronary angiography images. This approach enables to analyze the graph structure of coronary arteries. We conduct the assessments of network integration, degree distribution, and controllability on a healthy and a diseased coronary angiogram. Through our discussion and assessments, we propose modeling the cardiovascular system as a complex network is an essential phase to fully automate the interpretation of coronary angiographic images. We show how network science can provide a new perspective to look at coronary angiograms.
Figures


Figures from the paper (7 more)




Reference graph
Works this paper leans on
-
[27]
What is coronary angiography
-
[28]
Tae-Jin Kim, Jae-Kyun Kim, Bo-Min Park, Pil-Sang Song, Dong-Kie Kim, Ki-Hun Kim, Sang-Hoon Seol, and Doo-Il Kim. Fatal subacute stent thrombosis induced by guidewire fracture with retained filaments in the coronary artery. Korean circulation journal, 43(11):761–765, 2013
work page 2013
-
[29]
Moreno, K-Raman Purushothaman, Marc Sirol, Andrew P
Pedro R. Moreno, K-Raman Purushothaman, Marc Sirol, Andrew P. Levy, and Valentin Fuster. Neovasculariza- tion in human atherosclerosis. Circulation, 113(18):2245–2252, 2006
work page 2006
-
[1]
Epidemiology of coronary heart disease, January 2018
Peter WF Wilson and Pamela S Douglas. Epidemiology of coronary heart disease, January 2018. In Brian C Downey (Ed.), UpToDate. Retrieved February 2019
work page 2018
-
[2]
Thomas J. Ryan. The coronary angiogram and its seminal contributions to cardiovascular medicine over five decades. Circulation, 106(6):752–756, 2002
work page 2002
-
[3]
Variability in the analysis of coronary arteriograms
T A DeRouen, J A Murray, and W Owen. Variability in the analysis of coronary arteriograms. Circulation, 55(2):324–328, 1977
work page 1977
-
[4]
Quantitative coronary angiography: Clinical applications, November 2017
Morton J Kern and Donald Cutlip. Quantitative coronary angiography: Clinical applications, November 2017. In Gordon M Saperia (Ed.), UpToDate. Retrieved February 2019
work page 2017
-
[5]
Quantitative coronary angiography to measure progression and regression of coronary atherosclerosis
Pim J de Feyter, Patrick W Serruys, Michael J Davies, Peter Richardson, Jacobus Lubsen, and Michael F Oliver. Quantitative coronary angiography to measure progression and regression of coronary atherosclerosis. value, limitations, and implications for clinical trials. Circulation, 84(1):412–423, 1991
work page 1991
Show all 36 references
-
[6]
Dashtbozorg, A
B. Dashtbozorg, A. M. Mendonc ¸a, and A. Campilho. An automatic graph-based approach for artery/vein classi- fication in retinal images. IEEE Transactions on Image Processing, 23(3):1073–1083, March 2014
2014
-
[7]
Lossau, H
T. Lossau, H. Nickisch, T. Wissel, R. Bippus, H. Schmitt, M. Morlock, and M. Grass. Motion artifact recognition and quantification in coronary CT angiography using convolutional neural networks. Medical Image Analysis, 52:68 – 79, 2019
2019
-
[8]
Wolterink, Robbert W
Jelmer M. Wolterink, Robbert W. van Hamersvelt, Max A. Viergever, Tim Leiner, and Ivana I ˇsgum. Coronary artery centerline extraction in cardiac CT angiography using a cnn-based orientation classifier. Medical Image Analysis, 51:46 – 60, 2019
2019
-
[9]
Andrikos, Atnonis I
Ioannis O. Andrikos, Atnonis I. Sakellarios, Panagiotis K. Siogkas, Panagiota I. Tsompou, Vassiliki I. Kigka, Lampros K. Michalis, and Dimitrios I. Fotiadis. A novel method for 3d reconstruction of coronary bifurcation using quantitative coronary angiography. In Lenka Lhotska,...
2018
-
[10]
Bourantas, Iraklis C
Christos V . Bourantas, Iraklis C. Kourtis, Marina E. Plissiti, Dimitrios I. Fotiadis, Christos S. Katsouras, Michail I. Papafaklis, and Lampros K. Michalis. A method for 3d reconstruction of coronary arteries using bi- plane angiography and intravascular ultrasound images.Com...
2005
-
[11]
Quantitative coronary angiography in the current era: Principles and applications
Paolo Garrone, Giuseppe Biondi-Zoccai, Ilaria Salvetti, Noemi Sina, Imad Sheiban, Peter R Stella, and Pier- francesco Agostoni. Quantitative coronary angiography in the current era: Principles and applications. Journal of Interventional Cardiology, 22(6):527–536, 2009
2009
-
[12]
Quantitative coronary angiography in the interventional cardiology
Salvatore Davide Tomasello, Luca Costanzo, and Alfredo Ruggero Galassi. Quantitative coronary angiography in the interventional cardiology. In Suna F. Kirac ¸, editor,Advances in the Diagnosis of Coronary Atherosclerosis, chapter 14. IntechOpen, Rijeka, 2011
2011
-
[13]
Green, S.-Y
Nathan E. Green, S.-Y . James Chen, Adam R. Hansgen, John C. Messenger, Bertron M. Groves, and John D. Carroll. Angiographic views used for percutaneous coronary interventions: A three-dimensional analysis of physician-determined vs. computer-generated views. Catheterization a...
-
[14]
Fleming, Richard L
Richard M. Fleming, Richard L. Kirkeeide, Richard W. Smalling, K.Lance Gould, and Yvonne Stuart. Patterns in visual interpretation of coronary arteriograms as detected by quantitative coronary arteriography. Journal of the American College of Cardiology, 18(4):945–951, 1991
1991
-
[15]
Why do humans have so few genes? 309(5731):80–80, 2005
Elizabeth Pennisi. Why do humans have so few genes? 309(5731):80–80, 2005
2005
-
[16]
Complexity: A guided tour
Melanie Mitchell. Complexity: A guided tour. Oxford University Press, 2009
2009
-
[17]
Linked: How everything is connected to everything else and what it means
Albert-Laszlo Barabasi. Linked: How everything is connected to everything else and what it means . Plume, 2003
2003
-
[18]
M. Newman. The structure and function of complex networks. SIAM Review, 45(2):167–256, 2003
2003
-
[19]
The heart pacemaker by cellular automata on complex networks
Danuta Makowiec. The heart pacemaker by cellular automata on complex networks. Cellular Automata, pages 291–298, 2008
2008
-
[20]
Complex network measures of brain connectivity: uses and interpretations
Mikail Rubinov and Olaf Sporns. Complex network measures of brain connectivity: uses and interpretations. Neuroimage, 52(3):1059–1069, 2010
2010
-
[21]
Network motifs: simple building blocks of complex networks
Ron Milo, Shai Shen-Orr, Shalev Itzkovitz, Nadav Kashtan, Dmitri Chklovskii, and Uri Alon. Network motifs: simple building blocks of complex networks. Science, 2002
2002
-
[22]
Lusis and James N
Aldons J. Lusis and James N. Weiss. Cardiovascular networks. Circulation, 121(1):157–170, 2010
2010
-
[23]
Estrada, M
R. Estrada, M. J. Allingham, P. S. Mettu, S. W. Cousins, C. Tomasi, and S. Farsiu. Retinal artery-vein classifica- tion via topology estimation. IEEE Transactions on Medical Imaging, 34(12):2518–2534, Dec 2015
2015
-
[24]
West, James H
Geoffrey B. West, James H. Brown, and Brian J. Enquist. A general model for the origin of allometric scaling laws in biology. Science, 276(5309):122–126, 1997
1997
-
[25]
I. O. Andrikos, A. I. Sakellarios, P. K. Siogkas, G. Rigas, T. P. Exarchos, L. S. Athanasiou, A. Karanasos, K. Toutouzas, D. Tousoulis, L. K. Michalis, and D. I. Fotiadis. A novel hybrid approach for reconstruction of coronary bifurcations using angiography and oct. In 2017 39...
2017
-
[26]
Abstract 15456: Computer-assisted diagnosis of coronary angiography
S.M.Reza Soroushmehr, Abhishek Bafna, Sinha Shashank, Nallamothu Brahmajee, Kevin Ward, and Kay- van Najarian. Abstract 15456: Computer-assisted diagnosis of coronary angiography. Circulation, 132(suppl 3):A15456–A15456, 2015
2015
-
[30]
Efficient behavior of small-world networks
Vito Latora and Massimo Marchiori. Efficient behavior of small-world networks. Phys. Rev. Lett., 87:198701, Oct 2001
2001
-
[31]
van den Heuvel, Richard F
Joaqu ´ın Go˜ni, Andrea Avena-Koenigsberger, Nieves Velez de Mendizabal, Martijn P. van den Heuvel, Richard F. Betzel, and Olaf Sporns. Exploring the morphospace of communication efficiency in complex networks. PLOS ONE, 8(3):1–10, 03 2013. 9 A PREPRINT - SEPTEMBER 9, 2019
2013
-
[32]
Hide-and-seek on complex networks
K Sneppen, A Trusina, and M Rosvall. Hide-and-seek on complex networks. Europhysics Letters (EPL) , 69(5):853–859, mar 2005
2005
-
[33]
Rosvall, A
M. Rosvall, A. Gr ¨onlund, P. Minnhagen, and K. Sneppen. Searchability of networks. Phys. Rev. E, 72:046117, Oct 2005
2005
-
[34]
Controllability of complex networks
Yang-Yu Liu, Jean-Jacques Slotine, and Albert-L ´aszl´o Barab´asi. Controllability of complex networks. Nature, 473(7346):167, 2011
2011
-
[35]
Identifying and using driver nodes in temporal networks
Babak Ravandi, Fatma Mili, and John A Springer. Identifying and using driver nodes in temporal networks. Journal of Complex Networks, 03 2019. 10
2019
-
[2019]
8 A PREPRINT - SEPTEMBER 9, 2019
Springer Singapore. 8 A PREPRINT - SEPTEMBER 9, 2019
2019
Reviewed August 14, 2026 · model on record in the stance chip above.
Discussion (0). Continue with ORCID to comment.