State-Space Dynamic Functional Regression for Multicurve Fixed Income Spread Analysis and Stress Testing
Pith reviewed 2026-05-23 21:16 UTC · model grok-4.3
The pith
State-space functional regression extends Nelson-Siegel to model yield spreads between economies.
A machine-rendered reading of the paper's core claim, the machinery that carries it, and where it could break.
Core claim
A novel state-space functional regression model incorporating dynamic Nelson-Siegel and functional regression formulations in a multi-economy setting offers distinct advantages in explaining the relative spreads in yields between a reference economy and a response economy, made tractable by kernel principal component analysis.
What carries the argument
State-space dynamic functional regression model with dynamic Nelson-Siegel components and kernel principal component analysis for finite-dimensional transformation.
If this is right
- The functional regression approach shows advantages in explaining yield spreads over the dynamic Nelson-Siegel model in in-sample performance.
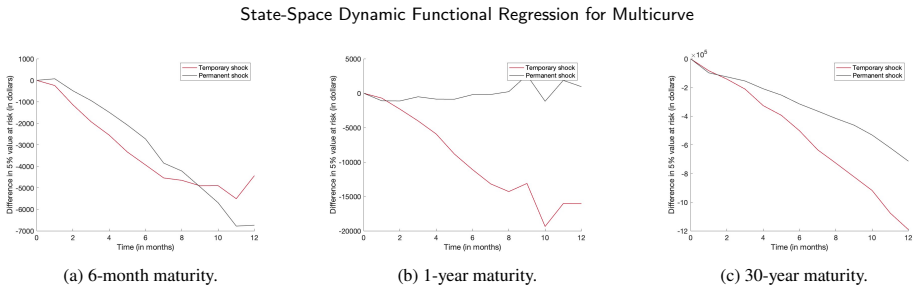
- The framework supports stress testing analysis of yield curve term-structures in a dual economy setting.
- Bond ladder portfolios can be examined through spread modelling with historical US Treasury and UK bond data.
- Model calibration is addressed by transforming functional regression into a tractable finite-dimensional problem.
Where Pith is reading between the lines
- The model structure may allow extension to additional economies beyond the dual reference-response setup.
- Applications to other fixed income instruments with similar curve dynamics could follow from the same state-space formulation.
- Real-time updating of spread forecasts might be enabled by the state-space nature of the model.
Load-bearing premise
Kernel principal component analysis transforms the functional regression representation into a finite-dimensional tractable estimation problem without material loss of information or introduction of bias in the spread dynamics.
What would settle it
Empirical results where the state-space functional regression model does not demonstrate superior in-sample fit or stress testing performance compared to the dynamic Nelson-Siegel model on the US and UK yield data.
Figures




read the original abstract
The Nelson-Siegel model is widely used in fixed income markets to produce yield curve dynamics. The multiple time-dependent parameter model conveniently addresses the level, slope, and curvature dynamics of the yield curves. In this study, we present a novel state-space functional regression model that incorporates a dynamic Nelson-Siegel model and functional regression formulations applied to multi-economy setting. This framework offers distinct advantages in explaining the relative spreads in yields between a reference economy and a response economy. To address the inherent challenges of model calibration, a kernel principal component analysis is employed to transform the representation of functional regression into a finite-dimensional, tractable estimation problem. A comprehensive empirical analysis is conducted to assess the efficacy of the functional regression approach, including an in-sample performance comparison with the dynamic Nelson-Siegel model. We conducted the stress testing analysis of yield curves term-structure within a dual economy framework. The bond ladder portfolio was examined through a case study focused on spread modelling using historical data for US Treasury and UK bonds.
Editorial analysis
A structured set of objections, weighed in public.
Referee Report
Summary. The paper proposes a state-space dynamic functional regression framework that integrates the dynamic Nelson-Siegel model with functional regression to analyze yield curve spreads between a reference economy and a response economy. Kernel principal component analysis reduces the functional regressors to a finite-dimensional estimation problem. The approach is evaluated via in-sample comparisons against dynamic Nelson-Siegel on US/UK data, stress testing of term structures, and a bond-ladder portfolio case study focused on spread modeling.
Significance. If the KPCA reduction preserves the relevant Nelson-Siegel factor dynamics without material bias, the model could improve multicurve spread analysis and stress testing relative to standard dynamic Nelson-Siegel alone. The dual-economy empirical application and portfolio case study provide concrete illustrations of potential practical utility in fixed-income risk management.
major comments (2)
- [Abstract and §3] Abstract and §3: The central claim of distinct advantages in explaining relative US-UK yield spreads hinges on the KPCA step producing a finite-dimensional representation without material loss of information or bias in spread dynamics. No evidence is supplied (e.g., sensitivity checks on kernel bandwidth, retained component count, or comparison of factor loadings before/after projection) that truncation does not distort curvature or slope components that drive the spreads; this directly affects the estimated state transitions and stress-test outputs.
- [Empirical analysis section] Empirical analysis section: The in-sample performance comparison with the dynamic Nelson-Siegel model reports no error bars, out-of-sample hold-out results, or controls for data-driven choices of KPCA hyperparameters, leaving open whether any reported improvement in spread fit is robust or an artifact of in-sample overfitting.
minor comments (1)
- Notation for the state-space transition matrices and observation equations should explicitly distinguish reference-economy versus response-economy quantities to avoid ambiguity when spreads are formed.
Simulated Author's Rebuttal
We thank the referee for the constructive comments on the KPCA validation and empirical robustness. We address each point below and will revise the manuscript accordingly to strengthen the supporting evidence.
read point-by-point responses
-
Referee: [Abstract and §3] Abstract and §3: The central claim of distinct advantages in explaining relative US-UK yield spreads hinges on the KPCA step producing a finite-dimensional representation without material loss of information or bias in spread dynamics. No evidence is supplied (e.g., sensitivity checks on kernel bandwidth, retained component count, or comparison of factor loadings before/after projection) that truncation does not distort curvature or slope components that drive the spreads; this directly affects the estimated state transitions and stress-test outputs.
Authors: We agree that the manuscript currently lacks explicit sensitivity checks on the KPCA step. In the revised version, we will add analyses varying kernel bandwidth and retained component count, along with direct comparisons of Nelson-Siegel factor loadings before and after projection. These additions will demonstrate that truncation does not materially distort slope and curvature dynamics relevant to spreads, thereby supporting the state transitions and stress-test results. revision: yes
-
Referee: [Empirical analysis section] Empirical analysis section: The in-sample performance comparison with the dynamic Nelson-Siegel model reports no error bars, out-of-sample hold-out results, or controls for data-driven choices of KPCA hyperparameters, leaving open whether any reported improvement in spread fit is robust or an artifact of in-sample overfitting.
Authors: The current empirical section presents in-sample comparisons primarily for illustrative purposes. We acknowledge that this leaves the robustness open to question. In revision, we will incorporate out-of-sample hold-out evaluations, report error bars or confidence intervals on performance metrics, and document plus test sensitivity to KPCA hyperparameter choices to rule out overfitting artifacts. revision: yes
Circularity Check
No circularity: derivation remains independent of fitted inputs
full rationale
The paper introduces a state-space functional regression that augments dynamic Nelson-Siegel factors with functional regressors across economies, then applies KPCA solely for computational tractability. No equation or step in the provided text defines the target spreads in terms of the same fitted quantities used for estimation, nor does any prediction reduce by construction to a parameter fit on the identical data. The in-sample comparison to the baseline Nelson-Siegel model is a standard benchmark evaluation rather than a self-referential claim. Self-citations are absent from the abstract and description, and the KPCA step is presented as an approximation tool without any uniqueness theorem or ansatz imported from prior author work. The central claim of improved spread explanation therefore rests on external empirical performance rather than definitional equivalence.
Axiom & Free-Parameter Ledger
free parameters (1)
- Dynamic Nelson-Siegel time-dependent parameters
axioms (1)
- domain assumption Kernel principal component analysis accurately reduces functional regression to finite dimensions without significant information loss for spread modeling.
Reference graph
Works this paper leans on
-
[1]
https://doi.org/10.1016/j.insmatheco.2007.02.009
GaillardetzP.Valuationoflifeinsuranceproductsunderstochasticinterestrates.Insurance:MathematicsandEconomics.2008;42(1):212–226. https://doi.org/10.1016/j.insmatheco.2007.02.009
-
[2]
Marketvalueoflifeinsurancecontractsunderstochasticinterestratesanddefaultrisk
BernardC,LeCourtoisO,Quittard-PinonF. Marketvalueoflifeinsurancecontractsunderstochasticinterestratesanddefaultrisk. Insurance: Mathematics and Economics. 2005;36(3):499–516.https://doi.org/10.1016/j.insmatheco.2005.01.002
-
[3]
Valuation of general GMWB annuities in a low interest rate environment
Fontana C, Rotondi F. Valuation of general GMWB annuities in a low interest rate environment. Insurance: Mathematics and Economics. 2023;112:142–167.https://doi.org/10.1016/j.insmatheco.2023.07.003
-
[4]
2024;114:15–28.https://doi.org/10.1016/j.insmatheco.2023.10.003
GüntherS,HieberP.Analyzingtheinterestrateriskofequity-indexedannuitiesviascenariomatrices.Insurance:MathematicsandEconomics. 2024;114:15–28.https://doi.org/10.1016/j.insmatheco.2023.10.003
-
[5]
Optimalconsumption,portfolio,andlifeinsurancepoliciesunderinterestrateandinflationrisks
HanNW,HungMW. Optimalconsumption,portfolio,andlifeinsurancepoliciesunderinterestrateandinflationrisks. Insurance:Mathematics and Economics. 2017;73:54–67.https://doi.org/10.1016/j.insmatheco.2017.01.004
-
[6]
Wang P, Li Z. Robust optimal investment strategy for an AAM of DC pension plans with stochastic interest rate and stochastic volatility. Insurance: Mathematics and Economics. 2018;80:67–83.https://doi.org/10.1016/j.insmatheco.2018.03.003. Peilun He et al.:Preprint submitted to Elsevier Page 33 of 35 State-Space Dynamic Functional Regression for Multicurve
-
[7]
Optimalinvestment,consumptionandlifeinsurancepurchasewithlearningaboutreturnpredictability
PengX,LiB. Optimalinvestment,consumptionandlifeinsurancepurchasewithlearningaboutreturnpredictability. Insurance:Mathematics and Economics. 2023;113:70–95.https://doi.org/10.1016/j.insmatheco.2023.07.005
-
[8]
Pricing interest-rate-derivative securities
Hull J, White A. Pricing interest-rate-derivative securities. The Review of Financial Studies. 1990;3(4):573–592.https://doi.org/10. 1093/rfs/3.4.573
work page 1990
-
[9]
Heath D, Jarrow R, Morton A. Bond pricing and the term structure of interest rates: A new methodology for contingent claims valuation. Econometrica: Journal of the Econometric Society. 1992;p. 77–105.https://doi.org/10.2307/2951677
-
[10]
Anequilibriumcharacterizationofthetermstructure
VasicekO. Anequilibriumcharacterizationofthetermstructure. JournalofFinancialEconomics.1977;5(2):177–188. https://doi.org/ 10.1016/0304-405X(77)90016-2
-
[11]
A Theory of the Term Structure of Interest Rates
Cox JC, Ingersoll Jr JE, Ross SA. A Theory of the Term Structure of Interest Rates. Econometrica. 1985;53(2):385–407. https: //doi.org/10.1142/9789812701022_0005
-
[12]
A., Hekker, S., Stello, D., Guti ´errez-Soto, J., Handberg, R., Huber, D., et al
Duffie D, Kan R. A yield-factor model of interest rates. Mathematical Finance. 1996;6(4):379–406.https://doi.org/10.1111/j. 1467-9965.1996.tb00123.x
work page doi:10.1111/j 1996
-
[13]
Interest rate models: an introduction
Cairns AJ. Interest rate models: an introduction. Princeton University Press; 2004.https://doi.org/10.1515/9780691187426
-
[14]
The F.T.-Actuaries fixed interest indices
Dobbie G, Wilkie A. The F.T.-Actuaries fixed interest indices. Journal of the Institute of Actuaries. 1978;105(1):15–26. https: //doi.org/10.1017/S0020268100018382
-
[15]
Parsimonious modeling of yield curves
Nelson CR, Siegel AF. Parsimonious modeling of yield curves. Journal of Business. 1987;p. 473–489.https://doi.org/10.1086/ 296409
work page 1987
-
[16]
Estimating and interpreting forward interest rates: Sweden 1992-1994
Svensson LE. Estimating and interpreting forward interest rates: Sweden 1992-1994. National Bureau of Economic Research Cambridge, Mass., USA; 1994.https://doi.org/10.3386/w4871
-
[17]
Descriptive Bond-Yield and Forward-Rate Models for the British Government Securities’ Market
Cairns AJ. Descriptive Bond-Yield and Forward-Rate Models for the British Government Securities’ Market. British Actuarial Journal. 1998;4(2):265–321.https://doi.org/10.1017/S1357321700000040
-
[18]
Stability of models for the term structure of interest rates with application to german market data
Cairns AJ, Pritchard DJ. Stability of models for the term structure of interest rates with application to german market data. British Actuarial Journal. 2001;7(3):467–507.https://doi.org/10.1017/S1357321700002439
-
[19]
Forecasting the term structure of government bond yields
Diebold FX, Li C. Forecasting the term structure of government bond yields. Journal of Econometrics. 2006;130(2):337–364.https: //doi.org/10.1016/j.jeconom.2005.03.005
-
[20]
Themacroeconomyandtheyieldcurve:adynamiclatentfactorapproach
DieboldFX,RudebuschGD,AruobaSB. Themacroeconomyandtheyieldcurve:adynamiclatentfactorapproach. JournalofEconometrics. 2006;131(1-2):309–338.https://doi.org/10.1016/j.jeconom.2005.01.011
-
[21]
Global yield curve dynamics and interactions: a dynamic Nelson–Siegel approach
Diebold FX, Li C, Yue VZ. Global yield curve dynamics and interactions: a dynamic Nelson–Siegel approach. Journal of Econometrics. 2008;146(2):351–363.https://doi.org/10.1016/j.jeconom.2008.08.017
-
[22]
Koopman SJ, Mallee MI, Van der Wel M. Analyzing the term structure of interest rates using the dynamic Nelson–Siegel model with time- varying parameters. Journal of Business & Economic Statistics. 2010;28(3):329–343.https://doi.org/10.1198/jbes.2009.07295
-
[23]
ForecastingthetermstructuresofTreasuryandcorporateyieldsusingdynamicNelson-Siegelmodels
YuWC,ZivotE. ForecastingthetermstructuresofTreasuryandcorporateyieldsusingdynamicNelson-Siegelmodels. InternationalJournal of Forecasting. 2011;27(2):579–591.https://doi.org/10.1016/j.ijforecast.2010.04.002
-
[24]
Optimalbondportfolioswithfixedtimetomaturity
AnderssonP,LageråsAN. Optimalbondportfolioswithfixedtimetomaturity. Insurance:MathematicsandEconomics.2013;53(2):429–438. https://doi.org/10.1016/j.insmatheco.2013.07.009
-
[25]
A note on the Nelson–Siegel family
Filipović D. A note on the Nelson–Siegel family. Mathematical finance. 1999;9(4):349–359
work page 1999
-
[26]
Yield curve modeling and forecasting: the dynamic Nelson-Siegel approach
Diebold FX, Rudebusch GD. Yield curve modeling and forecasting: the dynamic Nelson-Siegel approach. Princeton University Press; 2013
work page 2013
-
[27]
An arbitrage-free generalized Nelson-Siegel term structure model
Christensen JH, Diebold FX, Rudebusch GD. An arbitrage-free generalized Nelson-Siegel term structure model. Econometrics Journal. 2009;12:C33–C64.https://doi.org/10.1111/j.1368-423X.2008.00267.x
-
[28]
An Analysis of the Ultra Long-Term Yields
Dubecq S, Gourieroux C. An Analysis of the Ultra Long-Term Yields. In: Paris December 2011 Finance Meeting EUROFIDAI-AFFI; 2011. http://dx.doi.org/10.2139/ssrn.1943535
-
[29]
Financialbigdatasolutionsforstatespacepanelregressionininterestratedynamics
ToczydlowskaD,PetersGW. Financialbigdatasolutionsforstatespacepanelregressionininterestratedynamics. Econometrics.2018;6(3). https://doi.org/10.3390/econometrics6030034
-
[30]
Nonlinear component analysis as a kernel eigenvalue problem
Schölkopf B, Smola A, Müller KR. Nonlinear component analysis as a kernel eigenvalue problem. Neural Computation. 1998;10(5):1299–
work page 1998
-
[31]
https://doi.org/10.1162/089976698300017467
-
[32]
MikaS,SchölkopfB,SmolaA,MüllerKR,ScholzM,RätschG.KernelPCAandde-noisinginfeaturespaces.AdvancesinNeuralInformation Processing Systems. 1998;11
work page 1998
-
[33]
Kernel PCA for feature extraction and de-noising in nonlinear regression
Rosipal R, Girolami M, Trejo LJ, Cichocki A. Kernel PCA for feature extraction and de-noising in nonlinear regression. Neural Computing & Applications. 2001;10:231–243.https://doi.org/10.1007/s521-001-8051-z
-
[34]
Pattern Recognition47(1), 388–401 (2014)
Hoffmann H. Kernel PCA for novelty detection. Pattern Recognition. 2007;40(3):863–874.https://doi.org/10.1016/j.patcog. 2006.07.009
-
[35]
Theyieldcurveandpredictingrecessions
WrightJH. Theyieldcurveandpredictingrecessions. FederalReserveBoardWorkingPaper;2006. http://dx.doi.org/10.2139/ssrn. 899538
-
[36]
The predictive power of the yield curve across countries and time
Chinn M, Kucko K. The predictive power of the yield curve across countries and time. International Finance. 2015;18(2):129–156. https://doi.org/10.1111/infi.12064
-
[37]
Empiricalanalysisandforecastingofmultipleyieldcurves
GerhartC,LütkebohmertE. Empiricalanalysisandforecastingofmultipleyieldcurves. Insurance:MathematicsandEconomics.2020;95:59–
work page 2020
-
[38]
https://doi.org/10.1016/j.insmatheco.2020.08.004
-
[39]
A probability-based stress test of Federal Reserve assets and income
Christensen JH, Lopez JA, Rudebusch GD. A probability-based stress test of Federal Reserve assets and income. Journal of Monetary Economics. 2015;73:26–43.https://doi.org/10.1016/j.jmoneco.2015.03.007
-
[40]
Karimalis E, Kosmidis I, Peters GW. Multi yield curve stress-testing framework incorporating temporal and cross tenor structural dependencies. Bank of England Working Paper No. 655; 2017.http://dx.doi.org/10.2139/ssrn.2949763
-
[41]
YieldCurve: Modelling and estimation of the yield curve; 2010
Guirreri S. YieldCurve: Modelling and estimation of the yield curve; 2010. Available from:https://CRAN.R-project.org/package= YieldCurve. Peilun He et al.:Preprint submitted to Elsevier Page 34 of 35 State-Space Dynamic Functional Regression for Multicurve
work page 2010
-
[42]
NMOF: Numerical methods and optimization in finance; 2016
Schumann E. NMOF: Numerical methods and optimization in finance; 2016. Available from:https://CRAN.R-project.org/package= NMOF
work page 2016
-
[43]
Forecasting functional time series
Hyndman RJ, Shang HL. Forecasting functional time series. Journal of the Korean Statistical Society. 2009;38(3):199–211.https: //doi.org/10.1016/j.jkss.2009.06.002
-
[44]
Functional dynamic factor models with application to yield curve forecasting
Hays S, Shen H, Huang JZ. Functional dynamic factor models with application to yield curve forecasting. The Annals of Applied Statistics. 2012;p. 870–894.https://doi.org/10.1214/12-AOAS551
-
[45]
Nonparametric estimation of functional dynamic factor model
Martínez-Hernández I, Gonzalo J, González-Farías G. Nonparametric estimation of functional dynamic factor model. Journal of Nonparametric Statistics. 2022;34(4):895–916.https://doi.org/10.1080/10485252.2022.2080825
-
[46]
The dynamics of economic functions: modeling and forecasting the yield curve
Bowsher CG, Meeks R. The dynamics of economic functions: modeling and forecasting the yield curve. Journal of the American Statistical Association. 2008;103(484):1419–1437.https://doi.org/10.1198/016214508000000922
-
[47]
Multivariate functional-coefficient regression models for nonlinear vector time series data
Jiang J. Multivariate functional-coefficient regression models for nonlinear vector time series data. Biometrika. 2014;101(3):689–702. https://doi.org/10.1093/biomet/asu011
-
[48]
Ametrano FM, Bianchetti M. Everything you always wanted to know about multiple interest rate curve bootstrapping but were afraid to ask. Available at SSRN 2219548. 2013;https://doi.org/10.2139/ssrn.2219548
-
[49]
PetersGW,LokeSH.IntroductiontoFixedIncomeMarketsandBonds.In:FoundationsforUndergraduateResearchinMathematics.Springer; to appear
-
[50]
Kernel methods for pattern analysis
Shawe-Taylor J, Cristianini N. Kernel methods for pattern analysis. Cambridge University Press; 2004.https://doi.org/10.1017/ CBO9780511809682
work page 2004
-
[51]
Conditions for the positivity of determinants
Johnson CR, Neumann M, Tsatsomeros MJ. Conditions for the positivity of determinants. Linear and Multilinear Algebra. 1996;40(3):241–
work page 1996
-
[52]
Peilun He et al.:Preprint submitted to Elsevier Page 35 of 35
https://doi.org/10.1080/03081089608818442. Peilun He et al.:Preprint submitted to Elsevier Page 35 of 35
discussion (0)
Sign in with ORCID, Apple, or X to comment. Anyone can read and Pith papers without signing in.