REVIEW 3 major objections 4 minor 1 cited by
The SDSS-V Local Volume Mapper (LVM): Data Analysis Pipeline
T0 review · 3 major / 4 minor · reviewed 2026-08-12 · deepseek-v4-flash
Pith's one-line read The SDSS-V Local Volume Mapper's new data analysis pipeline separates starlight from ionized-gas emission in spectra whose apertures contain anywhere from zero to thousands of stars, and recovers emission-line fluxes, equivalent widths…
desk verdict A genuinely new RSP template method wrapped in a partly self-referential validation; the emission-line accuracy claims outrun what the simulations can test. read the letter →
The pith
A machine-rendered reading of the paper's core claim, the machinery that carries it, and where it could break.
The reading
What carries the argument
The central object is the RSP template library: 1235 templates formed by clustering roughly 19,000 stars from an empirical stellar library in the space of effective temperature, surface gravity, metallicity, and alpha-enhancement, then further clustered by spectral similarity into 108 representative spectra. Each RSP carries a probability distribution function over stellar parameters, and the pipeline fits each observed spectrum as a dust-attenuated, kinematically broadened linear combination of these templates. A two-stage fitting loop first derives stellar kinematics and dust attenuation from a small subset of templates while masking emission lines, then performs a full Monte Carlo linear decomposition of the gas-free spectrum; the residual of the subtraction is smoothed to a low-order component so the emission-line fit sees an almost zero background. The mechanism carries the argument because it is what lets continuum subtraction work in apertures containing too few stars for classical stellar synthesis, and it is what lets the pipeline report not just one stellar model but a probability distribution for the stellar content.
What would settle it
Take a set of LVM apertures whose continua are dominated by stars outside the template library's coverage, such as hot OB stars or regions with strong nebular continuum like the core of Orion, and compare the DAP emission-line fluxes, velocities, and dispersions against independent measurements from high-resolution, high-signal-to-noise spectroscopy of the same regions; if the recovered emission-line parameters shift systematically with the continuum mismatch, for example with the Paschen jump at roughly 8200 Angstroms, the central claim fails. A simpler decisive test is to run the DAP on the Orion deep exposure with the nebular continuum subtracted by an independent method and check whether the faint auroral line fluxes change by more than the quoted Monte Carlo errors.
Extended reading notes
Core claim
The authors claim that the LVM-DAP robustly corrects for stellar continuum features and recovers emission-line parameters, namely flux, equivalent width, systemic velocity, and velocity dispersion, with precision and accuracy that fulfill the primary goal of the LVM analysis, while the recovered stellar parameters are reliable when the spectrum is dominated by a single star but less precise for integrated populations. The load-bearing novelty is the resolved stellar population (RSP) approach: instead of modeling each aperture with single stellar populations that assume a fully sampled initial mass function, the pipeline decomposes the continuum into a linear combination of 108 representative stellar spectra, each carrying a probability distribution over effective temperature, surface gravity, metallicity, and alpha-element abundance. After subtracting the best stellar model and a low-order residual correction, emission lines are measured twice, parametrically with Gaussians and non-parametrically with weighted moments, with Monte Carlo error propagation. Quantitative tests on simulations show flux recovery within roughly ten percent for the majority of lines above a signal-to-noise ratio of about ten, with kinematics accurate to a few kilometers per second for the strongest lines; the authors explicitly note that the stellar library does not cover hot OB stars or nebular continuum, and that the integrated stellar parameters of mixed populations show offsets that follow linear trends and can be corrected statistically.
Load-bearing premise
The whole analysis rests on the assumption that the stellar and nebular continuum in every LVM aperture can be represented well enough by a linear combination of the 108 empirical RSP templates, plus a low-order residual adjustment, so that subtracting that model does not bias the measured emission lines.
Editorial extensions
If this is right
- The pipeline makes it possible to process the LVM's roughly 55 million spectra automatically, fiber by fiber, without spatial binning, producing emission-line maps at physical scales from 0.05 pc to 100 pc.
- Emission-line diagnostics such as BPT-style line ratios, electron density from the [S II] doublet, and temperature from auroral lines can be measured across resolved H II regions and stellar clusters, directly serving the survey's stellar-feedback science.
- For single-star-dominated apertures, the recovered effective temperature, gravity, metallicity, and alpha abundance are reliable enough to characterize the stellar content, with effective temperature recovered to about five percent, though low-gravity and metallicity are less precise.
- For mixed-population apertures, the constant biases in the recovered average stellar parameters can be corrected statistically, allowing approximate stellar population properties even when classical synthesis is invalid.
- Public release of the DAP code and data products starting with SDSS DR20 lets other surveys with high spatial resolution per spaxel adopt the RSP decomposition approach.
Reading between the lines
- If the RSP decomposition is as robust as the simulations suggest, the same template-plus-PDF approach could be applied to other integral-field surveys whose spaxels resolve stellar populations, replacing the need to bin spatially before synthesis.
- The admitted failure to fit the Orion continuum, including the blue-end mismatch and the Paschen jump from nebular continuum, implies that adding nebular continuum models and hotter OB-star templates to the RSP library would materially improve both stellar parameter recovery and the accuracy of weak emission lines in bright H II regions; this is a testable upgrade rather than a fundamental limit.
- Because each RSP template carries a PDF rather than a point value, the pipeline's output is naturally suited to hierarchical or Bayesian population inference, allowing users to combine fiber PDFs into spatially resolved stellar parameter distributions with quantified degeneracies.
- A practical caution follows from the paper's own finding that the non-parametric moment method fails on strongly blended lines like the [O II] doublet: final science catalogs should merge parametric and non-parametric outputs line by line rather than treating one method as uniformly superior.
Signed reviews
Editorial analysis
A structured set of objections, weighed in public.
Referee Report
Summary. The paper introduces version 1.0.0 of the SDSS-V Local Volume Mapper Data Analysis Pipeline (LVM-DAP), which separates stellar and ionized-gas components in LVM integral-field spectra. The pipeline first fits non-linear stellar parameters (v_star, sigma_star, A_V), then performs parametric and non-parametric emission-line fits, and finally synthesizes the stellar continuum using a new library of Resolved Stellar Population (RSP) templates built from the MaStar library, each carrying a PDF of physical parameters. The accuracy of the pipeline is assessed with idealized simulations (Cloudy/MAPPINGS plus Pollux stars), empirical 'realistic' simulations, single-star fits of MaStar spectra, and an application to a deep Orion Nebula exposure. The authors conclude that emission-line fluxes, equivalent widths, velocities, and dispersions are recovered with accuracy sufficient for the LVM primary goal, while stellar parameters are reliable for single stars but less precise for integrated populations.
Significance. If the central accuracy claims hold, the paper is a valuable methods contribution: it provides a working, publicly distributed pipeline for a major survey, introduces the RSP concept with associated PDFs for partially resolved stellar populations, and includes validation against physically motivated photoionization simulations. The decision to release code, templates, and example data products is a concrete strength that aids reproducibility. The idealized simulations with Cloudy and MAPPINGS truth, and the Orion comparison against multiple literature datasets, are also strong features. The main significance risk is that the quantitative accuracy claims in Table 3 rest largely on the self-referential realistic simulations, while the independent idealized simulations are presented only qualitatively; this needs to be addressed before the headline accuracy statement is fully supported.
major comments (3)
- [Sec. 4.2, 4.3, Table 3] The quantitative emission-line recovery statistics in Table 3 are derived from the realistic simulations described in Sec. 4.2, but those simulations use the DAP's own outputs as input truth: stellar continua are drawn from the same RSP library used in the fit, and emission-line fluxes are taken from the DAP analysis of the reference frame. This makes the quoted precision and accuracy partly a measure of the pipeline's ability to reproduce its own outputs. The idealized simulations in Sec. 4.1 use external truth (Cloudy and MAPPINGS line fluxes, Pollux stellar spectra) and are therefore not circular, but the paper only states that 'similar results' were found without quantitative tables or figures for these simulations. Please add a quantitative idealized-simulation accuracy table parallel to Table 3, or explicitly restrict the central accuracy claim to the self-consistent case and justify why the residual-based noise model is representative.
- [Sec. 3.1, Sec. 5.4, Fig. 15] The continuum-representation assumption is load-bearing but not independently tested. The residual-correction step in Sec. 3.1 subtracts a smoothed low-order component from the stellar-subtracted spectrum and forces a zero background before emission-line fitting; this can absorb real continuum structure and bias line fluxes and equivalent widths. Section 5.4 documents exactly the relevant failure mode: with the Orion integrated spectrum, the RSP library cannot fit the blue continuum near 3700-4000 Å or the Paschen jump at ~8200 Å, and the paper attributes part of the residual to nebular continuum and broad line wings. Since the realistic simulations cannot produce such template mismatch, the impact of this mismatch on recovered line parameters is never quantified. Please add a test that injects synthetic emission lines into spectra containing non-RSP continuum components (e.g., an OB-star continuum or a nebular-continuum model with the Paschen jump) and reports the resulting biases in flux, EW, velocity, and dispersion.
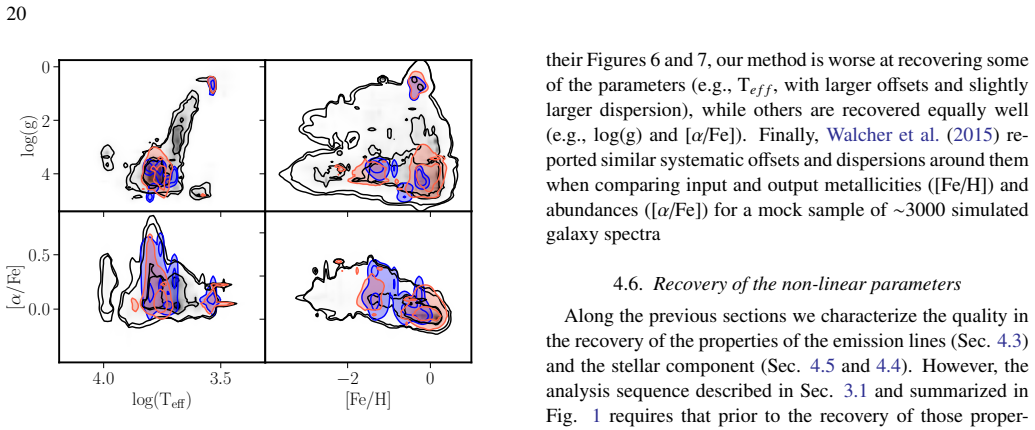
- [Sec. 4.4, Fig. 8] The single-star validation fits MaStar spectra with the RSP library generated from the same MaStar spectra, so it is an internal-consistency test rather than an external accuracy test. The paper acknowledges this limitation in the text, but the abstract and Sec. 7 state that the recovered stellar parameters are 'reliable for single stars' without this caveat. The claim would be strengthened by validating against at least a subset of stars from an independent library outside MaStar, such as the Pollux stars already used in the idealized simulations or model-atmosphere grids; otherwise the statement should be softened to say that the method is internally consistent within the parameter space covered by the library.
minor comments (4)
- [Abstract and Sec. 1] The abstract contains typos: 'systemtic velocity' should be 'systemic velocity', and 'robustly correct' should be 'robustly corrects'. Similar typographical issues appear elsewhere, e.g., 'poitings' in Sec. 5, 'origion' in Sec. 5.4, and 'descrived' in Sec. 5.5.
- [Sec. 4.5, Fig. 11 caption] Figure 11 caption says 'the RSP template comprising 1253 stars', but the text consistently states that the RSP library contains 1235 templates. Please correct the number.
- [Sec. 3.3.1] The resolution mismatch between MaStar (R~1800) and LVM (R~4000) is mentioned, but the paper does not quantify how this affects the stellar velocity dispersion recovery or the effective spectral binning used in the non-linear fit. A sentence giving the expected systematic floor on sigma_star from this mismatch would help users interpret the values in the data products.
- [Sec. 4.5, Fig. 10] The text reports offsets and corrected fractions for the stellar population recovery, but the definition of 'corrected' is not explicit in the text near Fig. 10. Please state whether the corrections are simple additive offsets and whether they are derived from the same simulations or from independent data.
Circularity Check
Continuum-representation accuracy is partly self-referential: realistic simulations draw both stellar continua and emission-line truth from the DAP's own outputs and RSP library.
-
fitted input called prediction
[Sec. 4.2, 'Realistic simulations', first paragraph]
"The second set of simulations, which we will call 'realistic', uses the outputs of the DAP analysis on real LVM observations. Essentially, it uses the properties of the emission lines extracted by the DAP based on the weighted-moment analysis on a real LVM frame (reference frame) to generate RSS spectra of the ionized gas emission... By construction, the spatial distribution of the flux intensities of the simulated emission lines is the same as the spatial distribution of those properties in the reference frame."
The 'true' emission-line fluxes injected into the realistic simulations are the DAP's own weighted-moment measurements from the reference frame. The recovery statistics in Sec. 4.3 and Table 3 therefore measure how well the DAP reproduces its own outputs under added noise and randomized kinematics, not how well it recovers independent physical truth. The claimed accuracy for emission-line fluxes, EWs, velocities, and dispersions is thus partly a self-consistency check rather than an external validation of the continuum subtraction on which those measurements depend.
-
fitted input called prediction
[Sec. 4.2, 'Realistic simulations', second paragraph; and Sec. 4.5]
"in addition, for each fiber, a stellar spectrum is simulated by randomly combining spectra from a selected RSP-template, adding a certain dust attenuation (AV,star), and applying certain kinematics (vel_star, sigma_star)."
The simulated stellar continua are built by linearly combining spectra from the same RSP template library that the DAP later fits (Sec. 3.3). Input continua therefore lie inside the span of the fitting basis by construction, so template mismatch cannot appear in the quoted accuracies. The realistic simulations never exercise the failure mode documented in Sec. 5.4, where the adopted templates cannot fit the Orion continuum around 3700-4000 Å or the Paschen jump at ~8200 Å. The central claim that the DAP 'robustly correct[s] for stellar continuum features' is consequently not independently established by these simulations.
1 more flagged steps
-
fitted input called prediction
[Sec. 4.4, 'Recovery of the parameters for a single star', final paragraph]
"Another important remark regarding the current exploration is that we have performed this test using the same stellar library and spectra adopted to generate the RSP templates used in the fitting process. Therefore, we are not fully testing the ability of the procedure to recover physical properties of individual stars in the most general sense, but rather exploring the ability to recover them within the boundaries of properties covered by the MaStar library."
The single-star validation fits the very MaStar spectra from which the RSP templates were constructed (Sec. 3.3.1), so good recovery of Teff, log(g), [Fe/H], and [alpha/Fe] partly confirms that the template-building procedure preserved information about its own training set. This is a training-set validation, not an independent test against external stellar labels. The paper honestly discloses this, but the abstract's statement that 'the recovered stellar parameters are reliable for single stars' is weaker than an external validation would support.
full rationale
The paper is transparent about its limitations, but the central accuracy claim for continuum subtraction and emission-line recovery rests partly on simulations whose inputs are the DAP's own outputs or its own template library. The realistic simulations (Sec. 4.2) generate emission-line truth from the DAP's weighted-moment measurements and generate stellar continua by randomly combining RSP templates from the same library used in the fit; thus Table 3's precision and accuracy figures are partly a self-consistency test, not an external test of template mismatch. The single-star validation (Sec. 4.4) is likewise performed on the MaStar library used to build the RSP templates, a disclosed training-set validation. Independently, the idealized simulations (Sec. 4.1) use Cloudy/MAPPINGS emission models and Pollux stellar atmosphere spectra, which are external to the RSP library, and the Orion application (Sec. 5) compares line ratios to O92, B00, and S07, providing some external benchmark. However, Sec. 5.4 explicitly documents that the adopted templates cannot reproduce the real Orion continuum (blue-end mismatch and Paschen jump), and the low-order residual correction that absorbs this mismatch is inherited from prior work by the same group (Sanchez et al. 2016a; Lacerda et al. 2022). Because the realistic validation cannot expose this failure mode, the robustness claim is partially circular. There is no imported 'uniqueness theorem' and no hidden self-citation chain; the partial circularity is confined to the validation strategy. Score 6 reflects a central claim that is partly forced by construction but retains independent content from the idealized simulations and the external Orion comparison.
Assumptions & free parameters
free parameters (9)
- Physical parameter bin sizes for RSP clustering =
Δlog(Teff)=0.03, Δlog(g)=0.03, Δ[Fe/H]=0.2, Δ[α/Fe]=0.15
- Minimum stars per bin =
3
- S/N threshold for MaStar library inclusion =
S/N>5 in blue range 3980-4090 Å
- Number of RSP clusters (ncl) =
108
- k-neighbor for spectral clustering =
3
- Normalization window for clustering =
50 Å around 5000 Å
- S/N threshold for full stellar decomposition =
20
- Dust attenuation bin width =
75 Å
- Kinematic spectral binning =
3 pixels
assumptions (6)
- domain assumption CoSha-assigned stellar parameters (Teff, log g, [Fe/H], [α/Fe]) for MaStar stars are accurate and can be propagated into RSP template PDFs.
- domain assumption The LVM data reduction pipeline correctly performs sky subtraction, flux calibration, wavelength calibration, and error propagation.
- domain assumption A linear combination of a small number of RSP templates can represent the stellar continuum in any LVM aperture.
- domain assumption Photoionization models (Cloudy, MAPPINGS) used in idealized simulations produce realistic emission-line spectra for testing.
- ad hoc to paper Residuals from the DAP fit to a real frame are a representative noise model for constructing realistic simulations.
- domain assumption Gaussian line profiles are adequate for the parametric emission-line fits.
Cite this review
Pith. "Pith review of The SDSS-V Local Volume Mapper (LVM): Data Analysis Pipeline." pith.science (2026). https://pith.science/paper/CCHZU6GO
@misc{pith2026241109729,
  author       = {Pith},
  title        = {Pith review of: The SDSS-V Local Volume Mapper (LVM): Data Analysis Pipeline},
  year         = {2026},
  howpublished = {\url{https://pith.science/paper/CCHZU6GO}},
  note         = {Machine review of arXiv:2411.09729}
}
read the original abstract
We introduce the Data Analysis Pipeline (DAP) for the Sloan Digital Sky Survey V (SDSS-V) Local Volume Mapper (LVM) project, referred to as the LVM-DAP. We outline our methods for recovering both stellar and emission line components from the optical integral field spectroscopy, highlighting the developments and changes implemented to address specific challenges of the data set. The observations from the LVM project are unique because they cover a wide range of physical resolutions, from approximately 0.05 pc to 100 pc, depending on the distance to the targets. This, along with the varying number of stars sampled in each aperture (ranging from zero, just one of a few, to thousands), presents challenges in using previous spectral synthesis methods and interpreting the spectral fits. We provide a detailed explanation of how we model the stellar content and separate it from the ionized gas emission lines. To assess the accuracy of our results, we compare them with both idealized and more realistic simulations, highlighting the limitations of our methods. We find that the DAP robustly correct for stellar continuum features and recover emission line parameters (e.g. flux, equivalent width, systemtic velocity and velocity dispersion) with a precision and accuracy that fulfill the requirements of the primary goal of the analysis. In addition, the recovered stellar parameters are reliable for single stars, the recovery of integrated populations is less precise. We conclude with a description of the data products we provide, instructions for downloading and using our software, and a showcase illustrating the quality of the data and the analysis on a deep exposure taken on the Huygens region at the center of the Orion Nebula.
Figures


Figures from the paper (14 more)




Forward citations
Cited by 1 Pith paper
-
The Twentieth Data Release of the Sloan Digital Sky Survey: First All-Sky BOSS Spectra, eROSITA-SDSS-V Mapper Coordinated Observations, and a Preview of the Local Volume Mapper
DR20 releases over three million BOSS spectra (first southern-hemisphere SDSS-V optical data), 169 LVM integral-field tiles over six targets, and eighteen value-added catalogs.
Reference graph
Works this paper leans on
-
[1]
, " * write output.state after.block = add.period write newline
ENTRY address archivePrefix author booktitle chapter doi edition editor eprint howpublished institution journal key month number organization pages publisher school series title misctitle type volume year version url label extra.label sort.label short.list INTEGERS output.state before.all mid.sentence after.sentence after.block FUNCTION init.state.consts ...
-
[2]
write newline
" write newline "" before.all 'output.state := FUNCTION format.url url empty "" new.block "" url * "" * if FUNCTION format.eprint eprint empty "" archivePrefix empty "" archivePrefix "arXiv" = new.block " " eprint * " " * new.block " " eprint * " " * if if if FUNCTION format.doi doi empty "" " " doi * " " * if FUNCTION format.pid doi empty eprint empty ur...
-
[3]
thebibliography [1] 20pt to REFERENCES 6pt =0pt -12pt 10pt plus 3pt =0pt =0pt =1pt plus 1pt =0pt =0pt -12pt =13pt plus 1pt =20pt =13pt plus 1pt \@M =10000 =-1.0em =0pt =0pt 0pt =0pt =1.0em @enumiv\@empty 10000 10000 `\.\@m \@noitemerr \@latex@warning Empty `thebibliography' environment \@ifnextchar \@reference \@latexerr Missing key on reference command E...
arXiv 2021
-
[4]
Arsenault , R., & Roy , J. R. 1986, , 92, 567, 10.1086/114186
-
[5]
2010, in Society of Photo-Optical Instrumentation Engineers (SPIE) Conference Series, Vol
Bacon , R., Accardo , M., Adjali , L., et al. 2010, in Society of Photo-Optical Instrumentation Engineers (SPIE) Conference Series, Vol. 7735, Ground-based and Airborne Instrumentation for Astronomy III, ed. I. S. McLean , S. K. Ramsay , & H. Takami , 773508, 10.1117/12.856027
-
[6]
Baldwin , J. A., Ferland , G. J., Martin , P. G., et al. 1991, , 374, 580, 10.1086/170146
doi:10.1086/170146 1991
-
[7]
Baldwin , J. A., Phillips , M. M., & Terlevich , R. 1981, , 93, 5, 10.1086/130766
doi:10.1086/130766 1981
-
[8]
Baldwin , J. A., Verner , E. M., Verner , D. A., et al. 2000, , 129, 229, 10.1086/313416
doi:10.1086/313416 2000
Show all 92 references
-
[9]
T., Chandar , R., Kreckel , K., et al
Barnes , A. T., Chandar , R., Kreckel , K., et al. 2022, , 662, L6, 10.1051/0004-6361/202243766
2022 doi
-
[10]
K., Heckman , T., S \'a nchez , S
Barrera-Ballesteros , J. K., Heckman , T., S \'a nchez , S. F., et al. 2018, , 852, 74, 10.3847/1538-4357/aa9b31
2018 doi
-
[11]
A., & Povich , M
Binder , B. A., & Povich , M. S. 2018, , 864, 136, 10.3847/1538-4357/aad7b2
2018 doi
-
[12]
Blagrave , K. P. M., Martin , P. G., Rubin , R. H., et al. 2007, , 655, 299, 10.1086/510151
2007 doi
-
[13]
Bluck , A. F. L., Maiolino , R., Sanchez , S., et al. 2019, arXiv e-prints, arXiv:1911.08857. 1911.08857
2019 arXiv
-
[14]
2003, , 344, 1000, 10.1046/j.1365-8711.2003.06897.x
Bruzual , G., & Charlot , S. 2003, , 344, 1000, 10.1046/j.1365-8711.2003.06897.x
2003
-
[15]
Bruzual A. , G. 1983, , 273, 105, 10.1086/161352
1983 doi
-
[16]
A., Law , D
Bundy , K., Bershady , M. A., Law , D. R., et al. 2015, , 798, 7, 10.1088/0004-637X/798/1/7
2015 doi
-
[17]
J., Conroy , C., & Johnson , B
Byler , N., Dalcanton , J. J., Conroy , C., & Johnson , B. D. 2017, , 840, 44, 10.3847/1538-4357/aa6c66
2017 doi
-
[18]
F., Zibetti , S., et al
Cano-D \' az , M., S \'a nchez , S. F., Zibetti , S., et al. 2016, , 821, L26, 10.3847/2041-8205/821/2/L26
2016 doi
-
[19]
2004, , 116, 138, 10.1086/381875
Cappellari , M., & Emsellem , E. 2004, , 116, 138, 10.1086/381875
2004 doi
-
[20]
A., Clayton , G
Cardelli , J. A., Clayton , G. C., & Mathis , J. S. 1989, , 345, 245, 10.1086/167900
1989 doi
-
[21]
2013, , 57, 123, 10.1016/j.newar.2013.09.001
Cervi \ n o , M. 2013, , 57, 123, 10.1016/j.newar.2013.09.001
2013 doi
-
[22]
2013, , 553, A32, 10.1051/0004-6361/201220937
Cervi \ n o , M., Rom \'a n-Z \'u \ n iga , C., Bayo , A., et al. 2013, , 553, A32, 10.1051/0004-6361/201220937
2013 doi
-
[23]
1994, , 425, 720, 10.1086/174017
Chu , Y.-H., & Kennicutt , Robert C., J. 1994, , 425, 720, 10.1086/174017
1994 doi
-
[24]
Cid Fernandes , R., Mateus , A., Sodr \'e , L., Stasinska , G., & Gomes , J. M. 2011, STARLIGHT: Spectral Synthesis Code , Astrophysics Source Code Library. 1108.006
2011
-
[25]
2013, , 557, A86, 10.1051/0004-6361/201220616
Cid Fernandes , R., P \'e rez , E., Garc \' a Benito , R., et al. 2013, , 557, A86, 10.1051/0004-6361/201220616
2013 doi
-
[27]
2014 b , , 561, A130, 10.1051/0004-6361/201321692
---. 2014 b , , 561, A130, 10.1051/0004-6361/201321692
2014 doi
-
[28]
2013, , 51, 393, 10.1146/annurev-astro-082812-141017
Conroy , C. 2013, , 51, 393, 10.1146/annurev-astro-082812-141017
2013 doi
-
[29]
L., Garc \' a-Benito , R., Cid Fernandes , R., et al
de Amorim , A. L., Garc \' a-Benito , R., Cid Fernandes , R., et al. 2017, , 471, 3727, 10.1093/mnras/stx1805
2017 doi
-
[30]
2010, in , V6--149, 10.1109/ICCET.2010.5486345
Ding, S., Zhang, L., & Zhang, Y. 2010, in , V6--149, 10.1109/ICCET.2010.5486345
2010
-
[31]
A., Nicholls , D
Dopita , M. A., Nicholls , D. C., Sutherland , R. S., Kewley , L. J., & Groves , B. A. 2016, , 824, L13, 10.3847/2041-8205/824/1/L13
2016 doi
- [32]
- [33]
-
[34]
F., Morisset , C., et al
Espinosa-Ponce , C., S \'a nchez , S. F., Morisset , C., et al. 2020, , 494, 1622, 10.1093/mnras/staa782
2020 doi
- [35]
-
[36]
2011, , 532, A95, 10.1051/0004-6361/201116842
Falc \'o n-Barroso , J., S \'a nchez-Bl \'a zquez , P., Vazdekis , A., et al. 2011, , 532, A95, 10.1051/0004-6361/201116842
2011 doi
-
[37]
S., Pascucci , I., et al
Fang , M., Kim , J. S., Pascucci , I., et al. 2017, , 153, 188, 10.3847/1538-3881/aa647b
2017 doi
-
[38]
J., Korista , K
Ferland , G. J., Korista , K. T., Verner , D. A., et al. 1998, , 110, 761, 10.1086/316190
1998 doi
- [39]
-
[40]
L., & Krumholz , M
Fumagalli , M., da Silva , R. L., & Krumholz , M. R. 2011, , 741, L26, 10.1088/2041-8205/741/2/L26
2011 doi
-
[41]
Gaia Collaboration , Brown , A. G. A., Vallenari , A., et al. 2018, , 616, A1, 10.1051/0004-6361/201833051
2018 doi
-
[42]
M., & Papaderos , P
Gomes , J. M., & Papaderos , P. 2017, , 603, A63, 10.1051/0004-6361/201628986
2017 doi
-
[43]
2018, , 479, 917, 10.1093/mnras/sty1480
Guidi , G., Casado , J., Ascasibar , Y., et al. 2018, , 479, 917, 10.1093/mnras/sty1480
2018 doi
-
[44]
F., et al
Husemann , B., Jahnke , K., S \'a nchez , S. F., et al. 2013, , 549, A87, 10.1051/0004-6361/201220582
2013 doi
-
[45]
J., Avila-Reese , V., S \'a nchez , S
Ibarra-Medel , H. J., Avila-Reese , V., S \'a nchez , S. F., Gonz \'a lez-Samaniego , A., & Rodr \' guez-Puebla , A. 2019, , 483, 4525, 10.1093/mnras/sty3256
2019 doi
-
[46]
J., S \'a nchez , S
Ibarra-Medel , H. J., S \'a nchez , S. F., Avila-Reese , V., et al. 2016, , 463, 2799, 10.1093/mnras/stw2126
2016 doi
-
[47]
Kaler , J. B. 1976, , 31, 517, 10.1086/190390
1976 doi
- [48]
- [49]
-
[50]
Lacerda , E. A. D., S \'a nchez , S. F., Mej \' a-Narv \'a ez , A., et al. 2022, arXiv e-prints, arXiv:2202.08027. 2202.08027
2022 arXiv
-
[51]
R., Belfiore , F., Bershady , M
Law , D. R., Belfiore , F., Bershady , M. A., et al. 2021, arXiv e-prints, arXiv:2112.11281. 2112.11281
2021 arXiv
-
[52]
F., Anderson , J
L \'o pez-Cob \'a , C., S \'a nchez , S. F., Anderson , J. P., et al. 2020, arXiv e-prints, arXiv:2002.09328. 2002.09328
2020 arXiv
-
[53]
Mathis , J. S. 1982, , 261, 195, 10.1086/160330
1982 doi
-
[54]
F., Weilbacher , P
McLeod , A. F., Weilbacher , P. M., Ginsburg , A., et al. 2016, , 455, 4057, 10.1093/mnras/stv2617
2016 doi
-
[55]
F., et al
Mejia-Narvaez , A., Bruzual , G., Sanchez , S. F., et al. 2021, arXiv e-prints, arXiv:2108.01697. 2108.01697
2021 arXiv
-
[56]
F., Carigi , L., et al
Mej \' a-Narv \'a ez , A., S \'a nchez , S. F., Carigi , L., et al. 2022, , 661, L5, 10.1051/0004-6361/202243691
2022 doi
-
[57]
2011, , 417, 420, 10.1111/j.1365-2966.2011.19278.x
Mesa-Delgado , A., N \'u \ n ez-D \' az , M., Esteban , C., L \'o pez-Mart \' n , L., & Garc \' a-Rojas , J. 2011, , 417, 420, 10.1111/j.1365-2966.2011.19278.x
2011
-
[58]
2018, in Walking the Line 2018, 2, 10.5281/zenodo.1206115
Morisset , C. 2018, in Walking the Line 2018, 2, 10.5281/zenodo.1206115
2018 doi
-
[59]
F., et al
Morisset , C., Delgado-Inglada , G., S \'a nchez , S. F., et al. 2016, , 594, A37, 10.1051/0004-6361/201628559
2016 doi
-
[60]
O'Dell , C. R. 2001, , 39, 99, 10.1146/annurev.astro.39.1.99
2001 doi
-
[61]
R., Ferland , G
O'Dell , C. R., Ferland , G. J., & Peimbert , M. 2017 a , , 464, 4835, 10.1093/mnras/stw2713
2017 doi
-
[62]
R., Kollatschny , W., & Ferland , G
O'Dell , C. R., Kollatschny , W., & Ferland , G. J. 2017 b , , 837, 151, 10.3847/1538-4357/aa6198
2017 doi
-
[63]
2022, , 509, 522, 10.1093/mnras/stab2988
Orozco-Duarte , R., Wofford , A., Vidal-Garc \' a , A., et al. 2022, , 509, 522, 10.1093/mnras/stab2988
2022 doi
-
[64]
Osterbrock , D. E. 1989, Astrophysics of gaseous nebulae and active galactic nuclei (University Science Books)
1989
-
[65]
E., Tran , H
Osterbrock , D. E., Tran , H. D., & Veilleux , S. 1992, , 389, 305, 10.1086/171206
1992 doi
-
[66]
2010, , 516, A13, 10.1051/0004-6361/200913932
Palacios , A., Gebran , M., Josselin , E., et al. 2010, , 516, A13, 10.1051/0004-6361/200913932
2010 doi
-
[67]
1977, , 179, 217, 10.1093/mnras/179.2.217
Peimbert , M., & Torres-Peimbert , S. 1977, , 179, 217, 10.1093/mnras/179.2.217
1977 doi
- [68]
-
[69]
Rela \ n o , M., & Beckman , J. E. 2005, , 430, 911, 10.1051/0004-6361:20041708
2005 doi
-
[70]
R., Taylor , J
Roman-Duval , J., Proffitt , C. R., Taylor , J. M., et al. 2020, Research Notes of the American Astronomical Society, 4, 205, 10.3847/2515-5172/abca2f
2020 doi
-
[71]
E., de Koter , A., et al
Sana , H., de Mink , S. E., de Koter , A., et al. 2012, Science, 337, 444, 10.1126/science.1223344
2012 doi
-
[72]
S \'a nchez , S. F. 2006, Astronomische Nachrichten, 327, 850, 10.1002/asna.200610643
2006 doi
-
[73]
2020, , 58, 99, 10.1146/annurev-astro-012120-013326
---. 2020, , 58, 99, 10.1146/annurev-astro-012120-013326
2020 doi
- [74]
-
[75]
F., Cardiel , N., Verheijen , M
S \'a nchez , S. F., Cardiel , N., Verheijen , M. A. W., et al. 2007c, , 465, 207, 10.1051/0004-6361:20066620
-
[76]
F., P \'e rez , E., Rosales-Ortega , F
S \'a nchez , S. F., P \'e rez , E., Rosales-Ortega , F. F., et al. 2015, , 574, A47, 10.1051/0004-6361/201424873
2015 doi
-
[77]
F., P \'e rez , E., S \'a nchez-Bl \'a zquez , P., et al
S \'a nchez , S. F., P \'e rez , E., S \'a nchez-Bl \'a zquez , P., et al. 2016 a , , 52, 21. 1509.08552
2016 arXiv
- [78]
-
[79]
F., Avila-Reese , V., Rodr \' guez-Puebla , A., et al
S \'a nchez , S. F., Avila-Reese , V., Rodr \' guez-Puebla , A., et al. 2019 a , , 482, 1557, 10.1093/mnras/sty2730
2019 doi
-
[80]
F., Barrera-Ballesteros , J
S \'a nchez , S. F., Barrera-Ballesteros , J. K., L \'o pez-Cob \'a , C., et al. 2019 b , , 484, 3042, 10.1093/mnras/stz019
2019 doi
-
[81]
F., Barrera-Ballesteros , J
S \'a nchez , S. F., Barrera-Ballesteros , J. K., Lacerda , E., et al. 2022, , 262, 36, 10.3847/1538-4365/ac7b8f
2022 doi
-
[82]
F., Jim \'e nez-Vicente , J., et al
S \'a nchez-Bl \'a zquez , P., Peletier , R. F., Jim \'e nez-Vicente , J., et al. 2006, , 371, 703, 10.1111/j.1365-2966.2006.10699.x
2006
-
[83]
2019, , 882, 9, 10.3847/1538-4357/ab3044
S \'a nchez-Menguiano , L., S \'a nchez Almeida , J., Mu \ n oz-Tu \ n \'o n , C., et al. 2019, , 882, 9, 10.3847/1538-4357/ab3044
2019 doi
-
[84]
F., P \'e rez , I., et al
S \'a nchez-Menguiano , L., S \'a nchez , S. F., P \'e rez , I., et al. 2018, , 609, A119, 10.1051/0004-6361/201731486
2018 doi
- [85]
-
[86]
Tinsley , B. M. 1972, , 20, 383
1972
-
[87]
S., Mehner , A., Crowther , P
Vink , J. S., Mehner , A., Crowther , P. A., et al. 2023, , 675, A154, 10.1051/0004-6361/202245650
2023 doi
-
[88]
J., Coelho , P
Walcher , C. J., Coelho , P. R. T., Gallazzi , A., et al. 2015, , 582, A46, 10.1051/0004-6361/201525924
2015 doi
-
[89]
2011, , 331, 1, 10.1007/s10509-010-0458-z
Walcher , J., Groves , B., Budav \'a ri , T., & Dale , D. 2011, , 331, 1, 10.1007/s10509-010-0458-z
2011 doi
-
[90]
M., Monreal-Ibero , A., Kollatschny , W., et al
Weilbacher , P. M., Monreal-Ibero , A., Kollatschny , W., et al. 2015, , 582, A114, 10.1051/0004-6361/201526529
2015 doi
-
[91]
B., Cappellari , M., Bershady , M
Westfall , K. B., Cappellari , M., Bershady , M. A., et al. 2019, , 158, 231, 10.3847/1538-3881/ab44a2
2019 doi
-
[92]
M., Maraston , C., Goddard , D., Thomas , D., & Parikh , T
Wilkinson , D. M., Maraston , C., Goddard , D., Thomas , D., & Parikh , T. 2017, , 472, 4297, 10.1093/mnras/stx2215
2017 doi
-
[93]
2019, , 883, 175, 10.3847/1538-4357/ab3ebc
Yan , R., Chen , Y., Lazarz , D., et al. 2019, , 883, 175, 10.3847/1538-4357/ab3ebc
2019 doi
Reviewed August 12, 2026 · model on record in the stance chip above.
Discussion (0). Continue with ORCID to comment.