REVIEW 3 major objections 5 minor 1 cited by
Analyses of Multiple Balmer Emission Lines from Accreting Brown Dwarfs and Very Low Mass Stars
T0 review · 3 major / 5 minor · reviewed 2026-08-12 · deepseek-v4-flash
Pith's one-line read For 89 archival data points on accreting brown dwarfs and very low-mass stars, Balmer line ratios identify 15 as shock-dominated and 55 as flow-dominated emission.
desk verdict A useful first census of Balmer-line emission mechanisms in brown dwarfs, but the headline 15/55 split rests on an unvalidated 10% error floor. read the letter →
The pith
A machine-rendered reading of the paper's core claim, the machinery that carries it, and where it could break.
The reading
What carries the argument
The load-bearing object is the $\mathrm{H}\beta/\mathrm{H}\gamma$ versus $\mathrm{H}\beta/\mathrm{H}8$ line-ratio diagram. $\mathrm{H}\beta/\mathrm{H}\gamma$ mainly tracks the temperature of the emitting gas, while the inclusion of H8, the $n=8$ Balmer line at 388.9 nm, separates the two models: in the accretion flow model the higher levels are populated partly by recombination, so $\mathrm{H}\beta/\mathrm{H}8$ is lower than in the shock model. The shock locus comes from the post-shock cooling gas modeled with one-dimensional thermo-hydrodynamics, chemistry, and radiative transfer, and the flow locus comes from a constant-temperature slab with Sobolev escape probabilities. The diagram is what lets the authors turn archival multi-line spectra into a per-object mechanism assignment; without the H8 ratio the two loci overlap too much in the lower-left corner.
What would settle it
Compute a radiative-transfer model that includes both the infalling accretion flow and the shock at its base as a single structure; if that hybrid model fills the empty region between the two loci in the $\mathrm{H}\beta/\mathrm{H}\gamma$ versus $\mathrm{H}\beta/\mathrm{H}8$ diagram, then the binary 15-of-89 versus 55-of-89 classification loses its foundation. Alternatively, observe the five objects that switched categories with simultaneous Hβ and Paschen lines to see whether the flip is reproduced in an independent hydrogen series.
Extended reading notes
Core claim
The central claim is that archival Balmer line ratios can classify the dominant accretion-emission mechanism of individual brown dwarfs and very low-mass stars: 15 of 89 usable data points are best described by the accretion shock model, while 55 are best described by the accretion flow model. The diagnostic is the ratio pair $\mathrm{H}\beta/\mathrm{H}\gamma$ versus $\mathrm{H}\beta/\mathrm{H}8$, which separates the two model loci because the higher hydrogen level H8 is populated by recombination as well as by collisional excitation, lowering $\mathrm{H}\beta/\mathrm{H}8$ in the flow model. For the 15 shock-classified points, converting the Hβ luminosity through the shock model yields mass accretion rates up to several times those obtained by extrapolating stellar scaling relations, and the discrepancy grows as the accretion rate falls; if the empirical $\dot{M}\propto M^2$ trend holds into the planetary regime, the difference can reach one to two orders of magnitude. The paper also reports that the ratio classification flips between shock and flow at different epochs for five objects, and that high-resolution line profiles show central absorption in a flow-dominated object and a single peak in a shock-dominated object.
Load-bearing premise
The whole classification rests on the assumption that shock and flow emission are the only two ways the gas can make the observed Balmer lines, so any point that fits neither locus is written off as chromospheric activity or noise, and that the shock model's coarser grid does not hide additional valid configurations.
Editorial extensions
If this is right
- A single multi-line spectrum covering Hβ, Hγ, and H8 can place a brown dwarf or very low-mass star on the shock or flow locus, giving a per-object mechanism assignment rather than a one-size-fits-all model.
- For shock-dominated objects, accretion rates estimated from stellar scaling relations should be revised upward; in this sample the correction is up to several times, and the paper's extrapolation to planetary masses widens it to one to two orders of magnitude.
- The flow model still describes the majority of the sample, so stellar-origin accretion flow treatment remains relevant for most substellar objects.
- Five objects switch between the shock and flow categories at different epochs, so a single-epoch classification is not a permanent label for the object.
- Line profiles are a secondary diagnostic: central absorption points to flow emission, while a single central peak can be either shock or high-temperature flow, making ratios the more reliable discriminator.
Reading between the lines
- Extension: applying the same two-locus test to directly imaged planets using Paschen or Brackett line ratios could test whether the shock fraction grows at planetary masses; the paper only extrapolates the mass-accretion-rate trend and does not claim the fraction itself would grow.
- Extension: the five objects that flip categories between epochs hint that the accretion geometry or inflow temperature changes on observable timescales, so a dedicated high-cadence monitoring campaign of Balmer ratios could reveal what drives the switch.
- Extension: a radiative-transfer model that includes both the infalling flow and the shock at its base, treated as one structure rather than two alternatives, would show whether intermediate configurations fill the gap between the loci; if they do, the 15/55 split would need reinterpretation.
Signed reviews
Editorial analysis
A structured set of objections, weighed in public.
Referee Report
Summary. The paper applies two published emission-line models (the accretion shock model of Aoyama et al. 2018 and the accretion flow model of Kwan & Fischer 2011) to archival Balmer line ratios (Hβ/Hγ versus Hβ/H8) for 89 data points from 76 accreting brown dwarfs and very low-mass stars. It classifies 15 points as shock-dominated, 55 as flow-dominated, 13 as consistent with both, and 6 as consistent with neither, based on 1σ error-ellipse overlap with the model loci. For the 15 shock-dominated points, the shock model yields mass accretion rates up to an order of magnitude higher than the extrapolated stellar scaling at the low-mass end. The paper also reports new Subaru/HDS spectroscopy of three targets, examines the absence of a clear boundary in physical parameters between the two categories, and documents epoch-to-epoch variability of the line-ratio classification for five objects.
Significance. The central claim, if robust, would provide a practical line-ratio diagnostic for identifying the dominant accretion-emission mechanism in substellar objects, which is directly relevant to interpreting accretion-rate estimates for brown dwarfs and giant planets. The use of a relatively large archival sample and the explicit comparison of two physical models is valuable, and the inclusion of new high-resolution spectroscopy adds useful data. The paper is transparent about the ad hoc 10% error floor and the extrapolation of the chromospheric-activity relation, but the lack of sensitivity analysis makes the headline classification counts and the subsequent accretion-rate comparison insufficiently robust. The strength of the paper is its clear formulation of the diagnostic; the main weakness is the unvalidated choices in the classification procedure, which are load-bearing for the quantitative claims.
major comments (3)
- [§4.1] The 10% error floor assigned to data points without reported errors or with errors below 10% is an arbitrary intervention that directly inflates the error ellipses used for classification. For example, the 2021-04-27 epoch of J08440915−7833457 in Table 2 has reported errors of 0.00 and 0.01 in Hβ/Hγ and Hβ/H8, respectively, which become ±0.13 and ±0.25 under the floor. Because the overlap classification depends on the ellipse size, the floor systematically reduces the 'neither' category and can shift points between shock, flow, and both categories. The paper provides no sensitivity test (e.g., 5% floor, no floor, or a floor based on independently estimated flux-calibration uncertainties). Since the central census (15 shock vs 55 flow) and the accretion-rate comparison for the 15 shock points are built on this classification, the headline quantitative result is not robust to this choice. A sensitivity analysis should be provided, and the floor should be justified with actual measurement-uncertainty information.
- [§3, Figure 1 caption] The caption admits that the shock-model grid is coarser than the flow-model grid and asserts without demonstration that 'this does not impact our overall results.' If the shock locus is missing regions of physically allowed parameter space because of the coarse grid, data points in those regions could be misclassified as flow, both, or neither. The classification counts and the subsequent accretion-rate comparison for shock-dominated points are therefore potentially sensitive to the grid resolution. The authors should either run a finer shock grid or demonstrate quantitatively that the existing grid covers the relevant parameter space at sufficient resolution, e.g., by showing that no gap in the shock locus is large enough to affect the classification of any of the 89 data points.
- [§5.1, Appendix B] The chromospheric-activity exclusion of 7 data points relies on the Manara et al. (2013, 2017) relation, which is validated only for 3.35 ≲ log(Teff/K) ≲ 3.65. The coolest object, 2M1115 (J11151597+1937266, log Teff ≈ 3.23), is classified as shock-dominated in Table 2, and this classification depends on an extrapolation of the chromospheric-activity locus down to log(Teff/K) = 3.2. If the extrapolation is incorrect, 2M1115 could be chromospherically dominated and should be excluded, reducing the shock sample from 15 to 14 points and changing the accretion-rate comparison in §5.2. The paper should test the sensitivity of the classification to this extrapolation, for example by excluding 2M1115 from the shock sample and re-evaluating the main results, or by using an alternative chromospheric-activity criterion that does not require extrapolation.
minor comments (5)
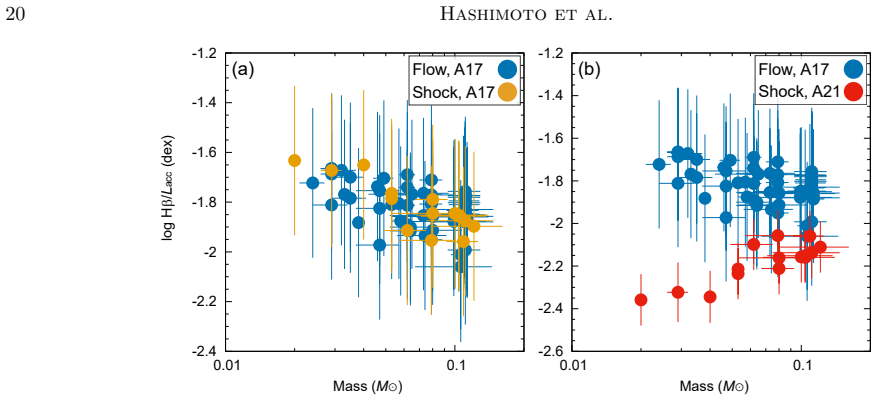
- [Abstract and §5.2] The abstract states that the shock model gives accretion rates 'up to several times higher' than the stellar scaling, but Figure 5 shows ratios reaching approximately 10 (one order of magnitude) for the lowest accretion rates; consider rephrasing to 'up to an order of magnitude higher' to match the figure.
- [§4.1] The classification uses 1σ error ellipses, but the choice of 1σ is not discussed; a brief justification or a check of how the counts change with, e.g., 2σ ellipses would strengthen the interpretation.
- [Table 2] In the table caption, the column labeled 'Em?' is not defined; it would be clearer to spell out 'Emission mechanism' in the caption.
- [Figure 1] The axis labels in panel (b) appear garbled (the text '8 654321 654321' near the axes); please check the figure and ensure the tick labels are rendered correctly.
- [§5.1] The sentence 'Strictly speaking, the chromospheric activity relation in Manara et al. (2013, 2017) cannot be applied to objects with shock-dominated emission' is followed by an argument that the identification remains the same; this argument is not fully convincing and should be supported by a more explicit derivation or a test using both conversions.
Circularity Check
No significant circularity: the 15/55 classification is an empirical comparison to external model loci, not a quantity derived from its own inputs.
full rationale
The paper's central claims are a classification of archival Balmer line ratios against pre-existing model loci and a subsequent application of published Lacc-Lline conversions. The shock model loci come from Aoyama et al. (2018, 2021) and the flow model from Kwan & Fischer (2011) as implemented in Aoyama et al. (2024); these are external model predictions with stated physical parameters, not quantities fitted to the 96 data points analyzed here. The classification in Section 4.1 is a direct comparison of observed ratios to these published loci, so the counts of 15 shock, 55 flow, 13 both, and 6 neither are not forced by construction from the paper's own equations. The accretion-rate comparison in Section 5.2 applies two independent Lacc-Lline relations to the same H-beta luminosity; the resulting ratio is a property of the two calibrations, but the paper does not present this as a derivation of those calibrations from the data. The 10% error floor in Section 4.1 is a methodological choice that can affect the classification counts, and the assertion that the coarse shock grid does not impact the results is not demonstrated, but these are robustness concerns rather than circularity. Self-citations to Aoyama et al. are load-bearing in the sense that the models are taken from those papers, but the cited results are parameterized physical models with assumptions that do not include the present target classification, so they constitute independent support rather than circular reasoning.
Assumptions & free parameters
free parameters (3)
- 10% error floor =
0.10 in line ratios
- 1-sigma chromospheric threshold =
1 sigma about the Manara et al. relation
- log Teff extrapolation limit =
log Teff = 3.2 dex
assumptions (5)
- domain assumption Emission is dominated by one of three mechanisms: accretion flow, accretion shock, or chromosphere, with negligible contributions from winds and outflows in H-beta, H-gamma, and H8.
- domain assumption The slab model of Kwan & Fischer (2011) with constant T and nH adequately represents accretion-flow line emission.
- domain assumption The 1D shock model grid (Aoyama et al. 2018) spans the plausible range of pre-shock velocity and density.
- domain assumption The Lacc-Lline conversions of Alcala et al. (2017) and Aoyama et al. (2021) can be applied to all sample objects.
- domain assumption The chromospheric-activity relation of Manara et al. (2013, 2017) remains valid when extrapolated below log Teff = 3.35.
Cite this review
Pith. "Pith review of Analyses of Multiple Balmer Emission Lines from Accreting Brown Dwarfs and Very Low Mass Stars." pith.science (2026). https://pith.science/paper/W5SVJ4KH
@misc{pith2026241112133,
  author       = {Pith},
  title        = {Pith review of: Analyses of Multiple Balmer Emission Lines from Accreting Brown Dwarfs and Very Low Mass Stars},
  year         = {2026},
  howpublished = {\url{https://pith.science/paper/W5SVJ4KH}},
  note         = {Machine review of arXiv:2411.12133}
}
abstract
A planetary growth rate, a.k.a., the mass accretion rate, is a fundamental parameter in planet formation, as it determines a planet's final mass. Planetary mass accretion rates have been estimated using hydrogen lines, based on the models originally developed for accreting stars, known as the accretion flow model. Recently, Aoyama et al. (2018) introduced the accretion shock model as an alternative mechanism for hydrogen line emission. However, it remains unclear which model is more appropriate for accreting planets and substellar objects. To address this, we applied both models to archival data consisting of 96 data points from 76 accreting brown dwarfs and very low-mass stars, with masses ranging from approximately 0.02 to 0.1 $M_\sun$, to test which model best explains their accreting properties. The results showed that the emission mechanisms of 15 data points are best explained by the shock model, while 55 data points are best explained by the flow model. For the 15 data points explained by the planetary shock model, the shock model estimates up to several times higher mass accretion rates than the flow model. As this trend is more pronounced for planetary mass objects, it is crucial to determine which emission mechanism is dominant in individual planets. We also discuss the physical parameters that determine the emission mechanisms and the variability of line ratios.
Figures


Figures from the paper (8 more)



Forward citations
Cited by 1 Pith paper
-
Detection of Hydrocarbons in the Disk around an Actively-Accreting Planetary-Mass Object
The planetary-mass free-floating object Cha 1107-7626 shows mid-infrared emission lines from methane and ethylene in its disk, the first such hydrocarbon detection in a disk around a free-floating planetary-mass object.
Reference graph
Works this paper leans on
-
[1]
, " * write output.state after.block = add.period write newline
ENTRY address archivePrefix author booktitle chapter doi edition editor eprint howpublished institution journal key month number organization pages publisher school series title misctitle type volume year version url label extra.label sort.label short.list INTEGERS output.state before.all mid.sentence after.sentence after.block FUNCTION init.state.consts ...
-
[2]
write newline
" write newline "" before.all 'output.state := FUNCTION format.url url empty "" new.block "" url * "" * if FUNCTION format.eprint eprint empty "" archivePrefix empty "" archivePrefix "arXiv" = new.block " " eprint * " " * new.block " " eprint * " " * if if if FUNCTION format.doi doi empty "" " " doi * " " * if FUNCTION format.pid doi empty eprint empty ur...
-
[3]
" id="W5M0MpCehiHzreSzNTczkc9d
thebibliography [1] 20pt to REFERENCES 6pt =0pt -12pt 10pt plus 3pt =0pt =0pt =1pt plus 1pt =0pt =0pt -12pt =13pt plus 1pt =20pt =13pt plus 1pt \@M =10000 =-1.0em =0pt =0pt 0pt =0pt =1.0em @enumiv\@empty 10000 10000 `\.\@m \@noitemerr \@latex@warning Empty `thebibliography' environment \@ifnextchar \@reference \@latexerr Missing key on reference command E...
-
[4]
Alcal \'a , J. M., Natta , A., Manara , C. F., et al. 2014, , 561, A2, 10.1051/0004-6361/201322254
-
[5]
Alcal \'a , J. M., Manara , C. F., Natta , A., et al. 2017, , 600, A20, 10.1051/0004-6361/201629929
-
[6]
Almendros-Abad , V., Manara , C. F., Testi , L., et al. 2024, , 685, A118, 10.1051/0004-6361/202348649
-
[7]
2018, , 866, 84, 10.3847/1538-4357/aadc11
Aoyama , Y., Ikoma , M., & Tanigawa , T. 2018, , 866, 84, 10.3847/1538-4357/aadc11
-
[8]
2024, , 168, 155, 10.3847/1538-3881/ad67df
Aoyama , Y., Marleau , G.-D., & Hashimoto , J. 2024, , 168, 155, 10.3847/1538-3881/ad67df
Show all 63 references
-
[9]
2021, , 917, L30, 10.3847/2041-8213/ac19bd
Aoyama , Y., Marleau , G.-D., Ikoma , M., & Mordasini , C. 2021, , 917, L30, 10.3847/2041-8213/ac19bd
2021 doi
-
[10]
P., Tollerud , E
Astropy Collaboration , Robitaille , T. P., Tollerud , E. J., et al. 2013, , 558, A33, 10.1051/0004-6361/201322068
2013 doi
-
[11]
M., Sip o cz , B
Astropy Collaboration , Price-Whelan , A. M., Sip o cz , B. M., et al. 2018, , 156, 123, 10.3847/1538-3881/aabc4f
2018 doi
-
[12]
M., Lim , P
Astropy Collaboration , Price-Whelan , A. M., Lim , P. L., et al. 2022, , 935, 167, 10.3847/1538-4357/ac7c74
2022 doi
-
[13]
S., Allard , F., & Hauschildt , P
Baraffe , I., Chabrier , G., Barman , T. S., Allard , F., & Hauschildt , P. H. 2003, , 402, 701, 10.1051/0004-6361:20030252
2003 doi
-
[14]
2015, , 577, A42, 10.1051/0004-6361/201425481
Baraffe , I., Homeier , D., Allard , F., & Chabrier , G. 2015, , 577, A42, 10.1051/0004-6361/201425481
2015 doi
-
[15]
Barrado y Navascu \'e s , D., & Mart \' n , E. L. 2003, , 126, 2997, 10.1086/379673
2003 doi
-
[16]
1982, , 47, 419
Bertout , C., Wolf , B., Carrasco , L., & Mundt , R. 1982, , 47, 419
1982
-
[17]
K., Follette , K
Betti , S. K., Follette , K. B., Ward-Duong , K., et al. 2022, , 935, L18, 10.3847/2041-8213/ac85ef
2022 doi
- [18]
-
[19]
1998, The Astrophysical Journal, 509, 802, 10.1086/306527
Calvet , N., & Gullbring , E. 1998, The Astrophysical Journal, 509, 802, 10.1086/306527
1998 doi
-
[20]
1992, , 386, 239, 10.1086/171010
Calvet , N., & Hartmann , L. 1992, , 386, 239, 10.1086/171010
1992 doi
-
[21]
A., Clayton , G
Cardelli , J. A., Clayton , G. C., & Mathis , J. S. 1989, , 345, 245, 10.1086/167900
1989 doi
-
[22]
2023, , 671, A119, 10.1051/0004-6361/202243832
Chabrier , G., Baraffe , I., Phillips , M., & Debras , F. 2023, , 671, A119, 10.1051/0004-6361/202243832
2023 doi
-
[23]
M., Dumas , C., et al
Chauvin , G., Lagrange , A. M., Dumas , C., et al. 2004, , 425, L29, 10.1051/0004-6361:200400056
2004 doi
-
[24]
H., et al
Delorme , P., Gagn \'e , J., Girard , J. H., et al. 2013, , 553, L5, 10.1051/0004-6361/201321169
2013 doi
-
[25]
2023, , 676, A123, 10.1051/0004-6361/202346221
Demars , D., Bonnefoy , M., Dougados , C., et al. 2023, , 676, A123, 10.1051/0004-6361/202346221
2023 doi
-
[26]
1994, , 108, 1056, 10.1086/117134
Edwards , S., Hartigan , P., Ghandour , L., & Andrulis , C. 1994, , 108, 1056, 10.1086/117134
1994 doi
-
[27]
2023, , 945, 112, 10.3847/1538-4357/acb2c9
Fang , M., Pascucci , I., Edwards , S., et al. 2023, , 945, 112, 10.3847/1538-4357/acb2c9
2023 doi
- [28]
-
[29]
Gaia Collaboration , Prusti , T., de Bruijne , J. H. J., et al. 2016, , 595, A1, 10.1051/0004-6361/201629272
2016 doi
-
[30]
Gaia Collaboration , Vallenari , A., Brown , A. G. A., et al. 2023, , 674, A1, 10.1051/0004-6361/202243940
2023 doi
-
[31]
1998, , 492, 323, 10.1086/305032
Gullbring , E., Hartmann , L., Brice \ n o , C., & Calvet , N. 1998, , 492, 323, 10.1086/305032
1998 doi
-
[32]
2016, , 54, 135, 10.1146/annurev-astro-081915-023347
Hartmann , L., Herczeg , G., & Calvet , N. 2016, , 54, 135, 10.1146/annurev-astro-081915-023347
2016 doi
-
[33]
1994, , 426, 669, 10.1086/174104
Hartmann , L., Hewett , R., & Calvet , N. 1994, , 426, 669, 10.1086/174104
1994 doi
-
[34]
J., & Hillenbrand , L
Herczeg , G. J., & Hillenbrand , L. A. 2008, , 681, 594, 10.1086/586728
2008 doi
-
[35]
Hunter, J. D. 2007, Computing in Science & Engineering, 9, 90, 10.1109/MCSE.2007.55
2007 doi
-
[36]
Joy , A. H. 1945, , 102, 168, 10.1086/144749
1945 doi
-
[37]
2011, , 411, 2383, 10.1111/j.1365-2966.2010.17863.x
Kwan , J., & Fischer , W. 2011, , 411, 2383, 10.1111/j.1365-2966.2010.17863.x
2011
-
[38]
L., Tremblin , P., Birkmann , S
Luhman , K. L., Tremblin , P., Birkmann , S. M., et al. 2023, , 949, L36, 10.3847/2041-8213/acd635
2023 doi
-
[39]
F., Frasca , A., Alcal \'a , J
Manara , C. F., Frasca , A., Alcal \'a , J. M., et al. 2017, , 605, A86, 10.1051/0004-6361/201730807
2017 doi
-
[40]
F., Testi , L., Rigliaco , E., et al
Manara , C. F., Testi , L., Rigliaco , E., et al. 2013, , 551, A107, 10.1051/0004-6361/201220921
2013 doi
-
[41]
2024, , 964, 70, 10.3847/1538-4357/ad1ee9
Marleau , G.-D., Aoyama , Y., Hashimoto , J., & Zhou , Y. 2024, , 964, 70, 10.3847/1538-4357/ad1ee9
2024 doi
-
[42]
1998 a , , 492, 743, 10.1086/305069
Muzerolle , J., Calvet , N., & Hartmann , L. 1998 a , , 492, 743, 10.1086/305069
1998 doi
- [43]
-
[44]
1998 b , , 116, 455, 10.1086/300428
Muzerolle , J., Hartmann , L., & Calvet , N. 1998 b , , 116, 455, 10.1086/300428
1998 doi
-
[45]
2004, , 424, 603, 10.1051/0004-6361:20040356
Natta , A., Testi , L., Muzerolle , J., et al. 2004, , 424, 603, 10.1051/0004-6361:20040356
2004 doi
-
[46]
B., Cohen , J
Oke , J. B., Cohen , J. G., Carr , M., et al. 1995, , 107, 375, 10.1086/133562
1995 doi
-
[47]
C., Viswanath , G., Aoyama , Y., et al
Ringqvist , S. C., Viswanath , G., Aoyama , Y., et al. 2023, , 669, L12, 10.1051/0004-6361/202245424
2023 doi
-
[48]
R., et al
Santamar \' a-Miranda , A., C \'a ceres , C., Schreiber , M. R., et al. 2018, Monthly Notices of the Royal Astronomical Society, 475, 2994, 10.1093/mnras/stx3325
2018 doi
-
[49]
Stamatellos , D., & Herczeg , G. J. 2015, , 449, 3432, 10.1093/mnras/stv526
2015 doi
-
[50]
2002, , 580, 506, 10.1086/343069
Tanigawa , T., & Watanabe , S.-i. 2002, , 580, 506, 10.1086/343069
2002 doi
-
[51]
Thanathibodee , T., Calvet , N., Bae , J., Muzerolle , J., & Hern \'a ndez , R. F. 2019, , 885, 94, 10.3847/1538-4357/ab44c1
2019 doi
-
[52]
2022, , 163, 74, 10.3847/1538-3881/ac3ee6
Thanathibodee , T., Calvet , N., Hern \'a ndez , J., Mauc \'o , K., & Brice \ n o , C. 2022, , 163, 74, 10.3847/1538-3881/ac3ee6
2022 doi
-
[53]
A., Burgasser , A
Theissen , C. A., Burgasser , A. J., Bardalez Gagliuffi , D. C., et al. 2018, , 853, 75, 10.3847/1538-4357/aaa0cf
2018 doi
-
[54]
A., West , A
Theissen , C. A., West , A. A., Shippee , G., Burgasser , A. J., & Schmidt , S. J. 2017, , 153, 92, 10.3847/1538-3881/153/3/92
2017 doi
-
[55]
1986, in Society of Photo-Optical Instrumentation Engineers (SPIE) Conference Series, Vol
Tody , D. 1986, in Society of Photo-Optical Instrumentation Engineers (SPIE) Conference Series, Vol. 627, Instrumentation in astronomy VI, ed. D. L. Crawford , 733, 10.1117/12.968154
1986 doi
-
[56]
C., & Varoquaux , G
van der Walt , S., Colbert , S. C., & Varoquaux , G. 2011, Computing in Science and Engineering, 13, 22, 10.1109/MCSE.2011.37
2011 doi
-
[57]
M., et al
Venuti , L., Stelzer , B., Alcal \'a , J. M., et al. 2019, , 632, A46, 10.1051/0004-6361/201935745
2019 doi
-
[58]
2011, , 536, A105, 10.1051/0004-6361/201117752
Vernet , J., Dekker , H., D'Odorico , S., et al. 2011, , 536, A105, 10.1051/0004-6361/201117752
2011 doi
- [59]
-
[60]
Wilson , T. J. G., Matt , S., Harries , T. J., & Herczeg , G. J. 2022, , 514, 2162, 10.1093/mnras/stac1397
2022 doi
-
[61]
G., Adelman , J., Anderson , John E., J., et al
York , D. G., Adelman , J., Anderson , John E., J., et al. 2000, , 120, 1579, 10.1086/301513
2000 doi
-
[62]
J., Kraus , A
Zhou , Y., Herczeg , G. J., Kraus , A. L., Metchev , S., & Cruz , K. L. 2014, The Astrophysical Journal, 783, L17, 10.1088/2041-8205/783/1/L17
2014 doi
-
[63]
P., Wagner , K
Zhou , Y., Bowler , B. P., Wagner , K. R., et al. 2021, , 161, 244, 10.3847/1538-3881/abeb7a
2021 doi
Reviewed August 12, 2026 · model on record in the stance chip above.
Discussion (0). Continue with ORCID to comment.