REVIEW 3 major objections 5 minor 16 references
Static Reuse Profile Estimation for Array Applications
T0 review · 3 major / 5 minor · reviewed 2026-08-12 · deepseek-v4-flash
Pith's one-line read A static, compile-time model predicts cache hit rates within 95% of dynamic tracing, without running the program or collecting memory traces.
desk verdict Genuine incremental step on static reuse profiling, but the dilation predictor is a black box and the 95% headline isn't checkable without the algorithm. read the letter →
The pith
A machine-rendered reading of the paper's core claim, the machinery that carries it, and where it could break.
The reading
What carries the argument
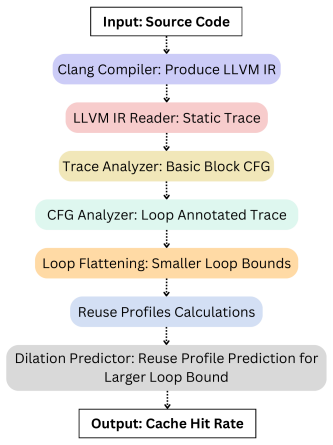
The load-bearing object is the bracketed loop-annotated trace: a compact, closed-form representation of the kernel's memory accesses (e.g., 'i, [300~i, i, j, [200~j, ...]]') obtained from the LLVM IR's control flow graph and basic-block execution counts. A recursive algorithm flattens this trace for small bounds and computes exact reuse-distance histograms with an LRU stack plus a hash-set count of unique intervening references. The extrapolation engine then applies Equation 1 (linear scaling of inner-loop frequencies), Equations 2 and 3 (multilinear polynomials in loop-bound distances with interaction coefficients $Coff_{JK}$ and $Coff_{IJK}$), and a separate dilation predictor that takes reuse-distance lists from three small profiles (e.g., 2-2-2, 2-2-3, 2-3-2) and outputs the starting distance, list size, and per-position increments for the target bound. The SDCM analytical cache model converts the predicted histogram into a cache hit rate.
What would settle it
Run the static predictor on a three-level affine kernel where an array index depends on the product of two loop variables (so some reuse distances grow quadratically), with small-bound fits taken at 2-2-2, 2-2-3, and 2-3-2 and the target at, say, 100-100-100; compare the predicted histogram to PARDA's. If the product-dependent reuse distances are mispredicted or missing, the polynomial-extrapolation premise is refuted.
Extended reading notes
Core claim
The central claim is that a static analysis pipeline can reproduce the reuse profile that dynamic tracing would produce for affine loop nests over arrays by (1) parsing LLVM IR into a bracketed loop-annotated trace, (2) computing exact reuse-distance histograms via an LRU stack for tiny loop bounds, and (3) treating the frequency of each reuse distance as a low-degree polynomial in the loop bounds—degree equal to the nesting depth—with coefficients read off from the small-bound profiles, plus a separate dilation predictor that constructs the list of reuse distances that appear, disappear, or shift as an outer loop grows. Applied to six PolyBench kernels, the model predicts reuse profiles with 100% accuracy for Atax, Gemver, and Trmm, 92.37% for Mvt, 86.74% for 2mm, and 86.19% for 3mm relative to PARDA; the resulting cache hit rates match PARDA exactly for the first three and are about 7 to 10 percentage points lower for the last three, giving an average accuracy of roughly 95%.
Load-bearing premise
The reuse-distance histogram is assumed to be a low-degree polynomial of the loop bounds, with coefficients fitted from tiny bounds like 2-2-2 that remain valid at the full bounds; the paper asserts this and tests it on six kernels, but never derives it, and its own results show it partially fails for 2mm and 3mm.
Editorial extensions
If this is right
- For two-level affine loop nests, the reuse profile can be predicted exactly (100% histogram match on Atax, Gemver, and Trmm), so cache hit rates for such kernels can be obtained at compile time with no trace collection.
- The prediction time is near-constant in the loop bounds once the small profiles are built, in contrast to dynamic tools whose time grows sharply with input size.
- The same equations produce cache hit rates within about 5% of dynamic results on average across the six tested kernels, suggesting the approach is usable for early design-space exploration.
- Failures are concentrated in three-level nests where the dilation predictor misses some reuse distances (e.g., 106 and 2146 in 3mm), so the gap between static and dynamic hit rates is attributable to dilation prediction, not to the frequency equations alone.
Reading between the lines
- If the polynomial ansatz is valid, the same coefficient-fitting idea could extend to stencil or sparse kernels by treating loop-bound scaling as a multivariate rational function, but the paper does not test that.
- The dilation predictor's reliance on only three small profiles is the natural place to probe: feeding it four or five profiles, or profiles at non-consecutive bounds, may remove the missed distances seen in 2mm and 3mm without changing the method's compile-time character.
- The 95% average is dominated by the exact hits on three kernels; a stricter test would weight by total memory references, under which the 3mm discrepancy (about 8 percentage points of hit rate) would weigh much more heavily.
- Extending to if-else branches would require replacing the deterministic loop-annotated trace with a distribution over traces, which the paper explicitly leaves for future work.
Editorial analysis
A structured set of objections, weighed in public.
Referee Report
Summary. This paper proposes a static, LLVM-IR-based method for estimating reuse-distance profiles and cache hit rates of loop-based array kernels. The authors flatten a loop-annotated static trace, compute reuse profiles for small loop bounds with an LRU-stack algorithm, and then extrapolate to full bounds using polynomial relations (Eqs. 1–3) plus a 'dilation predictor' that is meant to handle distances that appear only at larger bounds. They compare predicted reuse histograms and SDCM cache hit rates against PARDA on six PolyBench kernels. They report exact reuse-profile matches for Atax, Gemver, and Trmm; partial accuracy for Mvt (92.37%), 2mm (86.74%), and 3mm (86.19%); and an average cache hit-rate accuracy of about 95%.
Significance. The paper addresses a real pain point: dynamic reuse-distance profiling is expensive, and a compile-time method that avoids trace collection would be valuable. The flattened-trace reuse-profile computation (Algorithm 1) is straightforward and exact on the given trace, and the comparison against an independent dynamic tool (PARDA) is the right validation design. The result, if it could be reproduced, would be a useful approximation for a narrow class of nested-loop kernels. However, the current manuscript does not ship code or data, and the central extrapolation step is under-specified; the significance is therefore conditional on the missing algorithm being provided and validated.
major comments (3)
- [Section 3.7.2, Figure 5] The dilation predictor is the load-bearing component of the extrapolation, but it is not specified as an algorithm. The text only says the predictor 'examines the relationship' between the three lists and gives an example: for k=102 it outputs starting number 207, list size 104, and increments {0,102,103,...,204}. Because Eqs. (1)–(3) only rescale the frequencies of reuse distances that already exist in the baseline profile (compare the distance sets in Table 3), the predicted profile for the full 2-200-102 loop cannot be reconstructed without knowing how these new-distance lists are generated. The failures reported in Section 4.2.1—2mm dilation not captured and 3mm distances 106 and 2146 missing—are exactly failures of this unspecified component. Please provide a complete, executable description of the dilation predictor (pseudocode plus released code/data), or state explicitly which parts of the reported results are not reproducible.
- [Section 3.7.3, Eqs. (1)–(3)] The polynomial model is asserted without derivation. The paper assumes that for a loop nest of depth d, each reuse distance's frequency is a polynomial of degree d in the loop bounds, with coefficients inferred from the 2-2-2, 2-2-3, 2-3-2, and 2-3-3 profiles. The text does not explain why this form is exact or approximately valid for the supported kernels, nor why coefficients fitted at small bounds transfer to large bounds. This is especially important because the method's known failures (Mvt 92.37%, 2mm 86.74%, 3mm 86.19%) are not accounted for by the model. Please provide a structural argument for the polynomial degree (e.g., from the bracketed trace representation) or clearly scope the claim to loop patterns for which the form is proven.
- [Section 4.2.3, Figure 9] The headline 'average accuracy of 95%' is not defined and is difficult to interpret. For Mvt, 2mm, and 3mm the static hit rates are respectively 84.48%, 85.47%, and 85.51% versus dynamic values of 92.11%, 93.13%, and 95.06%; these are differences of 7–10 percentage points. Reporting an average of the per-benchmark ratios hides the fact that only three of the six kernels are matched exactly. Please report the exact metric (mean relative error, mean absolute error, etc.), give per-benchmark numbers in a table, and discuss whether six kernels support the stated average.
minor comments (5)
- [Throughout] The paper uses 'LL VM' in multiple places, including the abstract and references; this should be 'LLVM'.
- [Figure 6] The reuse-distance histograms are difficult to read because the axes are not described in accessible detail and the dynamic and static curves overlap; consider a log-scale x-axis or separate overlaid markers, and explicitly mark missing bins such as distance 106 in 3mm.
- [Algorithm 1] Algorithm 1 returns both `rf` and `inf`, but `inf` is never used in the rest of the paper; either explain its purpose or remove it.
- [Section 3.4] The annotated-trace notation is inconsistent, for example 'A~i~k' in one place and 'A~i~k-0-0' in another; the meaning of the numeric suffixes should be defined and used consistently.
- [Section 4.2.3] There is a typo in 'receptively' that should be 'respectively', and the cache hit-rate discussion would benefit from a table listing per-benchmark absolute hit rates and differences.
Circularity Check
No significant circularity: the large-bound reuse profile is extrapolated from small-bound fits and validated against an external dynamic tool.
full rationale
The paper's derivation is an extrapolation pipeline: LLVM IR is converted to a loop-annotated bracketed trace, flattened traces for small loop bounds are run through Algorithm 1 to obtain reuse histograms, Equations (1)-(3) fit coefficients from those small histograms, and the fitted polynomials are evaluated at the full loop bounds; cache hit rates then come from the external SDCM model and are compared with the external PARDA tool. No target large-bound profile or PARDA output enters the fitting step; the coefficients in Eqs. (1)-(3) are determined only from 2-2-2, 2-2-3, 2-3-2, and 2-3-3 profiles, while the claimed 95% accuracy is measured against an independent dynamic trace-based tool. The Section 3.7.2 dilation predictor is incompletely specified, and the paper admits it fails for 2mm and 3mm, but this is a reproducibility and correctness gap rather than a circular reduction; no equation or result is quoted that is equivalent to its own input by construction. The only overlapping-author citation, [4], supplies the bracketed trace convention, which Section 3.4 re-derives from the LLVM IR, and it is not used to forbid alternatives or to assert uniqueness. Hence no circular step is exhibited, and the appropriate score is 0.
Assumptions & free parameters
free parameters (4)
- Per-reuse-distance baseline frequency B2/B22/B222 =
varies per benchmark and reuse distance (e.g., 35, 11, 37, 25, 5, 12, 7, 9, 10, 11, -1 for the 2-2-2 example)
- Inner-loop increment IncrK =
per reuse distance; e.g., 2, 4, 3, 2 for RD 0, 1, 2, -1 in the Figure 4 example
- Outer-loop and interaction coefficients IncrJ, IncrI, Cof fJK, Cof fIJ, Cof fIK, Cof fIJK =
per benchmark, inferred from profiles 2-2-2, 2-2-3, 2-3-2, 2-3-3
- Dilation predictor outputs (starting RD, list size, increment list) =
e.g., start 207, size 104, cumulative list {0, 102, 103, ..., 204} for the Figure 1 example at k=102
assumptions (4)
- ad hoc to paper For a given reuse distance, its frequency in a loop nest is a polynomial function of the loop bounds, with degree equal to the nesting depth.
- ad hoc to paper The set of reuse distances that change with loop bounds (dilation) can be predicted from just three small-bound profiles.
- domain assumption The CFG branch probabilities and basic-block execution counts are known, and the maximum-probability path is the one to analyze.
- domain assumption The SDCM analytical model [5] correctly converts a reuse profile into a cache hit rate for the chosen LRU cache configuration.
Cite this review
Pith. "Pith review of Static Reuse Profile Estimation for Array Applications." pith.science (2026). https://pith.science/paper/WCWFK35O
@misc{pith2026241113854,
  author       = {Pith},
  title        = {Pith review of: Static Reuse Profile Estimation for Array Applications},
  year         = {2026},
  howpublished = {\url{https://pith.science/paper/WCWFK35O}},
  note         = {Machine review of arXiv:2411.13854}
}
read the original abstract
Reuse distance analysis is a widely recognized method for application characterization that illustrates cache locality. Although there are various techniques to calculate the reuse profile from dynamic memory traces, it is both time and space-consuming due to the requirement to collect dynamic memory traces at runtime. In contrast, static analysis reuse profile estimation is a promisingly faster approach since it is calculated at compile time without running the program or collecting memory traces. This work presents a static analysis technique to estimate the reuse profile of loop-based programs. For an input program, we generate a basic block-level control flow graph and the execution count by analyzing the LLVM IR of the program. We present the memory accesses of the application kernel in a compact bracketed format and use a recursive algorithm to predict the reuse distance histogram. We deploy a separate predictor that unrolls the loop(s) for smaller bounds and generates a temporary reuse distance profile for those small cases. Using these smaller profiles, the reuse profile is extrapolated for the actual loop bound(s). We use this reuse profile to predict the cache hit rate. Results show that our model can predict cache hit rates with an average accuracy of 95% relative to the dynamic reuse profile methods.
Figures


Figures from the paper (6 more)


Reference graph
Works this paper leans on
- [1]
-
[2]
Hybrid, scalable, trace-driven performance modeling of gpgpus
Yehia Arafa, Abdel-Hameed Badawy, Ammar ElWazir, Atanu Barai, Ali Eker, Gopinath Chennupati, Nandakishore Santhi, and Stephan Eidenbenz. Hybrid, scalable, trace-driven performance modeling of gpgpus. In Proceedings of the International Conference for High Performance Computing, Networking, Storage and Analysis, SC ’21, New York, NY, USA, 2021. Association...
arXiv 2021
-
[3]
Atanu Barai, Yehia Arafa, Abdel-Hameed Badawy, Gopinath Chennupati, Nandakishore Santhi, and Stephan Eidenbenz. Ppt-multicore: Performance prediction of openmp applications using reuse profiles and analytical modeling. The Journal of Supercomputing, pages 1–32, 2021
work page 2021
-
[4]
Atanu Barai, Nandakishore Santhi, Abdur Razzak, Stephan Eidenbenz, and Abdel-Hameed A. Badawy. Llvm static analysis for program characterization and memory reuse profile estimation. In Proceed- ings of the International Symposium on Memory Systems, MEMSYS ’23, New York, NY, USA, 2024. Association for Computing Machinery. doi:10.1145/3631882.3631885
-
[5]
An analytical model of locality and caching
Mark Brehob and Richard Enbody. An analytical model of locality and caching. Tech. Rep. MSU-CSE- 99-31, 1999
work page 1999
-
[6]
Static reuse distances for locality-based optimizations in matlab
Arun Chauhan and Chun-Yu Shei. Static reuse distances for locality-based optimizations in matlab. In Proceedings of the 24th ACM International Conference on Supercomputing, ICS ’10, page 295–304, New York, NY, USA, 2010. Association for Computing Machinery. doi:10.1145/1810085.1810125
arXiv 2010
-
[7]
Predicting whole-program locality through reuse distance analysis
Chen Ding and Yutao Zhong. Predicting whole-program locality through reuse distance analysis. SIG- PLAN Not., 38(5):245–257, May 2003. doi:10.1145/780822.781159
-
[8]
Cache replacement based on reuse- distance prediction
Georgios Keramidas, Pavlos Petoumenos, and Stefanos Kaxiras. Cache replacement based on reuse- distance prediction. In 2007 25th International Conference on Computer Design, pages 245–250, 2007. doi:10.1109/ICCD.2007.4601909
Show all 16 references
-
[9]
LL VM: A Compilation Framework for Lifelong Program Analysis & Transformation
Chris Lattner and Vikram Adve. LL VM: A Compilation Framework for Lifelong Program Analysis & Transformation. In Proceedings of the International Symposium on Code Generation and Optimization: Feedback-directed and Runtime Optimization, CGO ’04, pages 75–86, Washington, DC, US...
2004
-
[10]
Parallel loop locality analysis for symbolic thread counts
Fangzhou Liu, Yifan Zhu, Shaotong Sun, Chen Ding, Wesley Smith, and Kaave Seyed Hosseini. Parallel loop locality analysis for symbolic thread counts. In Proceedings of the 2024 International Conference on Parallel Architectures and Compilation Techniques, PACT ’24, page 219–23...
2024
-
[11]
Calculating reuse distance from source code
Sri Hari Krishna Narayanan and Paul Hovland. Calculating reuse distance from source code. 1 2016. URL: https://www.osti.gov/biblio/1366296. 14
2016
-
[12]
Sadayappan
Qingpeng Niu, James Dinan, Qingda Lu, and P. Sadayappan. Parda: A fast parallel reuse distance analysis algorithm. In 2012 IEEE 26th International Parallel and Distributed Processing Symposium, pages 1284–1294, 2012. doi:10.1109/IPDPS.2012.117
2012 doi
-
[13]
Polly- polyhedral optimization in llvm
Louis-No¨ el Pouchet, Armin Gr¨ oßlinger, Andreas Simb¨ urger, Hongbin Zheng, and Tobias Grosser. Polly- polyhedral optimization in llvm. volume 2011, 01 2011
2011
-
[14]
Reuse- tracker: Fast yet accurate multicore reuse distance analyzer
Muhammad Aditya Sasongko, Milind Chabbi, Mandana Bagheri Marzijarani, and Didem Unat. Reuse- tracker: Fast yet accurate multicore reuse distance analyzer. ACM Trans. Archit. Code Optim., 19(1), dec 2021. doi:10.1145/3484199
2021 doi
-
[15]
Studying multicore processor scaling via reuse distance analysis
Meng-Ju Wu, Minshu Zhao, and Donald Yeung. Studying multicore processor scaling via reuse distance analysis. In Proceedings of the 40th Annual International Symposium on Computer Architecture, ISCA ’13, page 499–510, New York, NY, USA, 2013. Association for Computing Machinery...
2013
-
[2024]
doi:10.1145/3656019.3676948
Association for Computing Machinery. doi:10.1145/3656019.3676948
Reviewed August 12, 2026 · model on record in the stance chip above.
Discussion (0). Continue with ORCID to comment.