REVIEW 2 major objections 7 minor 29 references
NBMLSS: probabilistic forecasting of electricity prices via Neural Basis Models for Location Scale and Shape
T0 review · 2 major / 7 minor · reviewed 2026-08-12 · deepseek-v4-flash
Pith's one-line read The paper claims that NBMLSS, an interpretable neural basis model for distributional regression, matches or exceeds distributional neural networks in day-ahead electricity price forecasting while exposing how each input feature shapes the…
desk verdict A solid, well-executed empirical application of neural basis models to probabilistic price forecasting, but the interpretability payoff is weaker than the framing suggests and needs quantitative support. read the letter →
The pith
A machine-rendered reading of the paper's core claim, the machinery that carries it, and where it could break.
The reading
What carries the argument
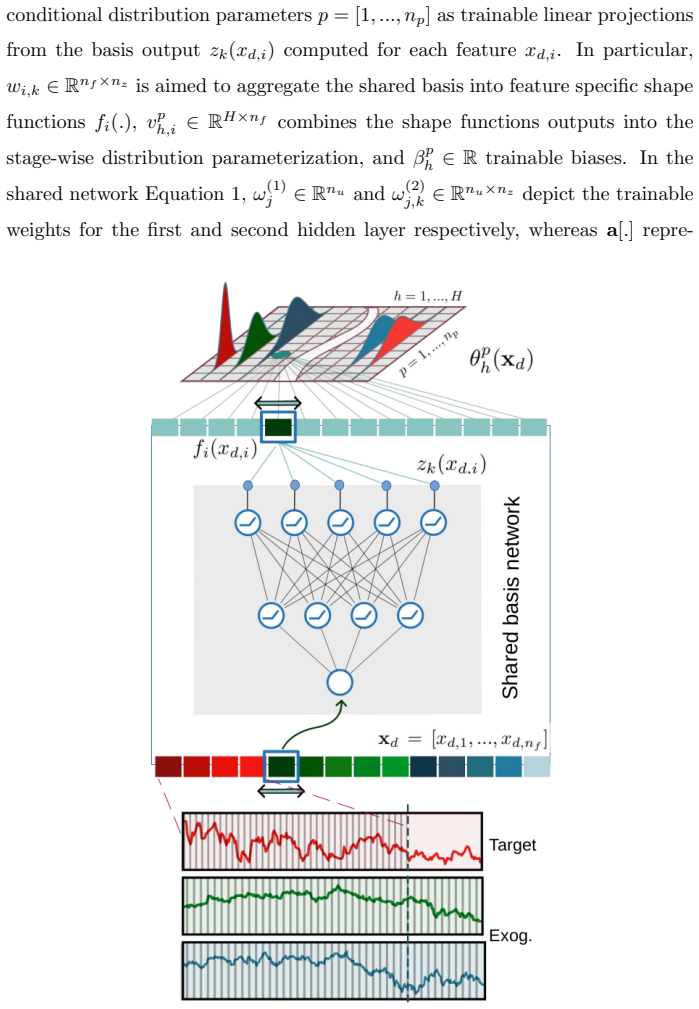
The load-bearing object is the shared basis decomposition. A single two-layer network computes $n_z$ basis functions $z_k(x_{d,i})$ from each feature value $x_{d,i}$; a learned matrix $w_{i,k}$ blends these bases into a per-feature shape function $f_i(x_{d,i})$, and a second projection $v^p_{h,i}$ with bias $\beta^p_h$ maps the shape functions into the $p$-th parameter of the predictive density at horizon $h$, passed through link functions such as Softplus for the scale and tailweight of the Johnson's SU density. Because the expensive nonlinear network is shared across all 147 features and only the linear projections are feature-specific, the GAMLSS-style additive interpretation becomes computationally practical for 24-hour multi-horizon forecasting.
What would settle it
Feed NBMLSS synthetic data generated from a known additive relationship between inputs and distribution parameters; if the recovered per-feature shape functions do not converge to the true generating functions as the training sample grows, the interpretability claim is falsified.
Extended reading notes
Core claim
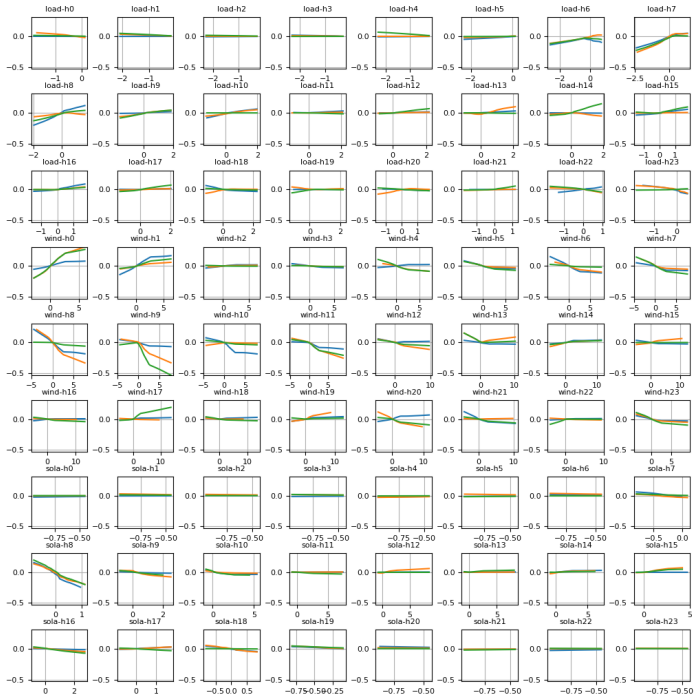
The central claim is that a Neural Basis Model for Location, Scale and Shape can reach the forecast quality of distributional neural networks while delivering per-feature, per-parameter, per-horizon shape functions that expose how inputs shape the predicted price distribution. The paper demonstrates this on Germany, Spain, Belgium, and Sweden, using the Johnson's SU parameterization and consistent training settings; in several cases NBMLSS improves on the DDNN's CRPS, particularly with Reversible Instance Normalization. The learned shape functions reveal economically sensible relations, such as load pushing the location parameter up at peak hours and renewable generation shrinking location while inversely affecting skewness. The authors also report that the shape functions are not unique: different random initializations produce functionally different but predictively equivalent maps, which they trace to approximate concurvity and underspecification.
Load-bearing premise
The load-bearing assumption is that the learned per-feature shape functions accurately represent the true conditional relationships between inputs and distribution parameters; the paper itself shows these maps vary strongly across random initializations, so if this assumption fails the interpretability benefit weakens even though forecast accuracy may still hold.
Editorial extensions
If this is right
- Forecasters can choose NBMLSS over DDNN without expecting a systematic loss of CRPS, gaining per-feature shape functions for location, scale, tailweight, and skewness across the 24-hour horizon.
- Reversible Instance Normalization should be considered a standard component for both NBMLSS and DDNN, since it lowers CRPS and MAE on average across the four markets and both test periods.
- The Johnson's SU parameterization beats the Normal form in most volatile test conditions, so flexible distributional forms remain valuable even inside an additive architecture.
- The shape functions provide concrete diagnostic information, such as load having a steeper positive effect on location in peak hours and renewable generation showing a shrinking influence on location with an inverse relation to skewness.
- Ensembles of NBMLSS components, or hybrids combining NBMLSS with DDNN, present a practical route to combine interpretability with robustness, since individual shape functions are seed-dependent.
Reading between the lines
- A reader could infer that single-run shape functions should not be treated as causal estimates; a more reliable protocol is to report distributions of shape functions over ensemble members, or to apply concurvity regularization before interpretation.
- The architecture is not price-specific, so the same shared-basis design could carry to other multi-horizon distributional forecasting problems, such as load or renewable generation, where GAMLSS-style interpretability is wanted.
- The scalability claim invites a direct benchmark: comparing NBMLSS against a per-feature NAMLSS under identical data would quantify the speed-up that motivates the shared basis.
- The masked-exogenous experiments suggest the full model uses cross-hour information beyond same-hour renewables and load; a targeted ablation could identify which of those cross-hour features actually carry predictive value and shrink the conditioning set.
Editorial analysis
A structured set of objections, weighed in public.
Referee Report
Summary. The paper proposes NBMLSS, a neural basis model for distributional regression in day-ahead electricity price forecasting. It combines a shared basis-function network with linear projections to produce feature-specific shape functions that map inputs to the parameters of a parametric distribution (e.g., Johnson's SU). The model is evaluated against distributional neural networks on four European markets (BE, DE, ES, SE) over two out-of-sample test periods (TS23, TS24), with weekly recalibration, ensemble aggregation, and statistical tests. The authors report comparable or better CRPS for NBMLSS in several settings, and they inspect the learned shape functions as an interpretability analysis.
Significance. Strengths of the paper: a sound out-of-sample forecasting pipeline (multiple markets, two test periods, train/validation split, weekly recalibration, 5-member ensembles, Kupiec and Diebold-Mariano tests), honest reporting of limitations, and the use of open datasets. The accuracy-side claim is credible: Tables 1-8 support comparable or better CRPS for NBMLSS relative to DDNN in several configurations. The interpretability-side claim, which is the paper's main novelty, is not yet established quantitatively: the authors themselves show that shape functions vary strongly across random initializations (Figures 2, 3, 7) and attribute this to concurvity and underspecification. The forecasting contribution alone would be incremental; the interpretability contribution is potentially valuable but requires additional evidence to be convincing.
major comments (2)
- [§3, Figures 2-4 and 7] The central claim of "more insights" is not supported by the presented evidence. The paper shows that shape functions differ substantially across random recalibrations while the corresponding predictive distributions are nearly identical (Figure 4). The authors explicitly attribute this behavior to approximate concurvity and underspecification, citing refs [25]-[27]. This is a non-identifiability problem: many combinations of shape functions yield equivalent forecasts, so the extracted maps do not uniquely describe the learned relationships. Without a quantitative stability metric, a synthetic-data identifiability check, or a regularizer that enforces unique shape functions, the interpretability claim remains an aspiration. This issue is load-bearing because interpretability is the paper's primary contribution.
- [§3, Figures 5-7 and Table 9] The interpretability analysis is qualitative and restricted to one market (DE) and two distribution parameters (location and skewness). The masked-feature experiments were intended to mitigate the non-identifiability problem, but the paper reports that "sensible heterogeneity" remains in the shape functions (Figure 7). The paper does not demonstrate that the shape functions correspond to true conditional relationships (e.g., on simulated data with known ground truth) or provide any quantitative measure of agreement across runs. To support the claim, the authors should either: (i) report a seed-variability metric (e.g., variance or range of shape functions relative to their magnitude) for all features and parameters, (ii) validate shape-function recovery on synthetic data with known additive structure, or (iii) apply a concurvity regularizer and show that stable functions are obtained while maintaining CRPS.
minor comments (7)
- [Section 2] The sentence describing the training loss contains a duplicated article: "using the the negative log-likelihood".
- [Reference [8]] The author list appears to include "F. Nov"; this is likely a typo for "F. Ziel" (Ziel is the usual co-author of the cited distributional neural network paper). Please verify.
- [Reference [23]] The title "Conformai pid control" should be "Conformal PID control".
- [Table A.11] For J-DNN ES under TS24, the number of units is listed as "762", which is likely a typo for "768".
- [Section 4] The phrase "share basis" in the conclusions should be "shared basis".
- [Section 3] In the interpretability discussion, "renawable" should be "renewable".
- [Figure 4] The caption of Figure 4 should specify more precisely what is plotted (e.g., deciles vs. percentiles) for clarity.
Circularity Check
No circularity: the central claim is an out-of-sample empirical comparison, and the self-citations are background only.
full rationale
The paper's central claim—'NBMLSS has achieved CRPS results that are comparable to, and in some cases better than, those of the DDNN under consistent settings'—is supported by out-of-sample CRPS, PICP, MAE, and Diebold-Mariano test results on held-out TS23 and TS24 periods, not by any equation that defines those scores in terms of the model's fitted parameters. Equations (1)-(3) define the NBMLSS architecture; they are not used to derive the forecast accuracy, which is measured on test data via pinball-loss CRPS. No fitted constant is renamed as a prediction: the distribution parameters are trained by negative log-likelihood and the reported scores come from independent out-of-sample evaluation. The self-citations ([5], [19]) appear as background and as references for DDNN configuration choices, but the DDNN baseline itself is the external model of [8] and the benchmark dataset is external ([15]); those self-citations are not load-bearing. The interpretability claim is qualitative and explicitly qualified: the paper reports heterogeneous shape functions across recalibrations and attributes this to approximate concurvity and underspecification, citing external works [25]-[27]. That weakens the strength of the 'more insights' claim, but it is a limitation of the evidence, not a circular derivation. No instance of self-definition, fitted-input-called-prediction, self-citation-chain logic, or imported uniqueness was found.
Assumptions & free parameters
free parameters (6)
- nz (number of shared basis functions) =
tuned per market, search range [32, 64, 128, 256]
- nu (width of shared network) =
tuned per market, search range [32, 64, 128, 256]
- dropout rate =
tuned per market, search set {0, 0.1, 0.3, 0.5}
- learning rate =
tuned per market, search set {1e-3, 5e-4, 1e-4, 5e-5}
- epsilon correction factor =
1e-3
- gamma correction factor =
3
assumptions (5)
- domain assumption The response distribution belongs to a parametric family (JSU or Normal) parameterized by location, scale, and shape.
- domain assumption The additive decomposition, where each feature contributes independently to each distribution parameter, can capture the relevant mechanisms.
- domain assumption Training samples from moving windows are treated as i.i.d. for NLL minimization.
- domain assumption The Johnson's SU density is flexible enough for electricity price distributions.
- domain assumption RevIN preserves the distributional shape after inverse transformation.
Cite this review
Pith. "Pith review of NBMLSS: probabilistic forecasting of electricity prices via Neural Basis Models for Location Scale and Shape." pith.science (2026). https://pith.science/paper/U5WYN6QX
@misc{pith2026241113921,
  author       = {Pith},
  title        = {Pith review of: NBMLSS: probabilistic forecasting of electricity prices via Neural Basis Models for Location Scale and Shape},
  year         = {2026},
  howpublished = {\url{https://pith.science/paper/U5WYN6QX}},
  note         = {Machine review of arXiv:2411.13921}
}
read the original abstract
Forecasters using flexible neural networks (NN) in multi-horizon distributional regression setups often struggle to gain detailed insights into the underlying mechanisms that lead to the predicted feature-conditioned distribution parameters. In this work, we deploy a Neural Basis Model for Location, Scale and Shape, that blends the principled interpretability of GAMLSS with a computationally scalable shared basis decomposition, combined by linear projections supporting dedicated stepwise and parameter-wise feature shape functions aggregations. Experiments have been conducted on multiple market regions, achieving probabilistic forecasting performance comparable to that of distributional neural networks, while providing more insights into the model behavior through the learned nonlinear feature level maps to the distribution parameters across the prediction steps.
Figures

Figures from the paper (4 more)


Reference graph
Works this paper leans on
-
[25]
J. Siems, K. Ditschuneit, W. Ripken, A. Lindborg, M. Schambach, J. S. Otterbach, M. Genzel, Curve your enthusiasm: concurvity regularization in differentiable generalized additive models, in: Proceedings of the 37th International Conference on Neural Information Processing Systems, NIPS ’23, Curran Associates Inc., Red Hook, NY, USA, 2024
work page 2024
-
[27]
A. D’Amour, K. Heller, D. Moldovan, B. Adlam, B. Alipanahi, A. Beu- tel, C. Chen, J. Deaton, J. Eisenstein, M. D. Hoffman, F. Hormozdiari, N. Houlsby, S. Hou, G. Jerfel, A. Karthikesalingam, M. Lucic, Y. Ma, 26 C. McLean, D. Mincu, A. Mitani, A. Montanari, Z. Nado, V. Natara- jan, C. Nielson, T. F. Osborne, R. Raman, K. Ramasamy, R. Sayres, J. Schrouff, M...
work page 2022
-
[1]
A. Mashlakov, T. Kuronen, L. Lensu, A. Kaarna, S. Honkapuro, Assessing the performance of deep learning models for multivariate probabilistic energy forecasting, Applied Energy 285 (2021) 116405. doi:https://doi.org/10.1016/j.apenergy.2020.116405. URL https://www.sciencedirect.com/science/article/pii/ S0306261920317748
-
[2]
A. Wagner, E. Ramentol, F. Schirra, H. Michaeli, Short- and long-term forecasting of electricity prices using embedding of calendar infor- mation in neural networks, Journal of Commodity Markets (2022) 100246doi:https://doi.org/10.1016/j.jcomm.2022.100246. URL https://www.sciencedirect.com/science/article/pii/ S2405851322000046
arXiv 2022
-
[3]
A. Ciarreta, B. Martinez, S. Nasirov, Forecasting electricity prices using bid data, International Journal of Forecasting (2022). doi:https://doi.org/10.1016/j.ijforecast.2022.05.011. 22 URL https://www.sciencedirect.com/science/article/pii/ S0169207022000711
-
[4]
S. Madadkhani, S. Ikonnikova, Toward high-resolution projection of electricity prices: A machine learning approach to quantifying the ef- fects of high fuel and co2 prices, Energy Economics 129 (2024) 107241. doi:https://doi.org/10.1016/j.eneco.2023.107241. URL https://www.sciencedirect.com/science/article/pii/ S0140988323007399
arXiv 2024
-
[5]
A. Brusaferri, M. Matteucci, P. Portolani, A. Vitali, Bayesian deep learning based method for probabilistic forecast of day- ahead electricity prices, Applied Energy 250 (2019) 1158–1175. doi:https://doi.org/10.1016/j.apenergy.2019.05.068. URL https://www.sciencedirect.com/science/article/pii/ S0306261919309237
-
[6]
J. Nowotarski, R. Weron, Recent advances in electricity price fore- casting: A review of probabilistic forecasting, Renewable and Sustainable Energy Reviews 81 (2018) 1548–1568. doi:https: //doi.org/10.1016/j.rser.2017.05.234. URL https://www.sciencedirect.com/science/article/pii/ S1364032117308808
Show all 29 references
-
[7]
J. Lago, G. Marcjasz, B. De Schutter, R. Weron, Forecasting day-ahead electricity prices: A review of state-of-the-art algorithms, best practices and an open-access benchmark, Applied Energy 293 (2021) 116983. doi:https://doi.org/10.1016/j.apenergy.2021.116983. URL https://www...
2021
-
[8]
Marcjasz, M
G. Marcjasz, M. Narajewski, R. Weron, F. Nov, Distributional neural networks for electricity price forecasting, Energy Economics 125 (2023) 106843. doi:https://doi.org/10.1016/j.eneco.2023.106843. 23 URL https://www.sciencedirect.com/science/article/pii/ S0140988323003419
2023
-
[9]
Tschora, E
L. Tschora, E. Pierre, M. Plantevit, C. Robardet, Electricity price fore- casting on the day-ahead market using machine learning, Applied Energy 313 (2022) 118752. doi:https://doi.org/10.1016/j.apenergy.2022. 118752. URL https://www.sciencedirect.com/science/article/pii/ S0306...
2022 doi
-
[10]
Rudin, Stop explaining black box machine learning models for high stakes decisions and use interpretable models instead, Nature Machine In- telligence 1 (2019) 206–215
C. Rudin, Stop explaining black box machine learning models for high stakes decisions and use interpretable models instead, Nature Machine In- telligence 1 (2019) 206–215. doi:10.1038/s42256-019-0048-x
2019 doi
-
[11]
Agarwal, L
R. Agarwal, L. Melnick, N. Frosst, X. Zhang, B. Lengerich, R. Caruana, G. E. Hinton, Neural additive models: interpretable machine learning with neural nets, in: Proceedings of the 35th International Conference on Neural Information Processing Systems, NIPS ’21, Curran Associa...
2024
-
[12]
Thielmann, R.-M
A. Thielmann, R.-M. Kruse, T. Kneib, B. S¨ afken, Neural additive models for location scale and shape: A framework for interpretable neural regres- sion beyond the mean, in: S. Dasgupta, S. Mandt, Y. Li (Eds.), Proceedings of The 27th International Conference on Artificial Int...
2024
-
[13]
Hirsch, J
S. Hirsch, J. Berrisch, F. Ziel, Online distributional regression (2024). arXiv:2407.08750. URL https://arxiv.org/abs/2407.08750
2024 arXiv
-
[14]
Radenovic, A
F. Radenovic, A. Dubey, D. Mahajan, Neural basis models for interpretabil- ity, in: Proceedings of the 36th International Conference on Neural Infor- 24 mation Processing Systems, NIPS ’22, Curran Associates Inc., Red Hook, NY, USA, 2024
2024
-
[15]
Aliyon, J
K. Aliyon, J. Ritvanen, Deep learning-based electricity price forecasting: Findings on price predictability and european electricity markets, Energy 308 (2024) 132877. doi:https://doi.org/10.1016/j.energy.2024. 132877. URL https://www.sciencedirect.com/science/article/pii/ S03...
2024 doi
-
[16]
Bouchiat, A
K. Bouchiat, A. Immer, H. Y` eche, G. R¨ atsch, V. Fortuin, Improving neural additive models with bayesian principles (2024). arXiv:2305.16905. URL https://arxiv.org/abs/2305.16905
2024 arXiv
-
[17]
T. Kim, J. Kim, Y. Tae, C. Park, J.-H. Choi, J. Choo, Reversible instance normalization for accurate time-series forecasting against distribution shift, in: International Conference on Learning Representations, 2021. URL https://openreview.net/forum?id=cGDAkQo1C0p
2021
-
[18]
Akiba, S
T. Akiba, S. Sano, T. Yanase, T. Ohta, M. Koyama, Optuna: A next- generation hyperparameter optimization framework (2019). arXiv:1907. 10902. URL https://arxiv.org/abs/1907.10902
2019 arXiv
-
[19]
Brusaferri, A
A. Brusaferri, A. Ballarino, L. Grossi, F. Laurini, On-line conformalized neural networks ensembles for probabilistic forecasting of day-ahead elec- tricity prices (2024). arXiv:2404.02722. URL https://arxiv.org/abs/2404.02722
2024 arXiv
-
[20]
J. V. Dillon, I. Langmore, D. Tran, E. Brevdo, S. Vasudevan, D. Moore, B. Patton, A. Alemi, M. Hoffman, R. A. Saurous, Tensorflow distributions (2017). arXiv:1711.10604. URL https://arxiv.org/abs/1711.10604 25
2017 arXiv
-
[21]
Lipiecki, B
A. Lipiecki, B. Uniejewski, R. Weron, Postprocessing of point predictions for probabilistic forecasting of day-ahead electricity prices: The benefits of using isotonic distributional regression, Energy Economics 139 (2024) 107934. doi:https://doi.org/10.1016/j.eneco.2024.10793...
2024
-
[22]
C. Guo, G. Pleiss, Y. Sun, K. Q. Weinberger, On calibration of modern neural networks, in: Proceedings of the 34th International Conference on Machine Learning - Volume 70, ICML’17, JMLR.org, 2017, p. 1321–1330
2017
-
[23]
A. N. Angelopoulos, E. J. Cand` es, R. J. Tibshirani, Conformai pid con- trol for time series prediction, in: Proceedings of the 37th International Conference on Neural Information Processing Systems, NIPS ’23, Curran Associates Inc., Red Hook, NY, USA, 2024
2024
-
[24]
K. C. Lichtendahl, Y. Grushka-Cockayne, R. L. Winkler, Is it bet- ter to average probabilities or quantiles?, Management Science 59 (7) (2013) 1594–1611. arXiv:https://doi.org/10.1287/mnsc.1120.1667, doi:10.1287/mnsc.1120.1667. URL https://doi.org/10.1287/mnsc.1120.1667
2013
-
[26]
Zhang, J
X. Zhang, J. Martinelli, S. John, Challenges in interpretability of additive models, IJCAI 2024 Workshop on Explainable Artificial Intelligence (2024)
2024
-
[28]
Zhong, Z
C. Zhong, Z. Chen, J. Liu, M. Seltzer, C. Rudin, Exploring and interacting with the set of good sparse generalized additive models, in: Proceedings of the 37th International Conference on Neural Information Processing Sys- tems, NIPS ’23, Curran Associates Inc., Red Hook, NY, ...
2024
-
[29]
Kov´ acs, Feature selection algorithms in generalized additive models under concurvity, Comput
L. Kov´ acs, Feature selection algorithms in generalized additive models under concurvity, Comput. Stat. 39 (2) (2022) 461–493. doi:10.1007/ s00180-022-01292-7 . URL https://doi.org/10.1007/s00180-022-01292-7 Appendix A. Appendix 27 Table A.10: Hyperparameters selected by the ...
2022 doi
Reviewed August 12, 2026 · model on record in the stance chip above.
Discussion (0). Continue with ORCID to comment.