REVIEW 3 major objections 5 minor 11 references
Wavelet Analysis of Cryptocurrencies -- Non-Linear Dynamics in High Frequency Domains
T0 review · 3 major / 5 minor · reviewed 2026-08-12 · deepseek-v4-flash
Pith's one-line read Applying a continuous wavelet transform to daily log returns, this paper reports red 'hot spots' and a line-like feature in XRP's power spectrum, which it interprets as cyclical persistence at specific investment horizons.
desk verdict A visually driven wavelet analysis whose central EMH claim about XRP rests on untested visual features; methodologically unsupported but with a kernel of an observation worth rigorous follow-up. read the letter →
The pith
A machine-rendered reading of the paper's core claim, the machinery that carries it, and where it could break.
The reading
What carries the argument
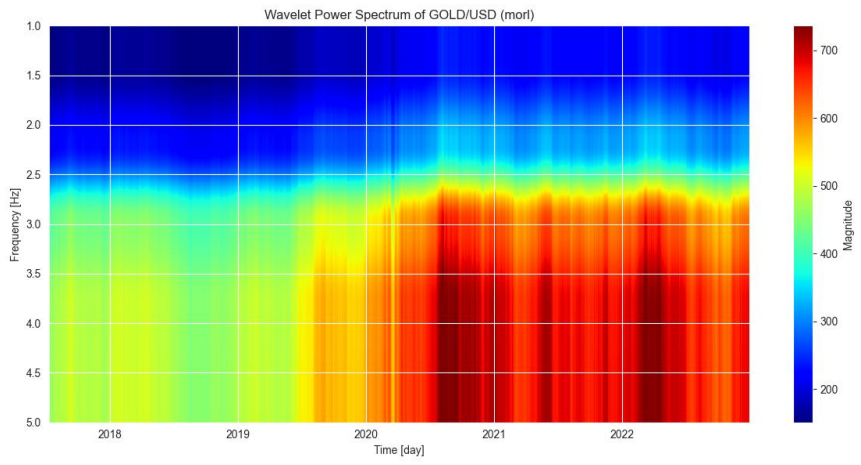
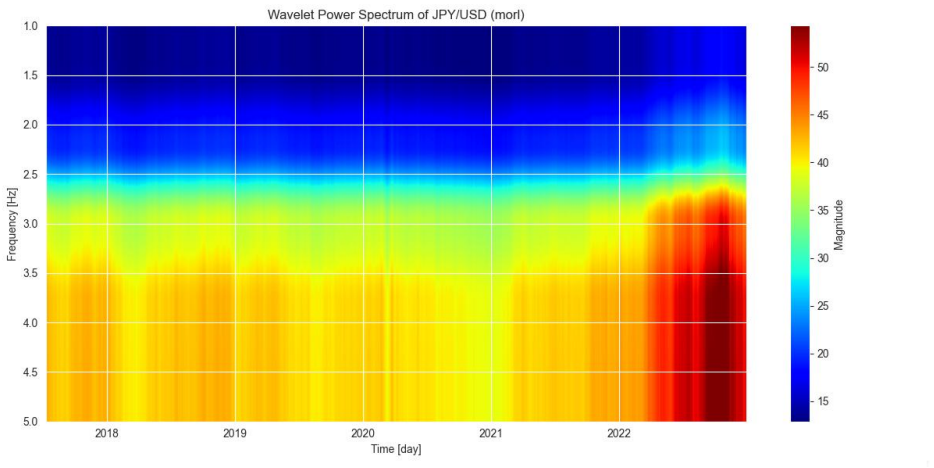
The key object is the continuous wavelet transform $W_f(\sigma,\tau)$, applied with the Morlet ('morl') and complex Morlet ('cmor1.5-1.0') mother wavelets. The transform maps the log-return series into a time-frequency plane, and the wavelet power spectra rendered as heat maps are the evidence carrier: red hot spots mark transient high-frequency bursts, while a line-like ridge marks a persistent frequency. The XRP line-like shape is the observable that carries the causal claim, and it is the only feature the Conclusion explicitly ties to cyclical persistence.
What would settle it
Take the XRP daily log-return series, generate a large ensemble of surrogate series with identical length and marginal distribution but no temporal structure (for example by random permutation or by phase randomization that preserves the periodogram), compute the same morl and cmor1.5-1.0 wavelet power spectra, and compare the frequency of line-like hot spots in the surrogates with the observed spectrum. If equivalently strong line-like features appear in a substantial fraction of surrogates, the claimed cyclical persistence is indistinguishable from noise; a second check is to recompute with a different mother wavelet (for example Paul or Daubechies) and mask the cone of influence to see whether the XRP line survives.
Extended reading notes
Core claim
On the paper's own terms, the central discovery is that daily log-return spectra are not featureless: low frequencies stay stable over time while high frequencies show bursty red hot spots, and XRP in particular exhibits sequential points 'almost like a line' in the low-to-middle frequency range—interpreted as a unique frequency or periodicity in XRP prices. The paper then draws the logical consequence that cyclical persistence at different frequencies means there exists some intrinsic causal relationship for the investment horizons defined by the sampling scales. Because such persistence would mean past price movements carry information about future price movements at those horizons, the author states that the wavelet analysis casts doubt on the weak form of the efficient market hypothesis.
Load-bearing premise
The paper's conclusion depends on the assumption that the red hot spots and the line-like shape in the wavelet power spectra are true cyclical persistence and not artifacts of the Morlet mother wavelet, boundary effects at the edges of the sample, or the ordinary spectrum of a noisy return process, since no significance contours, confidence intervals, surrogate data, or robustness checks are reported.
Editorial extensions
If this is right
- If the XRP line-like feature is a genuine cycle, daily XRP log returns contain a frequency component that repeats, so past returns carry information about future returns at that horizon.
- Weak-form market efficiency would fail at least for XRP daily data, since the price would not fully reflect all information contained in past prices.
- The high-frequency hot spots shared by all cryptocurrencies during the 2022 COVID peak indicate a common high-frequency shock, not just asset-specific noise.
- The stable low-frequency band across all series implies that long-horizon behavior is comparatively smooth, so the claimed violation is specific to particular investment horizons rather than to all frequencies.
Reading between the lines
- An implicit extension is to estimate the dominant period of the XRP line-like feature and test out-of-sample directional forecasts; a working forecast rule would upgrade the spectral observation into an exploitable anomaly.
- A wavelet-based Hurst exponent analysis could distinguish a deterministic cycle from long memory, two different mechanisms that would produce different predictability and risk implications.
- Because no significance contours are reported, surrogate testing is the natural check: phase-randomized versions of the XRP returns should not reproduce the line-like feature if the persistence is real.
- The COVID hot-spot pattern suggests a testable common-shock hypothesis: the same high-frequency band should activate across cryptocurrencies at the same dates, and removing that window should weaken the persistence claim.
Editorial analysis
A structured set of objections, weighed in public.
Referee Report
Summary. The paper applies continuous wavelet transforms (Morlet and complex Morlet) to daily log returns of BTC, ETH, XRP, S&P500, gold, JPY/USD, and USD/EUR from July 10, 2017 to December 31, 2022, with the stated aim of testing the weak form of the efficient market hypothesis by detecting cyclical persistence. The authors visually interpret red 'hot spots' and a 'line-like shape' in the wavelet power spectra (Figures 1-14) as evidence of cyclical persistence and 'some intrinsic causal relationship' for certain investment horizons, especially for XRP. No statistical tests, confidence contours, null models, surrogate data, or out-of-sample checks are presented; the conclusions rest entirely on visual inspection of the spectral plots.
Significance. If the central claim were established with rigorous inference, the finding of predictable cyclical components in cryptocurrency returns would be relevant to the market efficiency literature and to practitioners. However, the manuscript provides no quantitative evidence supporting its conclusions: the visual features are never tested against a null model, the mother wavelet choices are not justified or varied for robustness, and the leap from spectral patterns to 'causal relationship' is not conceptually defended. Given this, the potential significance is not realized, and the paper currently offers little beyond a set of uncalibrated wavelet plots.
major comments (3)
- [Section 3, Figures 1-14] The central evidence for the paper's claim is visual inspection of wavelet power spectra, but no inferential procedure is applied. There are no significance contours against a red-noise or other null background (e.g., the standard Torrence-Compo approach), no surrogate data ensembles, and no confidence intervals. Because the continuous wavelet transform is a redundant, locally autocorrelated representation, even a single realization of i.i.d. or weakly autocorrelated returns produces patches of high power and ridge-like features; the reported 'hot spots' and the XRP 'line-like shape' could plausibly be such null-process artifacts. Without a statistical test, the central conclusion in Section 4 that these features indicate 'cyclical persistence' and 'intrinsic causal relationship' is unsupported.
- [Section 4, Conclusion] The inference from a visible line in a wavelet spectrum to 'some intrinsic causal relationship' is a non sequitur. Periodicity or persistence in returns, even if statistically confirmed, would not by itself establish causality; it could reflect time-varying risk premia, market microstructure effects, or other equilibrium dynamics. Furthermore, the statement in Section 3 that 'hot spots corresponds to the peaks in the standard, one-dimensional time series analysis' is tautological: the wavelet power spectrum is by construction a measure of local variance, so high power regions correspond to periods of high amplitude by definition. The paper does not provide any predictive test, out-of-sample evaluation, or causal model to support the EMH-violation claim.
- [Section 3, Covid-19 reference] The text refers to 'the period of Covid-19 peek in 2022' (Section 3). The sample window covers 2017-2022, but the major COVID-19 market crash occurred in March 2020, not 2022. This factual misdating is symptomatic of the paper's pattern-reading approach: the visual identification of 'hot spots' is not anchored to verified calendar events, which further undermines confidence that the reported features correspond to real economic episodes rather than artifacts.
minor comments (5)
- [Section 2, Eq. (2)] The notation f ∈ H = L2(R) is slightly misleading; f is a function in L2(R) and the wavelet ψ is in L2(C). Clarify the domains and the admissibility condition on ψ.
- [Section 2, Eq. (5)] The wavelet coherence R2(σ,τ) is defined but never used in the analysis; either remove it or explain its intended role.
- [Throughout] There are several typographical errors: 'CryproCompare' should be 'CryptoCompare', 'peek' should be 'peak', 'the study examines the daily closing prices for three major cryptocurrencies (BTC, ETH and' is followed by an incomplete listing in the narrative before the parenthetical is closed, and 'It shows that if we focus' appears multiple times. A careful proofread is needed.
- [Abstract and Section 2] The abstract mentions 'analysis for the probability distributions in the space of frequency and time variables', but no probability distributions are estimated or analyzed in the paper; this claim should be removed or implemented.
- [Figures] The figures (presumably color maps) are not described with axes labels or colorbar scales in the text; without such details, the reader cannot judge the magnitude of the reported 'hot spots' or the range of scales shown.
Circularity Check
No circularity: the paper's wavelet spectra are visually interpreted rather than derived from fitted parameters, so no claim reduces to its own inputs.
full rationale
The paper contains no derivation chain in which an output is constructed from an input. Eq. (2) defines the continuous wavelet transform as a standard integral operator applied to log returns x(t)=log(p_t/p_{t-1}); Eq. (5) defines wavelet coherence. No parameter is fitted to a subset of the data and then relabeled as a prediction, and no uniqueness theorem is invoked. The central inference—that red hot spots and an XRP 'line-like shape' in the wavelet power spectra indicate 'cyclical persistence' and an 'intrinsic causal relationship'—is an empirical judgment, not a mathematical consequence. Even if that inference is unsupported (there are no significance contours, surrogate-data tests, or robustness checks against the choice of morl versus cmor1.5-1.0, and the 'Covid-19 peek in 2022' date is inaccurate), unsupportedness is not circularity. The only self-citation, to Kikuchi, Onishi and Ueda (2021), is an introductory remark about previous evidence of price stability and is not load-bearing for the current wavelet conclusion. Thus no circular step can be exhibited, and the appropriate score is 0.
Assumptions & free parameters
free parameters (2)
- Complex Morlet wavelet parameters delta and omega =
delta=1.5, omega=1.0 (cmor1.5-1.0)
- Morlet central frequency omega =
omega=6
assumptions (3)
- standard math The continuous wavelet transform with the Morlet and complex Morlet mother wavelets is an appropriate decomposition for daily log returns.
- domain assumption Daily closing prices over 2017-2022 adequately capture the 'high frequency' dynamics and cyclical persistence discussed in the paper.
- ad hoc to paper Red 'hot spots' in wavelet power spectra can be read as evidence of cyclical persistence and intrinsic causal relationships without statistical significance testing against a null model.
Cite this review
Pith. "Pith review of Wavelet Analysis of Cryptocurrencies -- Non-Linear Dynamics in High Frequency Domains." pith.science (2026). https://pith.science/paper/XBMKJWCT
@misc{pith2026241114058,
  author       = {Pith},
  title        = {Pith review of: Wavelet Analysis of Cryptocurrencies -- Non-Linear Dynamics in High Frequency Domains},
  year         = {2026},
  howpublished = {\url{https://pith.science/paper/XBMKJWCT}},
  note         = {Machine review of arXiv:2411.14058}
}
read the original abstract
In this study, we perform some analysis for the probability distributions in the space of frequency and time variables. However, in the domain of high frequencies, it behaves in such a way as the highly non-linear dynamics. The wavelet analysis is a powerful tool to perform such analysis in order to search for the characteristics of frequency variations over time for the prices of major cryptocurrencies. In fact, the wavelet analysis is found to be quite useful as it examine the validity of the efficient market hypothesis in the weak form, especially for the presence of the cyclical persistence at different frequencies. If we could find some cyclical persistence at different frequencies, that means that there exist some intrinsic causal relationship for some given investment horizons defined by some chosen sampling scales. This is one of the characteristic results of the wavelet analysis in the time-frequency domains.
Figures


Figures from the paper (11 more)



Reference graph
Works this paper leans on
-
[1]
Tatsuru Kikuchi, Toranosuke Onishi, Kenichi Ueda, 'Price Stability of Cryptocurrencies as a Medium of Exchange', JPS Conf. Proc. 36, 011001 (2021)
work page 2021
-
[2]
Wolfgang Fruehwirt, Leonhard Hochfilzer, Leonard Weydemann, Stephen Roberts, 'Cumulation, crash, coherency: A cryptocurrency bubble wavelet analysis', Finance Research Letters, 40 (2021)
work page 2021
-
[3]
Rong Li, Sufang Li, Di Yuan, Huiming Zhu, 'Investor attention and cryptocurrency: Evidence from wavelet-based quantile Granger causality analysis', Research in International Business and Finance, 56 (2021)
work page 2021
-
[4]
Sumesh Eratt Parameswaran, Vidhyalavanya Ramachandran, Swati Shukla, 'Crypto Trend Prediction Based on Wavelet Transform and Deep Learning Algorithm', Procedia Computer Science, 235 (2024)
work page 2024
-
[5]
M. Belén Arouxet, Aurelio F. Bariviera, Verónica E. Pastor, Victoria Vampa, 'Covid-19 impact on cryptocurrencies: Evidence from a wavelet-based Hurst exponent', Physica A: Statistical Mechanics and its Applications, 596 (2022)
work page 2022
-
[6]
John W. Goodell, Stephane Goutte, 'Co-movement of COVID-19 and Bitcoin: Evidence from wavelet coherence analysis', Finance Research Letters, 38 (2021)
work page 2021
-
[7]
Luís Aguiar-Conraria, Nuno Azevedo, Maria Joana Soares, 'Using wavelets to decompose the time–frequency effects of monetary policy', Physica A: Statistical Mechanics and its Applications, 387, 12 (2008)
work page 2008
-
[8]
Elie Bouri, Syed Jawad Hussain Shahzad, David Roubaud, Ladislav Kristoufek, Brian Lucey, 'Bitcoin, gold, and commodities as safe havens for stocks: New insight through wavelet analysis', The Quarterly Review of Economics and Finance, 77 (2020)
work page 2020
Show all 11 references
-
[9]
Reboredo, Miguel A
Juan C. Reboredo, Miguel A. Rivera-Castro, 'A wavelet decomposition approach to crude oil price and exchange rate dependence', Economic Modelling, 32 (2013)
2013
-
[10]
Nunes, 'International comovement of stock market returns: A wavelet analysis', Journal of Empirical Finance, 16 (2009)
António Rua, Luís C. Nunes, 'International comovement of stock market returns: A wavelet analysis', Journal of Empirical Finance, 16 (2009)
2009
-
[11]
Ramazan Gençay, Faruk Selçuk, Brandon Whitcher, 'Differentiating intraday seasonalities through wavelet multi-scaling', Physica A: Statistical Mechanics and its Applications, 289 (2001)
2001
Reviewed August 12, 2026 · model on record in the stance chip above.
Discussion (0). Continue with ORCID to comment.