REVIEW 4 major objections 5 minor 52 references
Comparing the 3D morphology of solid-oxide fuel cell anodes for different manufacturing processes, annealing times, and operating temperatures
T0 review · 4 major / 5 minor · reviewed 2026-08-12 · deepseek-v4-flash
Pith's one-line read Heat and aging shrink the reactive zones inside solid-oxide fuel cell anodes.
desk verdict A useful single-sample descriptive study of Ni/GDC anode morphology whose causal claims outrun the experimental design, but whose authors are largely upfront about the limits. read the letter →
The pith
A machine-rendered reading of the paper's core claim, the machinery that carries it, and where it could break.
The reading
What carries the argument
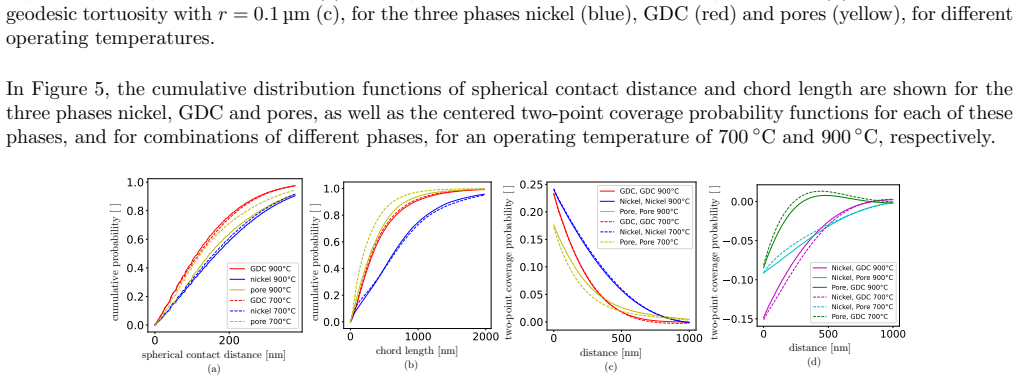
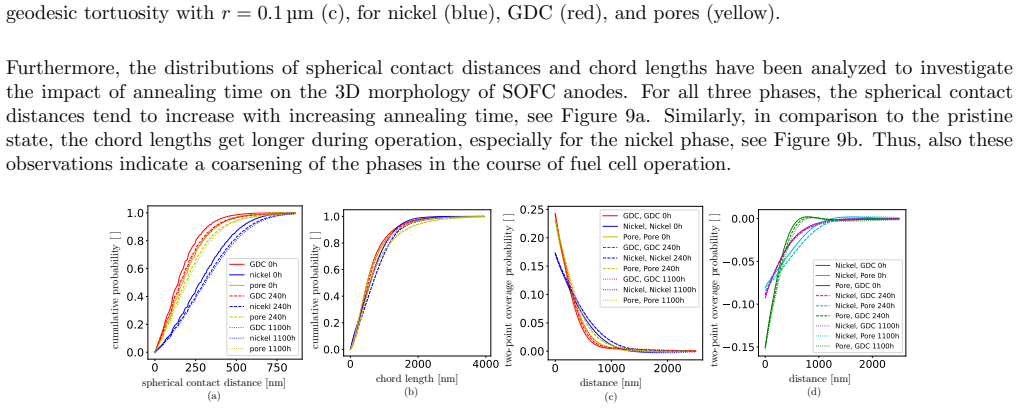
The load-bearing object is the segmented three-phase microstructure (nickel, gadolinium-doped ceria, pore space) obtained from FIB-SEM and watershed segmentation, together with a battery of geometric descriptors computed globally and on 2.5 µm subvolumes. The central quantity is the specific triple-phase boundary length, the expected length per unit volume of the line where all three phases meet; it is estimated by counting 2×2×2 voxel configurations that contain all three phases and neighboring pairs of such configurations. Supporting this are locally weighted 2×2×2 voxel estimates of specific surface area, geodesic tortuosity computed by shortest paths through each transport phase, constrictivity derived from pore-size and mercury-intrusion style functions, and two-point coverage, chord-length, and contact-distance distributions. The comparison logic is pairwise: samples differ in one factor at a time, so descriptor differences are attributed to that factor.
What would settle it
Image two or three additional FIB-SEM volumes from different locations of the same anode, or from identically prepared replicate cells, and compare within-condition scatter of the specific TPB length to the between-condition differences reported here; if within-condition scatter is comparable to the temperature, annealing, or process differences, those attributions collapse. Alternatively, make a powder anode and an infiltration anode with the same Ni:GDC phase fractions and re-measure; if the TPB gap disappears, the process effect is composition-driven.
Extended reading notes
Core claim
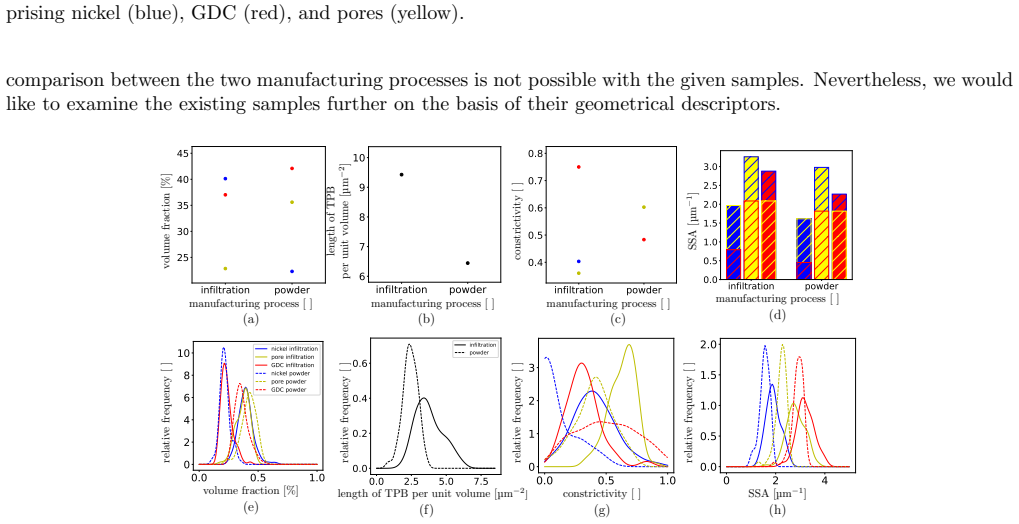
On its own terms, the paper claims that all three influencing factors—operating temperature, annealing time, and manufacturing process—measurably alter the 3D morphology of Ni/GDC SOFC anodes, and that the changes point consistently toward a loss of electrochemically active interface under thermal load. For infiltrated anodes, increasing the operating temperature from 700 °C to 900 °C leaves volume fractions and bottleneck strength nearly unchanged but coarsens the pore space, lowers the specific surface areas of pore and GDC phases, and reduces the specific TPB length per unit volume, which the authors read as worse electrochemical performance. For powder-processed anodes, annealing from the pristine state through 240 h to 1100 h at 900 °C also leaves volume fractions roughly constant while all phases coarsen and the specific TPB length drops markedly, with the nickel phase so poorly connected that its constrictivity is zero. Comparing pristine powder and infiltration anodes, the infiltration anode shows a higher nickel fraction, a substantially larger specific TPB length, positive nickel constrictivity, and finer GDC and pore structures; the paper is careful to note that the two processes also used different material compositions, so the process comparison is not fully isolated.
Load-bearing premise
The load-bearing premise is that a single FIB-SEM volume per condition stands in for the whole anode, so the measured differences between samples are caused by the named factor and not by where the volume was cut, by sample-to-sample variability, or by the different material compositions used for powder and infiltration anodes.
Editorial extensions
If this is right
- At 900 °C instead of 700 °C, infiltrated Ni/GDC anodes develop a coarser pore space and a shorter specific TPB length, so the same anode chemistry has fewer active reaction sites.
- With longer annealing time at 900 °C, powder-processed anodes coarsen in all phases and their specific TPB length drops significantly, meaning degradation of active sites continues during operation.
- Infiltration produces a finer anode structure with substantially more TPB per unit volume and a connected nickel phase, whereas powder processing yields a poorly connected nickel network with zero constrictivity.
- Because local descriptors on 2.5 µm cutouts reproduce the global trends, the coarsening and TPB loss are not confined to one region of the imaged volume.
- The measured microstructural changes provide direct input for stochastic models and transport simulations that can predict effective properties without fabricating every annealing condition.
Reading between the lines
- The paper's temperature comparison pairs a 900 °C sample annealed 640 h with a 700 °C sample annealed 1000 h; if the 900 °C cell truly plateaued after 310 h, then the comparison is fair, but a direct test with matched annealing times at both temperatures would remove the residual doubt.
- The infiltration-versus-powder difference is entangled with different nickel and GDC fractions, so the 'finer and more reactive' conclusion is a process-plus-composition effect; normalizing TPB by phase fractions or manufacturing both routes with identical compositions would isolate the process contribution.
- One practical extension the paper points toward is using the descriptor set as a degradation metric: if TPB length per unit volume correlates with measured polarization resistance, then FIB-SEM of ex-service anodes could rank remaining performance.
- A testable modeling extension is to generate stochastic microstructures at intermediate annealing times by interpolating calibrated model parameters and checking whether predicted TPB and tortuosity match the measured trend before using them in transport simulations.
Editorial analysis
A structured set of objections, weighed in public.
Referee Report
Summary. The paper presents a FIB-SEM based morphological characterization of seven Ni/GDC SOFC anodes (samples A–G) prepared by powder and infiltration routes. Global and local geometrical descriptors—volume fraction, specific surface area, triple-phase boundary length, geodesic tortuosity, constrictivity, two-point coverage, chord length, and spherical contact distance—are computed for comparisons across operating temperature (700 vs 900 °C), annealing time (0, 240, 1100 h), and manufacturing process. The central claim is that all three factors affect the anode morphology: higher operating temperature and longer annealing coarsen the structure and reduce TPB density, while infiltration yields a finer structure than powder processing. The paper is primarily an empirical case study using established image-analysis methods.
Significance. The paper's strength is its systematic application of established stereological and image-analysis descriptors to an industrially relevant SOFC anode material, with transparent reporting of imaging parameters and segmentation choices. The local-descriptor cutout analysis is a useful exploratory tool for heterogeneity, and the dataset could serve as a reference for future stochastic microstructure modeling. However, the experimental design—one FIB-SEM volume per condition, with no replicates and no uncertainty quantification—limits the causal strength of the conclusions. The manuscript would be valuable as a descriptive morphological comparison, but the current abstract and conclusion overstate the inferential power of the data.
major comments (4)
- [Section 4.1, Table 1 (samples F and D)] The temperature comparison is confounded with annealing time: sample F was annealed for 1000 h at 700 °C, while sample D was annealed for 640 h at 900 °C. The authors argue that the comparison is reasonable because the polarization resistance at 900 °C plateaued after 310 h, but this is an electrochemical proxy, not a microstructural measurement, and it cannot rule out continued slow coarsening between 640 h and the 1000 h time point. With only one volume per condition, the descriptor differences in SSA, TPB length, and tortuosity cannot be uniquely attributed to operating temperature. The conclusion in Section 5 that 'the higher operating temperature of 900 °C leads to a coarsening of the pore space' is stronger than this design supports.
- [Section 4.2, Table 1 (samples A, B, C)] The annealing-time series compares three different cells, not repeated imaging of the same cell or the same volume at successive times. The monotonic trends in TPB length and SSA are therefore point estimates from single volumes, and the claim that the specific length of TPB 'significantly decreases' with increasing annealing time is not supported by any measure of uncertainty. Sample-to-sample variability in the initial microstructure, which is known to be substantial in SOFC electrodes, could produce comparable differences. Please temper the causal language and explicitly acknowledge that these are between-cell, single-volume observations.
- [Section 4.3, Figure 11 and Section 5] The process comparison between samples E (infiltration) and G (powder) is confounded by material composition: the authors state that the volume fractions differ because different material compositions were used, and they even write that 'a direct comparison between the two manufacturing processes is not possible with the given samples.' Despite this, the paragraph interprets the TPB and SSA differences as showing that 'the infiltration technology results in a finer GDC structure' and the conclusion states that 'infiltration leads to a finer anode structure.' These causal statements should be removed or replaced with descriptive statements about the observed microstructures, since process and composition cannot be separated in this dataset.
- [Section 4, global descriptors and local cutout distributions] All global descriptor values are reported as single numbers without confidence intervals or segmentation-uncertainty bounds. The local descriptor distributions are computed from non-overlapping 2.5 µm cutouts within a single FIB-SEM volume; these cutouts are spatially correlated pseudo-replicates, not independent measurements, so differences in their probability densities cannot be used as statistical evidence. A paragraph on limitations, including the absence of replicate volumes and the assumptions of stationarity and isotropy, is needed before the conclusion.
minor comments (5)
- [Introduction vs. Table 1] The introduction states that 'we consider eight GDC-based SOFC anodes,' but Table 1 lists seven samples (A–G) and the conclusion also says 'seven SOFC anodes.' Please reconcile the count.
- [Section 4.2] The text says 'the proportion of perculating phase remains below 5 %' — 'perculating' should be 'percolating.'
- [Figure 9a] The legend contains a typo: 'nicekl 240h' should be 'nickel 240h.'
- [Section 3, Chord length distribution] The sentence 'Due to the isotropy of Ξ, the chord length distribution does not depend on the specific choice of the direction of the intersecting line ℓ' is missing a period at the end of the preceding sentence about choosing a line through the origin.
- [Section 4.3] The caveat that differences may be caused by different material compositions appears only after the descriptor results and is then repeated in the conclusion; it should be stated more prominently at the start of the process comparison to avoid misleading the reader.
Circularity Check
No significant circularity: the morphological descriptors are direct measurements on segmented FIB-SEM volumes, and the paper's conclusions do not reduce to any fitted parameter or self-referential derivation.
full rationale
The paper's central claims are based on computing geometrical descriptors (volume fraction, specific surface area, TPB length, geodesic tortuosity, constrictivity, two-point coverage, chord length, spherical contact distance) directly from segmented 3D image data. No descriptor is fitted to a subset of data and then presented as a prediction of the same data; no equation defines an input in terms of the output it is used to explain. Self-citations appear only as methodological references for descriptor definitions and estimation techniques (e.g., geodesic tortuosity in [41], constrictivity/SMIP in [46], Fourier-based estimation in [48]). These are standard image-analysis tools with independent, externally testable content, and they do not force the paper's qualitative conclusions about temperature, annealing time, or manufacturing process. The comparison in Section 4.1 is justified by an electrochemical plateau argument rather than by circular reliance on microstructure; Section 4.3 explicitly acknowledges that the infiltration-versus-powder comparison is confounded by different material compositions, and the conclusion hedges accordingly. The remaining concern, that each condition is represented by a single FIB-SEM volume, is an uncertainty/sampling limitation, not a circularity. Accordingly, no load-bearing circular step can be exhibited, and the appropriate score is 0.
Assumptions & free parameters
free parameters (5)
- Denoising weight =
50
- Gradient marker threshold =
upper 20% quantile
- Crack filter quantile =
2% (20 nm voxels), 5% (50 nm voxels)
- Dilation radius for dilated tortuosity =
0.1 µm
- Local cutout side length =
2.5 µm
assumptions (5)
- domain assumption The three-phase microstructure is modeled as motion-invariant (stationary and isotropic) random closed sets.
- domain assumption The watershed segmentation based on grayvalue histogram markers correctly separates nickel, GDC, and pore phases.
- domain assumption Each single FIB-SEM volume is representative of the corresponding anode condition.
- domain assumption A voxel size of 50 nm is sufficient to resolve the relevant microstructure of powder-processed anodes.
- domain assumption Samples F and D are comparable for the temperature study despite different annealing times, because the 900 °C cell reached a polarization-resistance plateau after 310 h.
Cite this review
Pith. "Pith review of Comparing the 3D morphology of solid-oxide fuel cell anodes for different manufacturing processes, annealing times, and operating temperatures." pith.science (2026). https://pith.science/paper/EBOPP6ZT
@misc{pith2026241115259,
  author       = {Pith},
  title        = {Pith review of: Comparing the 3D morphology of solid-oxide fuel cell anodes for different manufacturing processes, annealing times, and operating temperatures},
  year         = {2026},
  howpublished = {\url{https://pith.science/paper/EBOPP6ZT}},
  note         = {Machine review of arXiv:2411.15259}
}
read the original abstract
Solid oxide fuel cells (SOFCs) are becoming increasingly important due to their high electrical efficiency, the flexible choice of fuels and relatively low emissions of pollutants. However, the increasingly growing demands for electrochemical devices require further performance improvements. Since it is well known that the 3D morphology of the electrodes, which is significantly influenced by the underlying manufacturing process, has a profound impact on the resulting performance, a deeper understanding for the structural changes caused by modifications of the manufacturing process or degradation phenomena is desirable. In the present paper, we investigate the influence of the annealing time and the operating temperature on the 3D morphology of SOFC anodes using 3D image data obtained by focused-ion beam scanning electron microscopy, which is segmented into gadolinium-doped ceria, nickel and pore space. In addition, structural differences caused by manufacturing the anode via infiltration or powder technology, respectively, are analyzed quantitatively by means of various geometrical descriptors such as specific surface area, length of triple phase boundary per unit volume, mean geodesic tortuosity, and constrictivity. The computation of these descriptors from 3D image data is carried out both globally as well as locally to quantify the heterogeneity of the anode structure.
Figures


Figures from the paper (11 more)







Reference graph
Works this paper leans on
-
[1]
Weber, Fuel flexibility of solid oxide fuel cells, Fuel Cells 21 (5) (2021) 440–452
A. Weber, Fuel flexibility of solid oxide fuel cells, Fuel Cells 21 (5) (2021) 440–452
work page 2021
-
[2]
K. Kendall, M. Kendall, High-Temperature Solid Oxide Fuel Cells for the 21st Century: Fundamentals, Design and Applications, Academic Press, 2015
work page 2015
- [3]
-
[4]
N. Brandon, E. Ruiz-Trejo, P. Boldrin, Solid Oxide Fuel Cell Lifetime and Reliability: Critical Challenges in Fuel Cells, Academic Press, 2017
work page 2017
- [5]
-
[6]
S. Zarabi Golkhatmi, M. I. Asghar, P. D. Lund, A review on solid oxide fuel cell durability: Latest progress, mechanisms, and study tools, Renewable and Sustainable Energy Reviews 161 (2022) 112339
work page 2022
- [7]
-
[8]
W. C. Chueh, Y. Hao, W. Jung, S. M. Haile, High electrochemical activity of the oxide phase in model ceria–Pt and ceria–Ni composite anodes, Nature Materials 11 (2) (2012) 155–161
work page 2012
Show all 52 references
-
[9]
Nenning, C
A. Nenning, C. Bischof, J. Fleig, M. Bram, A. K. Opitz, The relation of microstructure, materials properties and impedance of SOFC electrodes: A case study of Ni/GDC anodes, Energies 13 (4) (2020)
2020
-
[10]
Hussain, L
S. Hussain, L. Yangping, Review of solid oxide fuel cell materials: Cathode, anode, and electrolyte, Energy Transitions 4 (2) (2020) 113–126
2020
-
[11]
Sz´ asz, F
J. Sz´ asz, F. Wankm¨ uller, V. Wilde, H. St¨ ormer, D. Gerthsen, N. H. Menzler, E. Ivers-Tiff´ ee, Nature and functionality of oxygen/cathode/electrolyte-interfaces in SOFCs, ECS Transactions 66 (2) (2015) 79
2015
-
[12]
Suzuki, Z
T. Suzuki, Z. Hasan, Y. Funahashi, T. Yamaguchi, Y. Fujishiro, M. Awano, Impact of anode microstructure on solid oxide fuel cells, Science 325 (5942) (2009) 852–855
2009
-
[13]
P. A. Connor, X. Yue, C. D. Savaniu, R. Price, G. Triantafyllou, M. Cassidy, G. Kerherve, D. J. Payne, R. C. Maher, L. F. Cohen, R. I. Tomov, B. A. Glowacki, R. V. Kumar, J. T. S. Irvine, Tailoring SOFC electrode microstructures for improved performance, Advanced Energy Materi...
2018
-
[14]
O. M. Pecho, A. Mai, B. M¨ unch, T. Hocker, R. J. Flatt, L. Holzer, 3D microstructure effects in Ni-YSZ anodes: Influence of TPB lengths on the electrochemical performance, Materials 8 (10) (2015) 7129–7144
2015
-
[15]
J. R. Wilson, W. Kobsiriphat, R. Mendoza, H.-Y. Chen, J. M. Hiller, D. J. Miller, K. Thornton, P. W. Voorhees, S. B. Adler, S. A. Barnett, Three-dimensional reconstruction of a solid-oxide fuel-cell anode, Nature Materials 5 (7) (2006) 541–544
2006
-
[16]
Vivet, S
N. Vivet, S. Chupin, E. Estrade, A. Richard, S. Bonnamy, D. Rochais, E. Bruneton, Effect of Ni content in SOFC Ni-YSZ cermets: A three-dimensional study by FIB-SEM tomography, Journal of Power Sources 196 (23) (2011) 9989–9997
2011
-
[17]
Kishimoto, M
M. Kishimoto, M. Lomberg, E. Ruiz-Trejo, N. P. Brandon, Numerical modeling of nickel-infiltrated gadolinium- doped ceria electrodes reconstructed with focused ion beam tomography, Electrochimica Acta 190 (2016) 178– 185
2016
-
[18]
J. A. Taillon, C. Pellegrinelli, Y. Huang, E. D. Wachsman, L. G. Salamanca-Riba, Three dimensional microstruc- tural characterization of cathode degradation in SOFCs using focused ion beam and SEM, ECS Transactions 61 (1) (2014) 109
2014
-
[19]
Meffert, F
M. Meffert, F. Wankm¨ uller, H. St¨ ormer, A. Weber, P. Lupetin, E. Ivers-Tiff´ ee, D. Gerthsen, Optimization of material contrast for efficient FIB-SEM tomography of solid oxide fuel cells, Fuel Cells 20 (5) (2020) 580–591
2020
-
[20]
Holzer, B
L. Holzer, B. Iwanschitz, T. Hocker, B. M¨ unch, M. Prestat, D. Wiedenmann, U. Vogt, P. Holtappels, J. Sfeir, A. Mai, et al., Microstructure degradation of cermet anodes for solid oxide fuel cells: Quantification of nickel grain growth in dry and in humid atmospheres, Journal ...
2011
-
[21]
Holzer, B
L. Holzer, B. M¨ unch, B. Iwanschitz, M. Cantoni, T. Hocker, T. Graule, Quantitative relationships between composition, particle size, triple phase boundary length and surface area in nickel-cermet anodes for solid oxide fuel cells, Journal of Power Sources 196 (17) (2011) 7076–7089
2011
-
[22]
Zekri, M
A. Zekri, M. Knipper, J. Parisi, T. Plaggenborg, Microstructure degradation of Ni/CGO anodes for solid oxide fuel cells after long operation time using 3D reconstructions by fib tomography, Physical Chemistry Chemical Physics 19 (21) (2017) 13767–13777. 15
2017
-
[23]
Sciazko, Y
A. Sciazko, Y. Komatsu, T. Shimura, N. Shikazono, Multiscale microstructural evolutions of nickel-gadolinium doped ceria in solid oxide fuel cell anode, Journal of Power Sources 478 (2020) 228710
2020
-
[24]
Mahbub, T
R. Mahbub, T. Hsu, W. K. Epting, G. Nolan, Y. Lei, N. T. Nuhfer, R. B. Doane, H. W. Abernathy, G. A. Hackett, S. Litster, A. D. Rollett, P. A. Salvador, Quantifying morphological variability and operating evolution in SOFC anode microstructures, Journal of Power Sources 498 (2...
2021
-
[25]
W. K. Epting, Z. Mansley, D. B. Menasche, P. Kenesei, R. M. Suter, K. Gerdes, S. Litster, P. A. Salvador, Quan- tifying intermediate-frequency heterogeneities of SOFC electrodes using X-ray computed tomography, Journal of the American Ceramic Society 100 (5) (2017) 2232–2242
2017
-
[26]
T. Hsu, W. K. Epting, R. Mahbub, N. T. Nuhfer, S. Bhattacharya, Y. Lei, H. M. Miller, P. R. Ohodnicki, K. R. Gerdes, H. W. Abernathy, G. A. Hackett, A. D. Rollett, M. De Graef, S. Litster, P. A. Salvador, Mesoscale characterization of local property distributions in heterogene...
2018
-
[27]
Y. Liu, F. Wankm¨ uller, T. P. Lehnert, M. Juckel, N. H. Menzler, A. Weber, Microstructural changes in nickel- ceria fuel electrodes at elevated temperature, Fuel Cells 23 (6) (2023) 430–441
2023
-
[28]
Y. Liu, M. Juckel, N. H. Menzler, A. Weber, Ni/GDC fuel electrode for low-temperature SOFC and its aging behavior under accelerated stress, Journal of The Electrochemical Society 171 (5) (2024) 054514
2024
-
[29]
Getreuer, Rudin-Osher-Fatemi total variation denoising using split Bregman, Image Processing On Line 2 (2012) 74–95
P. Getreuer, Rudin-Osher-Fatemi total variation denoising using split Bregman, Image Processing On Line 2 (2012) 74–95
2012
-
[30]
Kroon, Numerical optimization of kernel based derivatives, short paper, University Twente (2009)
D. Kroon, Numerical optimization of kernel based derivatives, short paper, University Twente (2009)
2009
-
[31]
Meijering, M
E. Meijering, M. Jacob, J.-C. Sarria, P. Steiner, H. Hirling, M. Unser, Design and validation of a tool for neurite tracing and analysis in fluorescence microscopy images, Cytometry Part A 58A (2) (2004) 167–176
2004
-
[32]
Beucher, F
S. Beucher, F. Meyer, The morphological approach to segmentation: The watershed transformation, in: E. R. Dougherty (Ed.), Mathematical Morphology in Image Processing, Marcel Dekker Inc., 1993, pp. 433–481
1993
-
[33]
Molchanov, Theory of Random Sets, Springer, 2005
I. Molchanov, Theory of Random Sets, Springer, 2005
2005
-
[34]
S. N. Chiu, D. Stoyan, W. S. Kendall, J. Mecke, Stochastic Geometry and its Applications, 3rd Edition, J. Wiley & Sons, 2013
2013
-
[35]
Schladitz, J
K. Schladitz, J. Ohser, W. Nagel, Measuring intrinsic volumes in digital 3D images, in: A. Kuba and L. Ny´ ul and K. Pal´ agyi (eds.), Proceedings of the 13th International Conference on Discrete Geometry for Computer Imagery, 247–258 (2007)
2007
-
[36]
J. R. Wilson, J. S. Cronin, A. T. Duong, S. Rukes, H.-Y. Chen, K. Thornton, D. R. Mumm, S. Barnett, Effect of composition of ( La0.8Sr0.2MnO3–Y2O3-stabilized ZrO2) cathodes: Correlating three-dimensional microstructure and polarization resistance, Journal of Power Sources 195 ...
2010
-
[37]
H. Iwai, N. Shikazono, T. Matsui, H. Teshima, M. Kishimoto, R. Kishida, D. Hayashi, K. Matsuzaki, D. Kanno, M. Saito, et al., Quantification of SOFC anode microstructure based on dual beam FIB-SEM technique, Journal of Power Sources 195 (4) (2010) 955–961
2010
-
[38]
P. S. Jørgensen, K. Yakal-Kremski, J. Wilson, J. R. Bowen, S. Barnett, On the accuracy of triple phase boundary lengths calculated from tomographic image data, Journal of Power Sources 261 (2014) 198–205
2014
-
[39]
P. S. Jørgensen, K. V. Hansen, R. Larsen, J. R. Bowen, High accuracy interface characterization of three phase material systems in three dimensions, Journal of Power Sources 195 (24) (2010) 8168–8176
2010
-
[40]
Holzer, P
L. Holzer, P. Marmet, A. Wiegmann, M. Neumann, V. Schmidt, Tortuosity and Microstructure Effects in Porous Media: Classical Theories, Empirical Data and Modern Methods, Springer, 2023
2023
-
[41]
Neumann, C
M. Neumann, C. Hirsch, J. Stanˇ ek, V. Beneˇ s, V. Schmidt, Estimation of geodesic tortuosity and constrictivity in stationary random closed sets, Scandinavian Journal of Statistics 46 (3) (2019) 848–884. 16
2019
-
[42]
Jungnickel, Graphs, Networks and Algorithms, 3rd Edition, Springer, 2007
D. Jungnickel, Graphs, Networks and Algorithms, 3rd Edition, Springer, 2007
2007
-
[43]
M¨ unch, L
B. M¨ unch, L. Holzer, Contradicting geometrical concepts in pore size analysis attained with electron microscopy and mercury intrusion, Journal of the American Ceramic Society 91 (12) (2008) 4059–4067
2008
-
[44]
Serra, Image Analysis and Mathematical Morphology, Academic Press, 1982
J. Serra, Image Analysis and Mathematical Morphology, Academic Press, 1982
1982
-
[45]
Soille, Morphological Image Analysis: Principles and Applications, 2nd Edition, Springer, 2003
P. Soille, Morphological Image Analysis: Principles and Applications, 2nd Edition, Springer, 2003
2003
-
[46]
Prifling, M
B. Prifling, M. Ademmer, F. Single, O. Benevolenski, A. Hilger, M. Osenberg, I. Manke, V. Schmidt, Stochastic 3D microstructure modeling of anodes in lithium-ion batteries with a particular focus on local heterogeneity, Computational Materials Science 192 (2021) 110354
2021
-
[47]
Neumann, O
M. Neumann, O. Stenzel, F. Willot, L. Holzer, V. Schmidt, Quantifying the influence of microstructure on effective conductivity and permeability: Virtual materials testing, International Journal of Solids and Structures 184 (2020) 211–220, physics and Mechanics of Random Struc...
2020
-
[48]
Ohser, K
J. Ohser, K. Schladitz, 3D Images of Materials Structures: Processing and Analysis, Wiley-VCH, 2009
2009
-
[49]
Ohser, F
J. Ohser, F. M¨ ucklich, Statistical Analysis of Microstructures in Materials Science, J. Wiley & Sons, 2000
2000
-
[50]
Mayer, A time-optimal algorithm for the estimation of contact distribution functions of random closed sets, Image Analysis and Stereology 23 (2004) 177–183
J. Mayer, A time-optimal algorithm for the estimation of contact distribution functions of random closed sets, Image Analysis and Stereology 23 (2004) 177–183
2004
-
[51]
Prifling, M
B. Prifling, M. Weber, N. Ray, A. Prechtel, M. Phalempin, S. Schl¨ uter, D. Vetterlein, V. Schmidt, Quantifying the impact of 3D pore space morphology on soil gas diffusion in loam and sand, Transport in Porous Media 149 (2023) 501–527
2023
-
[52]
Kullmann, D
F. Kullmann, D. Esau, K. Limbeck, S. Dierickx, A. Lindner, H. St¨ ormer, A. Weber, Impact of nickel on the surface reaction in ceria-based electrodes for solid oxide cells, Journal of Power Sources 625 (2025) 235621. 17
2025
Reviewed August 12, 2026 · model on record in the stance chip above.
Discussion (0). Continue with ORCID to comment.