REVIEW 3 major objections 6 minor 1 cited by
An upgraded GMRT and MeerKAT study of radio relics in the low mass merging cluster PSZ2 G200.95-28.16
T0 review · 3 major / 6 minor · reviewed 2026-08-12 · deepseek-v4-flash
Pith's one-line read Three radio relics in a low-mass cluster merger reveal an off-axis geometry.
desk verdict Solid multi-wavelength study of a rare low-mass merging cluster; the faint R3 relic needs better evidence before the triple-relic claim firms up. read the letter →
The pith
A machine-rendered reading of the paper's core claim, the machinery that carries it, and where it could break.
The reading
What carries the argument
The argument runs on the diffusive shock acceleration (DSA) relation between the injection spectral index $\alpha_{\rm inj}$ and shock Mach number $M$, $\alpha_{\rm inj}=(M^2+3)/(2(1-M^2))$, applied to integrated spectra under the continuous-injection assumption $\alpha_{\rm int}=\alpha_{\rm inj}-0.5$. Around this sit the resolved spectral index maps, which trace spectral steepening toward the cluster centre and therefore the shock propagation direction, and the MeerKAT polarization B-vector maps, which show smooth, aligned magnetic fields and depolarization across the shock width. The Chandra X-ray surface brightness maps provide the merger axis and subcluster morphology used to test axial, equatorial, and off-axis merger scenarios.
What would settle it
A Chandra temperature or surface-brightness jump measurement across the Seahorse would provide an independent Mach number; if it differs greatly from 3.1, the DSA-based shock interpretation fails. Alternatively, a deep high-resolution image showing R3 to be a compact AGN lobe would remove the triple-relic claim.
Extended reading notes
Core claim
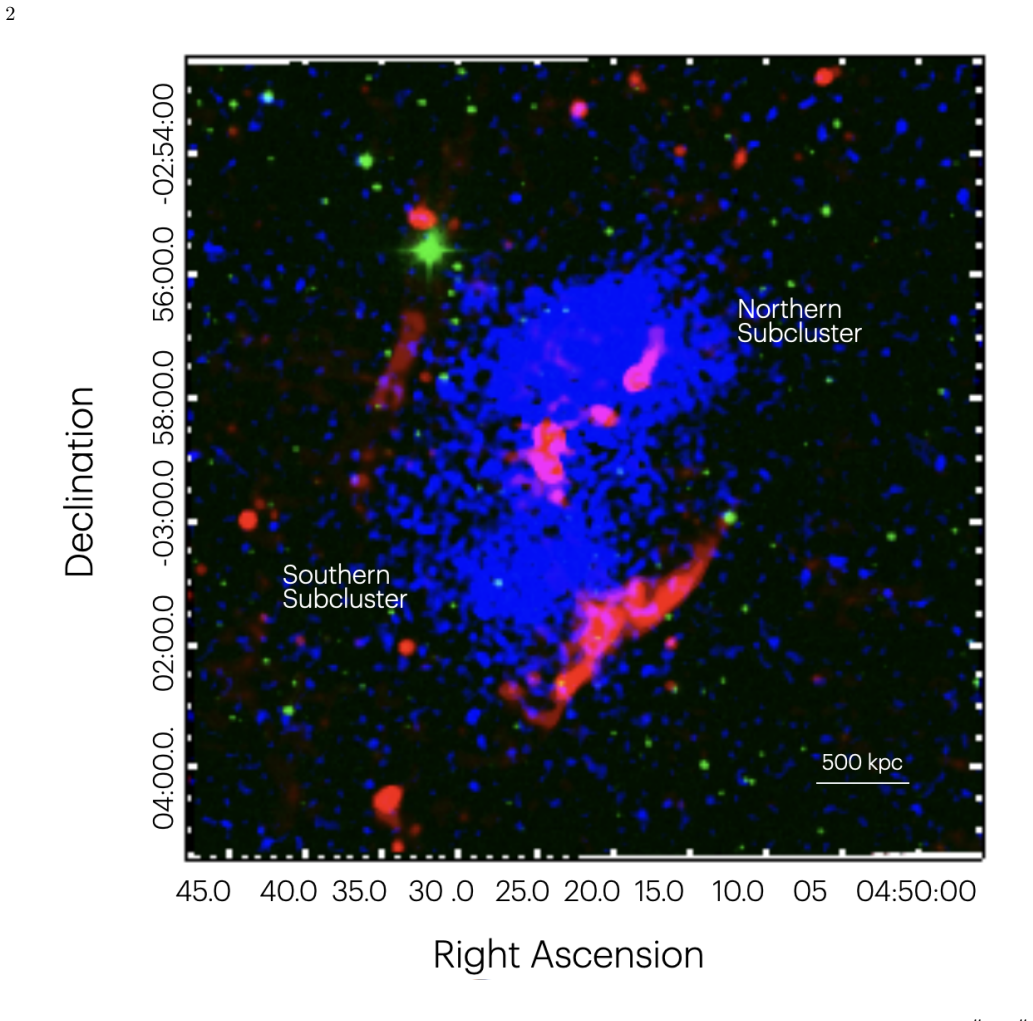
The paper establishes that PSZ2 G200.95-28.16, a low-mass ($M_{500}=(2.7\pm0.2)\times10^{14}\,M_\odot$) merging cluster at $z=0.22$, hosts three radio relics rather than one. The Seahorse relic, first found by Kale et al. 2017, has two filaments separated by a notch and an integrated spectral index of $-1.1\pm0.1$; the eastern relic R2 shows two substructures and $\alpha=-1.4\pm0.2$; the faint northwestern arc R3 has $\alpha=-1.6\pm0.4$ and a largest linear size of only 340 kpc. All three are polarized at 1283 MHz, with fractional polarizations of $23\pm2\%$, $28\pm4\%$, and $58\pm9\%$, and the Seahorse shows spectral steepening toward the cluster centre, indicating outward-propagating shocks. Assuming diffusive shock acceleration with continuous injection, the injection spectral indices imply Mach numbers $3.1\pm0.8$ (Seahorse) and $2.8\pm0.9$ (R2), consistent with the weak shocks expected in low-mass mergers. Chandra images show two subclusters but no surface-brightness discontinuity at the relic positions, and the relics are not perpendicular to the X-ray elongation axis; the paper argues this geometry, together with the smooth aligned magnetic fields seen in the polarization maps, is best explained by an off-axis merger. In the radio power versus cluster mass plane, R2 follows the established relation while the Seahorse and R3 are outliers. A ring-like source detected at 650 MHz, with a mean spectral index of $-0.7\pm0.1$ and edge-enhanced polarization, is proposed as either an Odd Radio Circle candidate or a tailed radio galaxy bent by merger ram pressure.
Load-bearing premise
The claim stands or falls on whether the three diffuse polarized sources, especially the faint R3, are genuine radio relics produced by merger shocks rather than AGN-related or projected background emission.
Editorial extensions
If this is right
- If the DSA interpretation is correct, the Seahorse and R2 shocks have Mach numbers around 3, meaning relatively weak shocks can still produce Mpc-scale radio relics in a low-mass cluster.
- A triple-relic system in a $2.7\times10^{14}\,M_\odot$ cluster broadens the known population of multiple-relic clusters and challenges the idea that such systems require very massive mergers.
- The Seahorse and R3 lying off the radio power-mass relation implies that scatter in that relation comes partly from shock strength variations within a single complex merger, not just from cluster mass.
- The 100 kpc radio ring, if confirmed as an Odd Radio Circle, would be the smallest and lowest-luminosity ORC yet found and would link ORCs to ram-pressure phenomena in merging clusters.
Reading between the lines
- If the off-axis merger interpretation holds, the relic geometry implies a substantial impact parameter; matching the relic positions, sizes, and Mach numbers in simulations could constrain the mass ratio and pericenter, a test the paper does not run.
- R3's identification as a genuine relic rests on a faint 1.64 mJy source seen only in smoothed images; a deep high-resolution observation that resolves its spectrum and polarization would either confirm the triple-relic claim or remove it from the sample.
- The steep scattered spectral indices seen in low-mass cluster relics suggest that low-mass mergers routinely produce shocks with Mach numbers near 3; targeted surveys of low-mass clusters should find more such relics, which would place the power-mass correlation on firmer footing.
Editorial analysis
A structured set of objections, weighed in public.
Referee Report
Summary. Pal et al. present uGMRT 400/650 MHz and archival MeerKAT 1283 MHz observations of the low-mass merging cluster PSZ2 G200.95-28.16, together with Chandra X-ray surface brightness maps. They identify three radio relics — the previously known Seahorse (R1) and the newly confirmed R2 and R3 — measure their integrated spectral indices, polarization fractions, and largest linear sizes, and use the diffusive shock acceleration model to convert spectral indices into Mach numbers. They place the relics on the radio power–cluster mass plane, discuss possible merger geometries, and report a ring-like source as an Odd Radio Circle candidate. The central claim is that this low-mass cluster hosts three genuine radio relics whose positions are not perpendicular to the X-ray-determined merger axis, most plausibly indicating an off-axis merger.
Significance. If all three identifications hold, the system is one of the very few clusters with more than two radio relics and the lowest-mass such system known, and the polarization and spectral-index measurements provide concrete constraints for relic acceleration models and merger simulations. The paper's strengths are the use of independent uGMRT and MeerKAT data for the two brighter relics, the standard polarization and RM-synthesis analysis, explicit comparisons with external scaling relations, and a clear data-availability statement. However, the scientific payoff — the triple-relic designation, the outlier status in the scaling relation, and the off-axis merger geometry — depends critically on R3, whose detection is the least secure element in the analysis.
major comments (3)
- [Sec. 5.3 / Sec. 5.1 / Table 3] The identification of R3 as a genuine radio relic is not demonstrated at the level required for the paper's central claim. The source is detected only in the 10''×10'' smoothed 650 MHz image and in low-significance MeerKAT contours (2–3σ), and its quoted flux-density error implies a marginal detection. Please show the R3 region in the unsmoothed 650 MHz image, provide a significance or reliability map, compare point-source-subtracted and unsubtracted images, and demonstrate that the emission is resolved beyond the beam. The fractional polarization of 58 ± 9% for R3 is also derived from a very small number of beams and should be reported with the number of independent beams and a debiased estimator if one was not used. If R3 cannot be independently confirmed, the triple-relic interpretation and the geometry discussion in Section 6.3 lose one of their anchors and should be correspondingly downgraded.
- [Sec. 3.1 / Table 3 / Fig. 6] The 400 MHz observations are described as severely RFI-affected (about 70% flagged), yet no 400 MHz flux density for the Seahorse is listed in Table 3, and the text does not state whether these data enter the integrated spectral index shown in Fig. 6. If a 400 MHz point is used, its flux density, flagging fraction, and systematic uncertainty must be reported; if it is not used, this should be stated explicitly, because the DSA Mach number in Section 6.2 depends directly on the integrated spectral index.
- [Sec. 6.3] The proposed off-axis merger scenario uses the 'faint extension (2σ) of R2 towards the north and then a broken arc up to R3' as morphological evidence connecting R2 and R3. A 2σ feature is not by itself sufficient to support a geometric conclusion; please either demonstrate that the extension is real, for example with a low-resolution MeerKAT image and a reliability mask, or present the scenario without relying on this marginal feature.
minor comments (6)
- [Abstract / Table 3] The abstract gives the largest linear size of R2 as '1.12~kpc', which should be '1.12 Mpc'; Table 3 also uses both 'LLS' and 'LSS' for the same quantity.
- [Sec. 5.3 / Table 3 / Abstract] The integrated spectral index of R3 is quoted as −1.6 ± 0.3 in Section 5.3 and as −1.6 ± 0.4 in Table 3 and the abstract; these values should be reconciled.
- [Sec. 5.3] The phrase 'fractions of R3 with an extension towards the west' is unclear; presumably 'faint parts of R3' is intended.
- [Sec. 6.1 / Fig. 11] The reference to 'the green solid line, left panel in Fig. 11' is confusing because the left panel caption describes histograms of spectral indices; please clarify where the Mach-number curve is displayed.
- [Sec. 6.4] The statement that the ring 'shares the properties of the Odd Radio Circles' is somewhat strong given the ring's 100 kpc size compared with typical ORC diameters of 300–500 kpc; consider tempering the wording given the alternative tailed-source interpretation.
- [References] The van Weeren et al. 2010a and 2010b entries appear to have identical titles and page numbers; please verify the bibliographic details.
Circularity Check
No circularity: the Mach numbers follow directly from measured spectral indices via the standard DSA formula, and the scaling-relation comparison uses external samples.
full rationale
This paper is an observational study whose central quantitative claims are derived from directly measured flux densities and spectral indices. The DSA-based Mach numbers (Sec. 6.2) come from applying Eq. 2 to the measured integrated spectral indices, not from any parameter fitted to the same data. The radio-power versus cluster-mass comparison (Sec. 6.1) uses the externally defined scaling relations of de Gasperin et al. 2014 and Jones et al. 2023, with the authors' own measurements plotted against those independent benchmarks. The identification of R3 as a relic is a classification judgment based on faint low-resolution detections, which is a data-quality and astrophysical-interpretation concern, not a circularity: the claim does not assume the conclusion in order to produce it. Self-citations such as Kale et al. 2017 are used to credit the earlier discovery of the Seahorse and to include earlier flux-density measurements in the spectral fit; they are not load-bearing in a way that reduces a prediction to an input. No equation in the paper defines a derived quantity in terms of the quantity it is claimed to predict, and no fitted parameter is renamed as a prediction. The work is self-contained against external data and standard physical formulas, so the circularity score is 0.
Assumptions & free parameters
assumptions (4)
- domain assumption The diffusive shock acceleration (DSA) model and Eq. (2) relate the spectral index of radio relics to the shock Mach number.
- domain assumption For continuous injection, the integrated spectral index equals the injection index minus 0.5 (α_int = α_inj - 0.5).
- domain assumption The Chandra X-ray surface brightness peaks trace two subclusters in a merger, and the X-ray elongation defines the merger axis.
- domain assumption After correcting for the average Galactic RM (4.2 rad m^-2), the measured linear polarization at 1283 MHz is intrinsic to the relics.
Cite this review
Pith. "Pith review of An upgraded GMRT and MeerKAT study of radio relics in the low mass merging cluster PSZ2 G200.95-28.16." pith.science (2026). https://pith.science/paper/7IIEGXIX
@misc{pith2026241115480,
  author       = {Pith},
  title        = {Pith review of: An upgraded GMRT and MeerKAT study of radio relics in the low mass merging cluster PSZ2 G200.95-28.16},
  year         = {2026},
  howpublished = {\url{https://pith.science/paper/7IIEGXIX}},
  note         = {Machine review of arXiv:2411.15480}
}
abstract
Diffuse radio sources known as radio relics are direct tracers of shocks in the outskirts of merging galaxy clusters. PSZ2 G200.95-28.16, a low-mass merging cluster($\textrm{M}_{500} = (2.7 \pm 0.2) \times 10^{14}~\mathrm{M}_{\odot}$) features a prominent radio relic, first identified by Kale et al. 2017. We name this relic as the Seahorse. The MeerKAT Galaxy Cluster Legacy Survey has confirmed two additional radio relics, R2 and R3 in this cluster. We present new observations of this cluster with the Upgraded GMRT at 400 and 650 MHz paired with the Chandra X-ray data. The largest linear sizes for the three relics are~1.53 Mpc, 1.12~kpc, and 340~kpc. All three radio relics are polarized at 1283~MHz. Assuming the diffusive shock acceleration model, the spectral indices of the relics imply shock Mach Numbers of $3.1 \pm 0.8$ and $2.8 \pm 0.9$ for the Seahorse and R2, respectively. The Chandra X-ray surface brightness map shows two prominent subclusters, but the relics are not perpendicular to the likely merger axis as typically observed; no shocks are detected at the locations of the relics. We discuss the possible merger scenarios in light of the low mass of the cluster and the radio and X-ray properties of the relics. The relic R2 follows the correlation known in the radio relic power and cluster mass plane, but the Seahorse and R3 relics are outliers. We have also discovered a radio ring in our 650~MHz uGMRT image that could be an Odd radio circle candidate.
Figures


Figures from the paper (9 more)


Forward citations
Cited by 1 Pith paper
-
Multi-frequency Radio Observations of the Dissociative Cluster Merger CIZA J0107.7+5408
New VLA observations resolve the diffuse radio emission in the merging cluster CIZA J0107.7+5408 into two steep-spectrum subcluster components, one showing a 340 MHz edge coincident with a weak X-ray shock but no matc...
Reference graph
Works this paper leans on
-
[1]
Axford, W. I., Leer, E., & Skadron, G. 1977, in International Cosmic Ray Conference, Vol. 11, International Cosmic Ray Conference, 132
work page 1977
-
[2]
Bell, A. R. 1978, MNRAS, 182, 147, doi: 10.1093/mnras/182.2.147
-
[3]
1987, PhR, 154, 1, doi: 10.1016/0370-1573(87)90134-7
Blandford, R., & Eichler, D. 1987, PhR, 154, 1, doi: 10.1016/0370-1573(87)90134-7
-
[4]
2009, A&A, 494, 429, doi: 10.1051/0004-6361:200810588
Murgia, M. 2009, A&A, 494, 429, doi: 10.1051/0004-6361:200810588
-
[6]
2020, A&A, 634, A64, doi: 10.1051/0004-6361/201936216
Botteon, A., Brunetti, G., Ryu, D., & Roh, S. 2020, A&A, 634, A64, doi: 10.1051/0004-6361/201936216
-
[7]
Brentjens, M. A., & de Bruyn, A. G. 2005, A&A, 441, 1217, doi: 10.1051/0004-6361:20052990 Br¨ uggen, M., van Weeren, R. J., & R¨ ottgering, H. J. A. 2012, MNRAS, 425, L76, doi: 10.1111/j.1745-3933.2012.01304.x
arXiv 2005
-
[8]
2019, ApJ, 883, 118, doi: 10.3847/1538-4357/ab3983 CASA Team, Bean, B., Bhatnagar, S., et al
Brzycki, B., & ZuHone, J. 2019, ApJ, 883, 118, doi: 10.3847/1538-4357/ab3983 CASA Team, Bean, B., Bhatnagar, S., et al. 2022, PASP, 134, 114501, doi: 10.1088/1538-3873/ac9642
-
[9]
2017, ApJ, 846, 111, doi: 10.3847/1538-4357/aa85a2
Chandra, P., & Kanekar, N. 2017, ApJ, 846, 111, doi: 10.3847/1538-4357/aa85a2
Show all 56 references
-
[10]
Colafrancesco, S., Marchegiani, P., & Paulo, C. M. 2017, MNRAS, 471, 4747, doi: 10.1093/mnras/stx1806 de Gasperin, F., van Weeren, R. J., Br¨ uggen, M., et al. 2014, MNRAS, 444, 3130, doi: 10.1093/mnras/stu1658 Di Gennaro, G., van Weeren, R. J., Hoeft, M., et al. 2018, ApJ, 86...
2017 doi
-
[11]
M., Koribalski, B
Dolag, K., B¨ oss, L. M., Koribalski, B. S., Steinwandel, U. P., & Valentini, M. 2023, ApJ, 945, 74, doi: 10.3847/1538-4357/acb5f5
2023 doi
-
[12]
S., Parekh, V., Kale, R., & George, L
Dwarakanath, K. S., Parekh, V., Kale, R., & George, L. T. 2018, MNRAS, 477, 957, doi: 10.1093/mnras/sty744
2018 doi
-
[13]
C., & Jones, L
Ellis, S. C., & Jones, L. R. 2004, MNRAS, 348, 165, doi: 10.1111/j.1365-2966.2004.07338.x
2004
- [14]
-
[15]
2001, A&A, 373, 106, doi: 10.1051/0004-6361:20010581
Feretti, L., Fusco-Femiano, R., Giovannini, G., & Govoni, F. 2001, A&A, 373, 106, doi: 10.1051/0004-6361:20010581
2001 doi
-
[16]
C., Allen, G
Fruscione, A., McDowell, J. C., Allen, G. E., et al. 2006, in Society of Photo-Optical Instrumentation Engineers (SPIE) Conference Series, Vol. 6270, Observatory Operations: Strategies, Processes, and Systems, ed. D. R. Silva & R. E. Doxsey, 62701V, doi: 10.1117/12.671760
2006 doi
-
[17]
T., Dwarakanath, K
George, L. T., Dwarakanath, K. S., Johnston-Hollitt, M., et al. 2017, MNRAS, 467, 936, doi: 10.1093/mnras/stx155
2017 doi
-
[18]
2005, A&A, 440, 867, doi: 10.1051/0004-6361:20053016
Giacintucci, S., Venturi, T., Brunetti, G., et al. 2005, A&A, 440, 867, doi: 10.1051/0004-6361:20053016
2005 doi
-
[19]
1991, A&A, 252, 528
Giovannini, G., Feretti, L., & Stanghellini, C. 1991, A&A, 252, 528
1991
-
[20]
A., Feretti, L., & Giovannini, G
Govoni, F., Enßlin, T. A., Feretti, L., & Giovannini, G. 2001, A&A, 369, 441, doi: 10.1051/0004-6361:20010115
2001 doi
-
[21]
2018, ApJ, 857, 26, doi: 10.3847/1538-4357/aab4a2
Ha, J.-H., Ryu, D., & Kang, H. 2018, ApJ, 857, 26, doi: 10.3847/1538-4357/aab4a2
2018 doi
-
[22]
C., & Markevitch, M
Hickox, R. C., & Markevitch, M. 2006, ApJ, 645, 95, doi: 10.1086/504070
2006 doi
-
[23]
N., Shimwell, T
Hoang, D. N., Shimwell, T. W., Stroe, A., et al. 2017, MNRAS, 471, 1107, doi: 10.1093/mnras/stx1645
2017 doi
-
[24]
N., Shimwell, T
Hoang, D. N., Shimwell, T. W., van Weeren, R. J., et al. 2019, A&A, 622, A21, doi: 10.1051/0004-6361/201834025
2019 doi
-
[25]
2022, Galaxies, 10, 10, doi: 10.3390/galaxies10010010
Hoeft, M., Rajpurohit, K., Wittor, D., di Gennaro, G., & Dom ´ ınguez-Fern´ andez, P. 2022, Galaxies, 10, 10, doi: 10.3390/galaxies10010010
2022 doi
-
[26]
S., Betti, S., et al
Hutschenreuter, S., Anderson, C. S., Betti, S., et al. 2022, A&A, 657, A43, doi: 10.1051/0004-6361/202140486
2022 doi
-
[27]
2023, A&A, 680, A31, doi: 10.1051/0004-6361/202245102
Jones, A., de Gasperin, F., Cuciti, V., et al. 2023, A&A, 680, A31, doi: 10.1051/0004-6361/202245102
2023 doi
-
[28]
S., Bagchi, J., & Paul, S
Kale, R., Dwarakanath, K. S., Bagchi, J., & Paul, S. 2012, MNRAS, 426, 1204, doi: 10.1111/j.1365-2966.2012.21519.x
2012
-
[29]
R., Giacintucci, S., et al
Kale, R., Wik, D. R., Giacintucci, S., et al. 2017, MNRAS, 472, 940, doi: 10.1093/mnras/stx2031
2017 doi
-
[30]
2011a, ApJ, 734, 18, doi: 10.1088/0004-637X/734/1/18 —
Kang, H., & Ryu, D. 2011a, ApJ, 734, 18, doi: 10.1088/0004-637X/734/1/18 —. 2011b, ApJ, 734, 18, doi: 10.1088/0004-637X/734/1/18
-
[31]
2017, A&A, 600, A18, doi: 10.1051/0004-6361/201629570
Kierdorf, M., Beck, R., Hoeft, M., et al. 2017, A&A, 600, A18, doi: 10.1051/0004-6361/201629570
2017 doi
-
[32]
D., Rudnick, L., et al
Knowles, K., Cotton, W. D., Rudnick, L., et al. 2022, A&A, 657, A56, doi: 10.1051/0004-6361/202141488
2022 doi
-
[33]
S., Norris, R
Koribalski, B. S., Norris, R. P., Andernach, H., et al. 2021, MNRAS, 505, L11, doi: 10.1093/mnrasl/slab041
2021 doi
-
[34]
Krymskii, G. F. 1977, Akademiia Nauk SSSR Doklady, 234, 1306
1977
-
[35]
J., Kang, H., et al
Lee, W., Jee, M. J., Kang, H., et al. 2020, ApJ, 894, 60, doi: 10.3847/1538-4357/ab855f
2020 doi
-
[36]
2024, A&A, 686, A55, doi: 10.1051/0004-6361/202348194 17
Lee, W., Pillepich, A., ZuHone, J., et al. 2024, A&A, 686, A55, doi: 10.1051/0004-6361/202348194 17
2024 doi
-
[37]
Shabala, S. S. 2023, MNRAS, 520, 1439, doi: 10.1093/mnras/stad074
2023 doi
-
[38]
2005, ApJ, 627, 733, doi: 10.1086/430695
Markevitch, M., Govoni, F., Brunetti, G., & Jerius, D. 2005, ApJ, 627, 733, doi: 10.1086/430695
2005 doi
-
[39]
J., Nulsen, P
Markevitch, M., Ponman, T. J., Nulsen, P. E. J., et al. 2000, ApJ, 541, 542, doi: 10.1086/309470
2000 doi
-
[40]
W., Biller, B., et al
Markevitch, M., Bautz, M. W., Biller, B., et al. 2003, ApJ, 583, 70, doi: 10.1086/345347
2003 doi
-
[41]
P., Hopkins, A
Norris, R. P., Hopkins, A. M., Afonso, J., et al. 2011, PASA, 28, 215, doi: 10.1071/AS11021
2011 doi
-
[42]
P., Intema, H
Norris, R. P., Intema, H. T., Kapi´ nska, A. D., et al. 2021, PASA, 38, e003, doi: 10.1017/pasa.2020.52
2021 doi
-
[43]
P., Collier, J
Norris, R. P., Collier, J. D., Crocker, R. M., et al. 2022, MNRAS, 513, 1300, doi: 10.1093/mnras/stac701
2022 doi
-
[44]
2022, MNRAS, 513, 101, doi: 10.1093/mnrasl/slac038 O’Dea, C
Omar, A. 2022, MNRAS, 513, 101, doi: 10.1093/mnrasl/slac038 O’Dea, C. P., & Baum, S. A. 2023, Galaxies, 11, doi: 10.3390/galaxies11030067
2022 doi
-
[45]
Pearce, C. J. J., van Weeren, R. J., Andrade-Santos, F., et al. 2017, ApJ, 845, 81, doi: 10.3847/1538-4357/aa7e2f Planck Collaboration, Ade, P. A. R., Aghanim, N., et al. 2011, A&A, 536, A8, doi: 10.1051/0004-6361/201116459 Planck Collaboration, Aghanim, N., Arnaud, M., et al....
2017 doi
-
[46]
B., Fardal, M
Poole, G. B., Fardal, M. A., Babul, A., et al. 2006, MNRAS, 373, 881, doi: 10.1111/j.1365-2966.2006.10916.x
2006
-
[47]
Gaensler, B. M. 2020, RM-Tools: Rotation measure (RM) synthesis and Stokes QU-fitting, Astrophysics Source Code Library, record ascl:2005.003
2020
-
[48]
2020a, A&A, 636, A30, doi: 10.1051/0004-6361/201937139
Rajpurohit, K., Hoeft, M., Vazza, F., et al. 2020a, A&A, 636, A30, doi: 10.1051/0004-6361/201937139
-
[49]
2020b, A&A, 642, L13, doi: 10.1051/0004-6361/202039165
Rajpurohit, K., Vazza, F., Hoeft, M., et al. 2020b, A&A, 642, L13, doi: 10.1051/0004-6361/202039165
- [50]
-
[51]
F., Cutri, R
Skrutskie, M. F., Cutri, R. M., Stiening, R., et al. 2006, AJ, 131, 1163, doi: 10.1086/498708
2006 doi
-
[52]
J., Intema, H
Stroe, A., van Weeren, R. J., Intema, H. T., et al. 2013, A&A, 555, A110, doi: 10.1051/0004-6361/201321267 van Weeren, R. J., de Gasperin, F., Akamatsu, H., et al. 2019, SSRv, 215, 16, doi: 10.1007/s11214-019-0584-z van Weeren, R. J., Hoeft, M., R¨ ottgering, H. J. A., et al. ...
2013 doi
-
[53]
2010a, Science, 330, 347, doi: 10.1126/science.1194293 —
Hoeft, M. 2010a, Science, 330, 347, doi: 10.1126/science.1194293 —. 2010b, Science, 330, 347, doi: 10.1126/science.1194293
-
[54]
J., Rawlings, S., Jarvis, M
Willott, C. J., Rawlings, S., Jarvis, M. J., & Blundell, K. M. 2003, MNRAS, 339, 173, doi: 10.1046/j.1365-8711.2003.06172.x
2003
-
[55]
2023, MNRAS, 523, 701, doi: 10.1093/mnras/stad1463
Wittor, D., Br¨ uggen, M., Grete, P., & Rajpurohit, K. 2023, MNRAS, 523, 701, doi: 10.1093/mnras/stad1463
2023 doi
-
[56]
2021, Galaxies, 9, doi: 10.3390/galaxies9040111
Wittor, D., Hoeft, M., & Br¨ uggen, M. 2021, Galaxies, 9, doi: 10.3390/galaxies9040111
2021 doi
-
[57]
2014, ApJ, 796, 138, doi: 10.1088/0004-637X/796/2/138
Zhang, C., Yu, Q., & Lu, Y. 2014, ApJ, 796, 138, doi: 10.1088/0004-637X/796/2/138
2014 doi
Reviewed August 12, 2026 · model on record in the stance chip above.
Discussion (0). Continue with ORCID to comment.