REVIEW 4 major objections 5 minor 21 references
A 400Gbit Ethernet core enabling High Data Rate Streaming from FPGAs to Servers and GPUs in Radio Astronomy
T0 review · 4 major / 5 minor · reviewed 2026-08-12 · deepseek-v4-flash
Pith's one-line read An open-source 400GbE FPGA core sustains 362 Gbps to two GPUs with zero packet loss.
desk verdict A useful 400GbE FPGA-to-GPU engineering paper with a plausible 362 Gbps result, but the zero-loss claim and single-point measurements need tightening before you trust the headline. read the letter →
The pith
A machine-rendered reading of the paper's core claim, the machinery that carries it, and where it could break.
The reading
What carries the argument
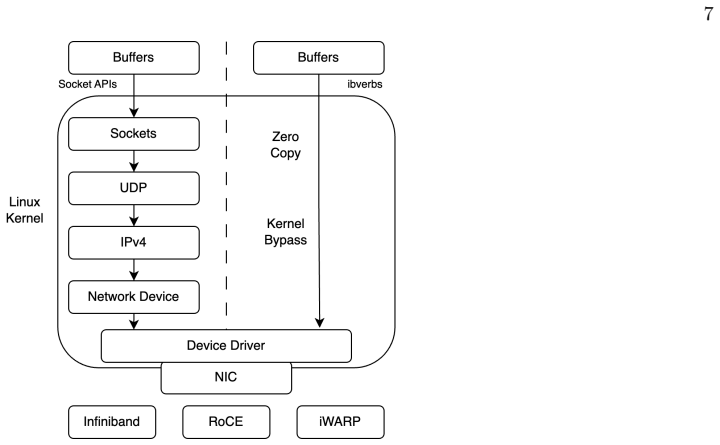
The load-bearing pieces are the UDP packet generation core (which builds packets with user-defined MAC, IP, and ports and runs at 390.625 MHz with a 1024-bit DCMAC bus for a nominal 400 Gbps), the MAC/PHY layer built from AMD's DCMAC hard IP and GTM transceivers in half-density mode for 4x106 Gbps lanes, and a receiver based on the HASHPIPE framework using ibverbs RawEth queue pairs for kernel-bypass, zero-copy capture. Packet loss detection uses a 16-bit sequence counter in each packet payload, checked against the received order. The comparison between DRAM staging and GPUDirect identifies the PCIe 4.0 GPU I/O limit of about 200 Gbps as the constraint on direct transfers.
What would settle it
Run the FPGA-to-two-GPU DRAM test for longer than the counter wrap interval (about 12 ms at 362 Gbps with 8192-byte payloads) and confirm TPKTLOSS remains constant, or instrument the test with an independent 32-bit counter or NIC hardware drop counters; any non-recoverable loss in steady state would falsify the zero-loss claim.
Extended reading notes
Core claim
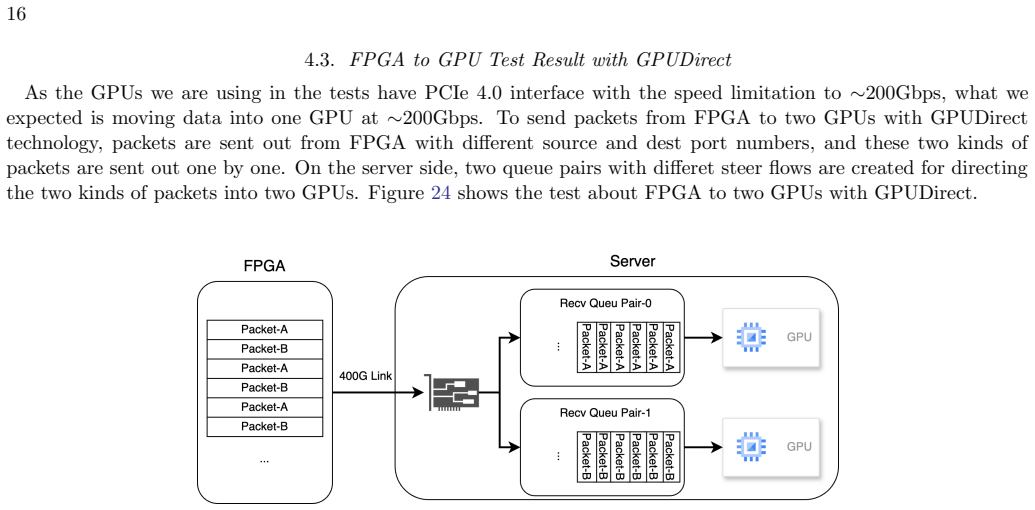
The central discovery is that a complete FPGA-to-GPU data path can sustain 362 Gbps with zero packet loss, matching the best NIC-to-GPU result through DRAM. The authors built an open-source 400GbE wrapper for the AMD/Xilinx DCMAC and GTM transceivers that generates UDP/IPv4 packets at up to the full 400 Gbps link rate, and combined it with a HASHPIPE-based receiver that stages packets in host DRAM before copying to two GPUs. On the same FPGA-to-GPU path with GPUDirect, the throughput is limited by the PCIe 4.0 GPU interface to about 180 Gbps to one GPU and about 90 Gbps per GPU to two. The paper claims this is the same limit reached in server-to-server tests, indicating the bottleneck is the GPU and PCIe receive side, not the FPGA core.
Load-bearing premise
The zero-packet-loss claim rests on a 16-bit sequence counter and on excluding the initialization period during which the total packet-loss counter is non-zero; if wrap-around handling is flawed or the excluded period hides real drops, the 362 Gbps result could be overstated.
Editorial extensions
If this is right
- A single 400GbE link from an FPGA can feed two GPUs at 362 Gbps using host DRAM as staging, so correlators and beamformers can rely on full-rate ingest.
- GPUDirect saturates one GPU at about 180 Gbps but does not scale linearly to two GPUs from one NIC; two NICs are needed for about 276 Gbps total.
- At 362 Gbps with 8192-byte payloads the 16-bit packet sequence counter wraps roughly every 12 ms, so a robust receiver must handle wrap-around to preserve the zero-loss claim.
- The open-source core will be added to the CASPER library, making 400GbE FPGA-to-GPU streaming reusable for other telescope backends and reducing development cost for new instruments.
Reading between the lines
- If the same receive path were paired with a wider sequence counter or independent NIC hardware counters, the true zero-loss ceiling could be verified without relying on one 16-bit counter and an excluded initialization period.
- The DRAM-staging route's advantage over GPUDirect for multiple GPUs suggests that host-memory staging may remain the more scalable ingest pattern for future 800GbE or multi-NIC systems.
- Radio arrays with per-antenna rates below 362 Gbps could consolidate an entire backend onto one FPGA plus a few GPUs, a design choice the paper does not explicitly cost out.
- The technique likely transfers to other high-throughput scientific instruments wherever UDP streams arrive at servers, such as pulsar search, beamforming, and fast transient detection pipelines.
Editorial analysis
A structured set of objections, weighed in public.
Referee Report
Summary. The paper describes the development and testing of an open-source UDP/IPv4 400GbE FPGA core (based on AMD/Xilinx Versal hardware) for streaming data from FPGAs to servers and GPUs in radio astronomy. The authors benchmark two receive-side data paths: RDMA through host DRAM to two GPUs, and GPUDirect RDMA to one or two GPUs. They report that the DRAM-staged path sustains approximately 360 Gbps (362 Gbps in the FPGA-to-GPU configuration) without packet loss, while GPUDirect achieves about 180 Gbps to one GPU and about 90 Gbps per GPU to two GPUs. The paper also reports memory and PCIe bandwidth verification using standard tools, and it makes the core and associated software available as open source for the CASPER library.
Significance. If the reported performance holds, the open-source 400GbE core and the DRAM-staged receive path are a useful contribution to the CASPER ecosystem and to radio-astronomy backend design, potentially reducing the number of GPUs and servers required for real-time processing. The paper includes several good practices: cross-checking GPU PCIe bandwidth with NVIDIA's nvbandwidth, verifying memory bandwidth with Intel PCM and stress-ng, and providing public code repositories. The measurements are internally consistent, and I found no fitted parameters or circular derivations. However, the central zero-packet-loss claim is currently overstated: the paper's own diagnostic (TPKTLOSS) shows non-zero loss during initialization, and the 16-bit sequence counter is blind to certain loss patterns. These issues are fixable, so the contribution remains valuable, but the manuscript needs revision before the central claim is reliable.
major comments (4)
- [Section 4.2 / Figure 23 / Section 5] The unqualified claim that 'data rates of 362 Gbps were transferred without experiencing any packet loss' is not supported by the paper's own evidence. Figure 23's caption explicitly states that TPKTLOSS is non-zero during initialization and only becomes constant afterward, so the measured result is 'no loss in steady state after initialization,' not 'no loss during the entire transfer.' In addition, the 16-bit per-packet sequence counter cannot detect losses that are exact multiples of 65536 packets: if l packets are lost, the receiver-observed delta equals 1 whenever l mod 65536 = 0. At 362 Gbps with 8192-byte payloads, 65536 packets correspond to roughly 11.9 ms of traffic, so a complete outage of that duration or any multiple would be invisible to the loss check. The paper does not describe the receiver's wrap-around handling, the test duration, the number of trials, or any independent loss verification such as NIC hardware drop counters. The zero-loss conclusion therefore rests on an insecure measurement assumption and should be re-stated as 'no detected loss in the steady-state interval' with the counter width, wrap handling, and test duration reported.
- [Section 3.2 / Figure 9] The same initialization-period issue applies to the NIC-to-DRAM-to-GPU test that reports 'about 360 Gbps without packet loss.' The caption of Figure 9 states that TPKTLOSS is non-zero during initialization, so the reported zero-loss condition again refers only to steady state. The paper should quantify the number of packets lost during initialization, specify when the steady-state measurement begins, and explain whether those initialization losses are inherent to the test setup or to the receive framework. Without this information, the reader cannot distinguish a genuine steady-state capability from a measurement that simply excludes losses from the reported interval.
- [Sections 3.3–3.5 and 4.3] All throughput values are single-point measurements: the paper reports '178 Gbps', '~90 Gbps × 2', '~138 Gbps × 2', and '~180 Gbps' without error bars, trial counts, or any indication of run-to-run variance. This is especially important in Section 3.5, where the difference between the single-NIC GPUDirect result (~180 Gbps total) and the dual-NIC result (~276 Gbps total) is attributed to 'GPUDirect configuration and PCIe lanes available in the case of a single NIC.' That attribution is speculative without repeated measurements or a direct comparison of the PCIe topology, and the current single-point data do not allow the reader to assess whether the difference is significant. The paper should report the number of trials, the mean and spread of each rate, and the conditions under which each maximum was obtained.
- [Section 4.2] The sentence 'This result is identical as we obtained in Section 3.2' is imprecise and potentially misleading. Section 3.2 reports ~360 Gbps for the NIC-to-DRAM-to-GPU path, while Section 4.2 reports ~362 Gbps for the FPGA-to-NIC-to-DRAM-to-GPU path, and the two tests use different packet generators and different transmission sources. If the ~362 Gbps limit is set by the server-side receive path or by the HASHPIPE framework rather than by the FPGA core, the paper should state this explicitly; as written, the claim of identity obscures whether the bottleneck is the FPGA transmitter or the receiving system.
minor comments (5)
- [Section 4.3] There is a typo in 'differet steer flows' (should be 'different').
- [Tables 1 and 2] The tables have broken formatting: 'T able 1' and 'V ersion' appear with stray spaces, and Table 2 lists bandwidth in GB/s while the surrounding text uses Gbps. The authors should ensure consistent units and correct table rendering.
- [Section 2.2] The text states that PCIe 4.0 limits throughput to 200 Gbps, but Table 2 lists PCIe 4.0 x16 unidirectional bandwidth as 31.5 GB/s, which is 252 Gbps. The paper should reconcile this discrepancy and clarify whether the 200 Gbps figure refers to the effective payload bandwidth observed on the GPUs.
- [Figure 25 caption] The caption reads 'GPUDirect from FPGA to NIC results,' but the described test is from FPGA through the NIC to GPUs; the caption should be corrected to avoid confusion about the data path.
- [Section 4.2] The paper does not state the packet payload size used in the FPGA-to-GPU test; Section 3.3 mentions 8192-byte payloads for the server-to-server test, but it is not clear whether the same size was used in the FPGA tests. Reporting the packet size is necessary for reproducing the loss-detection wrap calculation and for interpreting the achieved line-rate fraction.
Circularity Check
No circularity: the throughput and loss results are measured end-to-end against independent hardware counters and sequence checks, not derived from fitted inputs or self-citations.
full rationale
This paper is an experimental hardware evaluation with no fitted parameters, no derivation chain, and no predictive model whose output is built from its own inputs. The central results—362 Gbps through DRAM staging, ~180 Gbps per GPU with GPUDirect, and the FPGA-to-GPU rates—are measured quantities obtained by sending packets with sequence counters and comparing sent versus received counts. The paper's use of the CASPER 100G core as a starting point for the 400GbE core is an engineering reuse, not a load-bearing self-citation: the 400GbE core's reported performance is verified by the server-side NIC state, the HASHPIPE status buffer, and the ibverbs completion counters, all external to the paper's own assumptions. The authors' references to their own repositories provide the test code but do not define the measured outcomes. Sections 3.2, 3.3, 4.2, and 4.3 describe direct measurements of packet loss and throughput in a live link, and the paper explicitly reports limitations such as non-zero TPKTLOSS during initialization and PCIe 4.0 bottlenecks. Any concern about the 16-bit sequence counter's inability to detect losses that are exact multiples of 65536 packets, or about the exclusion of the initialization period, is a measurement-validity critique, not a circularity: the claim is not forced by the paper's definitions or by a fitted parameter renamed as a prediction. Per the review rules, such correctness concerns belong outside the circularity score, and no circular step can be exhibited by quoting an equation that reduces to itself. The honest finding is therefore no significant circularity, score 0.
Assumptions & free parameters
assumptions (3)
- domain assumption AMD/Xilinx DCMAC hard IP and GTM transceivers implement IEEE 802.3ck-2022 400GBASE-CR4 correctly as configured.
- domain assumption The measured PCIe and memory bandwidths are representative of the system limits used to interpret the streaming results.
- domain assumption The HASHPIPE software correctly counts packets and the 16-bit counter with wrap handling detects all losses.
Cite this review
Pith. "Pith review of A 400Gbit Ethernet core enabling High Data Rate Streaming from FPGAs to Servers and GPUs in Radio Astronomy." pith.science (2026). https://pith.science/paper/OOLHMANY
@misc{pith2026241115630,
  author       = {Pith},
  title        = {Pith review of: A 400Gbit Ethernet core enabling High Data Rate Streaming from FPGAs to Servers and GPUs in Radio Astronomy},
  year         = {2026},
  howpublished = {\url{https://pith.science/paper/OOLHMANY}},
  note         = {Machine review of arXiv:2411.15630}
}
read the original abstract
The increased bandwidth coupled with the large numbers of antennas of several new radio telescope arrays has resulted in an exponential increase in the amount of data that needs to be recorded and processed. In many cases, it is necessary to process this data in real time, as the raw data volumes are too high to be recorded and stored. Due to the ability of graphics processing units (GPUs) to process data in parallel, GPUs are increasingly used for data-intensive tasks. In most radio astronomy digital instrumentation (e.g. correlators for spectral imaging, beamforming, pulsar, fast radio burst and SETI searching), the processing power of modern GPUs is limited by the input/output data rate, not by the GPU's computation ability. Techniques for streaming ultra-high-rate data to GPUs, such as those described in this paper, reduce the number of GPUs and servers needed, and make significant reductions in the cost, power consumption, size, and complexity of GPU based radio astronomy backends. In this research, we developed and tested several different techniques to stream data from network interface cards (NICs) to GPUs. We also developed an open-source UDP/IPv4 400GbE wrapper for the AMD/Xilinx IP demonstrating high-speed data stream transfer from a field programmable gate array (FPGA) to GPU.
Figures


Figures from the paper (22 more)





Reference graph
Works this paper leans on
-
[1]
Ad´ amek, K., Novotn` y, J., Thiyagalingam, J., & Armour, W. 2021, IEEE Access, 9, 18167
work page 2021
-
[2]
2020, Monthly Notices of the Royal Astronomical Society, 497, 352
Agarwal, D., Lorimer, D., Surnis, M., et al. 2020, Monthly Notices of the Royal Astronomical Society, 497, 352
work page 2020
-
[3]
2017, Astronomy and computing, 18, 35
Akeret, J., Chang, C., Lucchi, A., & Refregier, A. 2017, Astronomy and computing, 18, 35
work page 2017
- [4]
-
[5]
Ayala, A., Tomov, S., Luszczek, P., et al. 2022, Univ. Tennessee at Knoxville, Knoxville, TN, USA, Tech. Rep. ICL-UT-22–02
work page 2022
-
[6]
Brown, R. L., Wild, W., & Cunningham, C. 2004, Advances in Space Research, 34, 555
work page 2004
-
[7]
2000, Implementation, and Signal Processing, NRC-EVLA Memo, 1
Carlson, B. 2000, Implementation, and Signal Processing, NRC-EVLA Memo, 1
work page 2000
-
[8]
Clark, M. A., Plante, P. L., & Greenhill, L. J. 2013, The International journal of high performance computing applications, 27, 178
work page 2013
Show all 21 references
-
[9]
L., Ravi, V., & Hallinan, G
Connor, L., Bouman, K. L., Ravi, V., & Hallinan, G. 2022, Monthly Notices of the Royal Astronomical Society, 514, 2614
2022
-
[10]
E., Hall, P
Dewdney, P. E., Hall, P. J., Schilizzi, R. T., & Lazio, T. J. L. 2009, Proceedings of the IEEE, 97, 1482
2009
-
[11]
2019, arXiv preprint arXiv:1907.07648
Hallinan, G., Ravi, V., Weinreb, S., et al. 2019, arXiv preprint arXiv:1907.07648
2019 arXiv
-
[12]
2016, Journal of Astronomical Instrumentation, 5, 1641001
Hickish, J., Abdurashidova, Z., Ali, Z., et al. 2016, Journal of Astronomical Instrumentation, 5, 1641001
2016
-
[13]
2020, Publications of the Astronomical Society of the Pacific, 132, 085001
Jiang, H., Yu, C.-Y., Chen, M., & Liu, M. 2020, Publications of the Astronomical Society of the Pacific, 132, 085001
2020
-
[14]
2016, in MeerKAT Science: On the Pathway to the SKA, 1, doi: 10.22323/1.277.0001
Jonas, J., & MeerKAT Team. 2016, in MeerKAT Science: On the Pathway to the SKA, 1, doi: 10.22323/1.277.0001
2016 doi
-
[15]
Kalia, A., Kaminsky, M., & Andersen, D. G. 2016, in 2016 USENIX Annual Technical Conference (USENIX ATC 16), 437–450
2016
-
[16]
L., Chen, J., et al
Li, A., Song, S. L., Chen, J., et al. 2019, IEEE Transactions on Parallel and Distributed Systems, 31, 94
2019
-
[17]
2021, Journal of Instrumentation, 16, P08047
Liu, W., Meng, Q., Wang, C., et al. 2021, Journal of Instrumentation, 16, P08047
2021
-
[18]
H., Price, D
MacMahon, D. H., Price, D. C., Lebofsky, M., et al. 2018, Publications of the Astronomical Society of the Pacific, 130, 044502
2018
-
[19]
Romein, J. W. 2021, Astronomy & Astrophysics, 656, A52 18
2021
-
[20]
2007, SKA Memorandum, 100
Schilizzi, R., Alexander, P., Cordes, J., et al. 2007, SKA Memorandum, 100
2007
-
[21]
2024, Research in Astronomy and Astrophysics
Yu, Z., Deng, F., Sun, S., et al. 2024, Research in Astronomy and Astrophysics
2024
Reviewed August 12, 2026 · model on record in the stance chip above.
Discussion (0). Continue with ORCID to comment.