REVIEW 4 major objections 5 minor 11 references
Peritumoral Expansion Radiomics for Improved Lung Cancer Classification
T0 review · 4 major / 5 minor · reviewed 2026-08-12 · deepseek-v4-flash
Pith's one-line read Adding an 8 mm shell of tissue around a segmented lung nodule improves radiomics-based cancer classification to an AUC of 0.78, beating the deep-learning baselines compared in the study.
desk verdict Useful exploratory benchmark on a public dataset, but the 8 mm claim is post hoc and the statistics don't back the word 'significant'. read the letter →
The pith
A machine-rendered reading of the paper's core claim, the machinery that carries it, and where it could break.
The reading
What carries the argument
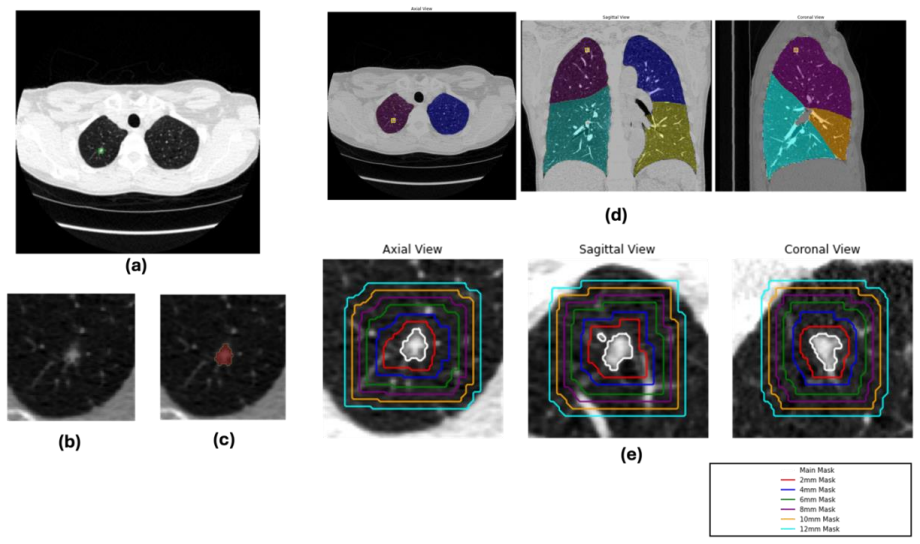
Peritumoral expansion is the mechanism: a 3D nodule mask, produced here by K-nearest-neighbors voxel clustering, is dilated outward by fixed distances of 2, 4, 6, 8, 10, and 12 mm; radiomics intensity, texture, and shape features are re-extracted from each dilated mask; and a logistic regression classifier converts them into a cancer score. The expansion isolates the contribution of the surrounding shell because the segmentation and feature set stay fixed while only the shell thickness changes, while the KNN segmentation is what defines the boundary the shells grow from. The 8 mm shell is the paper's preferred operating point.
What would settle it
Run the same KNN-segmentation and logistic-regression pipeline on an independent external lung CT dataset with the expansion fixed at 8 mm, and compare against nodule-only features with a permutation test over expansion distances; if the 8 mm AUC gain is within the chance distribution of best-of-six distances, or the confidence intervals still overlap, the central claim would be unsupported.
Extended reading notes
Core claim
The central discovery is that radiomics features extracted from a nodule plus a surrounding peritumoral shell classify lung cancer better than features from the nodule alone, and the gain grows with shell thickness up to 8 mm before reversing. In the validation set, nodule-only KNN segmentation with logistic regression gives AUC 0.73 (95% CI 0.63–0.82); expanding by 4, 6, and 8 mm yields 0.75 (0.64–0.85), 0.77 (0.68–0.86), and 0.78 (0.69–0.87), while 12 mm drops to 0.70 (0.58–0.81). The best radiomics configuration outperforms the deep-learning image baselines, whose top AUC is 0.71, and the author attributes the improvement to tumor-microenvironment characteristics captured in the 8 mm shell, with further expansion introducing noise. This is presented as evidence that contextual tissue information, systematically harvested, is more useful for this classification task than the patch-level deep features that dominated the comparison baselines.
Load-bearing premise
The load-bearing premise is that the improvement from adding an 8 mm shell (AUC 0.78 vs 0.73 for the nodule alone) is a genuine biological signal rather than the result of testing six expansion distances and reporting the best one, since the 95% confidence intervals overlap and no significance test or multiple-comparison correction is provided.
Editorial extensions
If this is right
- Radiomics pipelines for lung nodule classification should include a peritumoral shell, with 8 mm as the default thickness.
- The expansion distance behaves like a signal-to-noise dial: performance rises to 8 mm and falls at 12 mm, so distance should be tuned rather than assumed.
- A simple, interpretable radiomics model can match or beat deep-learning patch classifiers on the same benchmark, making it a viable baseline and a candidate for clinical deployment where interpretability matters.
- Segmentation quality matters: KNN segmentation paired with logistic regression gave the highest validation AUC (0.89) before expansion, so segmentation choice is a driver of radiomics performance.
Reading between the lines
- Editorial inference: the 8 mm optimum is likely dataset- and nodule-size-dependent; a fixed shell may under- or over-sample for very small or very large nodules, so an adaptive shell size is a plausible next experiment.
- Editorial inference: because the reported confidence intervals for nodule-only and 8 mm AUC overlap, and the best distance was chosen from six candidates, a permutation or multiple-comparison correction could show the 8 mm advantage is smaller than it appears.
- Editorial inference: a natural testable extension is to concatenate peritumoral radiomics features with deep-learning embeddings from a foundation-model feature extractor; if the two signal sources are complementary, the combined model should exceed both.
- Editorial inference: the decline beyond 8 mm hints that peritumoral signal is concentrated in a limited shell; mapping where the information lives (e.g., by 1 mm increments or by anatomic compartment) could sharpen the finding and guide feature selection.
Editorial analysis
A structured set of objections, weighed in public.
Referee Report
Summary. The manuscript evaluates four 3D segmentation methods (Otsu, Fuzzy C-Means, Gaussian Mixture Model, K-Nearest Neighbors) and three classifiers (Random Forest, Logistic Regression, KNN) for radiomics-based lung nodule classification on the Duke Lung Cancer Screening Dataset. It reports that KNN segmentation with Logistic Regression performs best on the validation set (AUC 0.89), and that expanding the segmentation into peritumoral regions improves validation AUC from 0.73 (nodule only) to 0.78 at 8 mm, with some decline at larger expansion distances. The authors compare these results with deep learning baselines from prior work (FMCB, ResNet50-SWS++, Genesis, MedNet3D) and conclude that radiomics with peritumoral expansion outperforms them.
Significance. If properly validated, the hypothesis that peritumoral expansion up to a specific distance adds incremental diagnostic information is valuable for radiomics pipeline design and for interpreting tumor microenvironment effects in CT-based classification. The study uses a public dataset and PyRadiomics, and the multi-segmentation and multi-classifier comparison is a useful contribution. The main limitation is statistical: the central claim rests on a post hoc selected expansion distance, overlapping confidence intervals, and the absence of significance testing or independent test-set confirmation. As presented, the evidence does not establish that the observed AUC difference is real rather than chance variation. The deep-learning comparison is also weakened by reliance on previously published numbers without re-running baselines in the same pipeline.
major comments (4)
- [Analysis of Peritumoral Expansion on Classification Performance] The claim that incorporating peritumoral regions "significantly enhanced" performance is not supported by the reported statistics. The 95% confidence intervals for nodule-only AUC (0.63-0.82) and 8 mm expansion AUC (0.69-0.87) overlap substantially, and no significance test (e.g., DeLong or bootstrap) is provided. Moreover, the 8 mm result was selected post hoc after evaluating six expansion distances on the same validation data; without multiple-comparison correction or a pre-specified hypothesis, the reported improvement is consistent with selection over expansion distances.
- [Results & Discussion, Table 2] There is a numerical inconsistency that needs explanation: Table 2 reports a validation AUC of 0.89 for Logistic Regression with KNN segmentation, while the peritumoral analysis reports an AUC of 0.73 for the original nodule segmentation using the same combination. The manuscript does not clarify whether the two analyses use different feature sets, sample sizes, or preprocessing. This discrepancy undermines the reader's ability to interpret the expansion effect and should be resolved before the central claim can be assessed.
- [Peritumoral Expansion and Figure 3] Figure 3 is captioned "training and testing results of Logistic Regression with expanded segmentation," but the text reports no numeric test-set AUCs for the peritumoral expansion distances. Since the dataset was split into training, validation, and testing sets, and since the 8 mm distance was selected on the validation set, the authors must report the test-set AUC for the pre-specified 8 mm expansion (and ideally for all expansion distances) to demonstrate that the selected distance was not an artifact of validation-set overfitting. Without this, the central claim is not independently confirmed.
- [Comparison with Deep Learning Models] The deep-learning comparison is based on AUC values taken from prior publications rather than models re-run under the same protocol in this study. The confidence intervals for the compared methods overlap (e.g., 8 mm radiomics AUC 0.69-0.87 vs. ResNet50-SWS++ 0.61-0.81 and FMCB 0.60-0.82), so the statement that the radiomics approach demonstrates "superior classification accuracy" is not supported by the reported numbers. Re-running the baselines on the same data split or restricting the claim to descriptive observations would be necessary.
minor comments (5)
- [Abstract and Methods] The word "radionics" appears in the abstract and methods and should be corrected to "radiomics."
- [Analysis of Peritumoral Expansion on Classification Performance] The text refers to "fig. 2(b)" but no Figure 2 appears in the manuscript; the reference should be corrected or the figure added.
- [Figure 4] The caption states that error bars indicate 95% confidence intervals for each model, but confidence intervals are not reported in the text or table for all deep learning models (e.g., Genesis and MedNet3D only have point AUCs).
- [Dataset and Code Availability] The code availability statement says the code "will be openly available" rather than providing a permanent repository link or DOI; if the code is intended to support reproducibility, a stable link should be provided.
- [Table 1] Minor formatting issues include a stray percent sign in the "Malignant" row and inconsistent use of decimal places across percentage values; these should be cleaned up.
Circularity Check
The '8 mm is best' result is the selected maximum of the validation curve, not an independent prediction.
-
fitted input called prediction
[Abstract; Methods 'Peritumoral Expansion'; Results 'Analysis of Peritumoral Expansion on Classification Performance']
"Incorporating peritumoral regions significantly enhanced performance, with the best result obtained at 8 mm expansion (AUC = 0.78). ... The best-performing segmentation (KNN) and model (Logistic regression) were further analyzed by expanding the initial nodule segmentation into the peritumoral region (2, 4, 6, 8, 10, and 12 mm) ... while 6 mm and 8 mm expansions yielded the highest performance with AUCs of 0.77 (0.68–0.86) and 0.78 (0.69–0.87), respectively."
The 8 mm expansion distance is not derived from an independent hypothesis; it is the candidate that achieved the highest validation AUC among the six distances tested on the same data. Reporting '8 mm' as the best-performing expansion and concluding that peritumoral tissue up to 8 mm 'provides critical diagnostic information' is therefore a restatement of the argmax of the measured validation curve, not an out-of-sample prediction. The overlapping 95% CIs (nodule-only 0.63–0.82; 8 mm 0.69–0.87) and the absence of a significance test or multiple-comparison correction mean the paper's 'significantly enhanced' claim is not distinguished from chance selection over the six distances. The headline result is forced by the selection procedure rather than independently confirmed.
full rationale
The radiomics pipeline itself—segmentation via Otsu/FCM/GMM/KNN, PyRadiomics feature extraction, and standard classifiers—is methodologically self-contained and does not reduce to its inputs. There is no self-definitional circularity in the feature extraction or classification steps. The one load-bearing circular element is the peritumoral expansion distance: the paper evaluated six distances on the same data and selected the one with the highest validation AUC as the headline '8 mm' result. The conclusion that peritumoral regions up to 8 mm provide critical diagnostic information is a restatement of that selection, not an independent prediction. The deep-learning comparisons are imported from prior work [4, 6], and the reliance on a same-author baseline is a reproducibility concern, but the peritumoral expansion claim stands independently of that comparison. The overlapping confidence intervals and lack of significance testing add a statistical-correctness risk beyond the selection circularity. Overall, one central result is partially circular by construction, so a score of 6 is appropriate.
Assumptions & free parameters
free parameters (3)
- Peritumoral expansion distance =
8 mm (AUC 0.78)
- KNN segmentation parameters =
not reported
- Classifier hyperparameters =
not reported
assumptions (5)
- domain assumption The Duke Lung Cancer Screening Dataset labels (cancer/no cancer) are accurate and reflect verified diagnostic outcomes.
- domain assumption Radiomics features from expanded masks capture biologically relevant peritumoral information rather than unrelated anatomy or noise.
- domain assumption Deep learning baseline AUCs from references [4] and [6] are directly comparable to the present radiomics pipeline.
- domain assumption The 70/20/10 train/validation/test split prevents leakage between nodules from the same patient.
- standard math The reported 95% confidence intervals for AUC were computed with an appropriate method.
Cite this review
Pith. "Pith review of Peritumoral Expansion Radiomics for Improved Lung Cancer Classification." pith.science (2026). https://pith.science/paper/MZ4NZOEL
@misc{pith2026241116008,
  author       = {Pith},
  title        = {Pith review of: Peritumoral Expansion Radiomics for Improved Lung Cancer Classification},
  year         = {2026},
  howpublished = {\url{https://pith.science/paper/MZ4NZOEL}},
  note         = {Machine review of arXiv:2411.16008}
}
read the original abstract
Purpose: This study investigated how nodule segmentation and surrounding peritumoral regions influence radionics-based lung cancer classification. Methods: Using 3D CT scans with bounding box annotated nodules, we generated 3D segmentations using four techniques: Otsu, Fuzzy C-Means (FCM), Gaussian Mixture Model (GMM), and K-Nearest Neighbors (KNN). Radiomics features were extracted using the PyRadiomics library, and multiple machine-learning-based classifiers, including Random Forest, Logistic Regression, and KNN, were employed to classify nodules as cancerous or non-cancerous. The best-performing segmentation and model were further analyzed by expanding the initial nodule segmentation into the peritumoral region (2, 4, 6, 8, 10, and 12 mm) to understand the influence of the surrounding area on classification. Additionally, we compared our results to deep learning-based feature extractors Foundation Model for Cancer Biomarkers (FMCB) and other state-of-the-art baseline models. Results: Incorporating peritumoral regions significantly enhanced performance, with the best result obtained at 8 mm expansion (AUC = 0.78). Compared to image-based deep learning models, such as FMCB (AUC = 0.71) and ResNet50-SWS++ (AUC = 0.71), our radiomics-based approach demonstrated superior classification accuracy. Conclusion: The study highlights the importance of peritumoral expansion in improving lung cancer classification using radiomics. These findings can inform the development of more robust AI-driven diagnostic tools.
Figures

Reference graph
Works this paper leans on
-
[1]
Reduced Lung -Cancer Mortality with Low -Dose Computed Tomographic Screening,
"Reduced Lung -Cancer Mortality with Low -Dose Computed Tomographic Screening," New England Journal of Medicine, vol. 365, no. 5, pp. 395-409, 2011, doi: 10.1056/nejmoa1102873
-
[3]
Reduced Lung-Cancer Mortality with Volume CT Screening in a Randomized Trial,
H. J. De Koning et al., "Reduced Lung-Cancer Mortality with Volume CT Screening in a Randomized Trial," New England Journal of Medicine, vol. 382, no. 6, pp. 503 -513, 2020, doi: 10.1056/nejmoa1911793
-
[4]
AI in Lung Health: Benchmarking Detection and Diagnostic Models Across Multiple CT Scan Datasets,
F. I. Tushar et al. , "AI in Lung Health: Benchmarking Detection and Diagnostic Models Across Multiple CT Scan Datasets," arXiv preprint arXiv:2405.04605, 2024
arXiv 2024
-
[5]
P. G. Mikhael et al., "Sybil: A Validated Deep Learning Model to Predict Future Lung Cancer Risk From a Single Low-Dose Chest Computed Tomography," Journal of Clinical Oncology, vol. 41, no. 12, pp. 2191-2200, 2023, doi: 10.1200/jco.22.01345
-
[6]
Foundation model for cancer imaging biomarkers,
S. Pai et al., "Foundation model for cancer imaging biomarkers," Nature machine intelligence, pp. 1-14, 2024
work page 2024
-
[7]
VLST: Virtual Lung Screening Trial for Lung Cancer Detection Using Virtual Imaging Trial,
F. I. Tushar et al. , "VLST: Virtual Lung Screening Trial for Lung Cancer Detection Using Virtual Imaging Trial," arXiv preprint arXiv:2404.11221, 2024
arXiv 2024
-
[8]
R. C. Gonzalez, Digital image processing. Pearson education india, 2009
work page 2009
-
[9]
Computational radiomics system to decode the radiographic phenotype,
J. J. Van Griethuysen et al. , "Computational radiomics system to decode the radiographic phenotype," Cancer research, vol. 77, no. 21, pp. e104-e107, 2017
work page 2017
Show all 11 references
-
[10]
Random forest,
S. J. Rigatti, "Random forest," Journal of Insurance Medicine, vol. 47, no. 1, pp. 31-39, 2017
2017
-
[11]
Understanding logistic regression analysis,
S. Sperandei, "Understanding logistic regression analysis," Biochemia medica, vol. 24, no. 1, pp. 12-18, 2014
2014
-
[12]
pROC: an open-source package for R and S+ to analyze and compare ROC curves,
X. Robin et al., "pROC: an open-source package for R and S+ to analyze and compare ROC curves," BMC Bioinformatics, vol. 12, no. 1, p. 77, 2011/03/17 2011, doi: /10.1186/1471-2105-12-77
2011 doi
Reviewed August 12, 2026 · model on record in the stance chip above.
Discussion (0). Continue with ORCID to comment.