REVIEW 3 major objections 6 minor 52 references
Minimum Entropy Indicator for Evaluating Dispersion Measure
T0 review · 3 major / 6 minor · reviewed 2026-08-12 · deepseek-v4-flash
Pith's one-line read A minimum-Shannon-entropy scan over trial dispersion measures picks the profile closest to the true one; on 48 FAST pulsars it matches published DMs within 0.5% for all but three (which match older references).
desk verdict Entropy-minimization as a DM indicator works reasonably on 48 FAST pulsars, but without a baseline or sensitivity run the agreement isn't yet shown to come from the entropy criterion. read the letter →
The pith
A machine-rendered reading of the paper's core claim, the machinery that carries it, and where it could break.
The reading
What carries the argument
The load-bearing object is the entropy functional $H(X)=-\sum_{i=1}^{n} p(x_i)\log_2 p(x_i)$, where $x_i$ is a short time interval of the candidate pulse profile and $p(x_i)$ is the fraction of the total flux received in that interval. Minimizing this functional over trial dispersion measures is the whole algorithm: it replaces template fitting with a pure concentration score. Two auxiliary procedures carry the practical argument: the 3-$\sigma$ retention of data points and the three-segment interference-removal routine that the paper assumes leaves true pulse signals intact, and the error strategy that smooths the entropy-DM curve and takes the 3-$\sigma$ band around the minimum as the DM uncertainty.
What would settle it
Inject a synthetic dispersed pulse with a known DM whose true profile has a low-amplitude broad component below the 3-sigma cutoff: if the entropy-DM minimum moves away from the injected DM by more than the quoted error when that weak component is present, and does not move when the component is removed, the preprocessing assumption is falsified.
Extended reading notes
Core claim
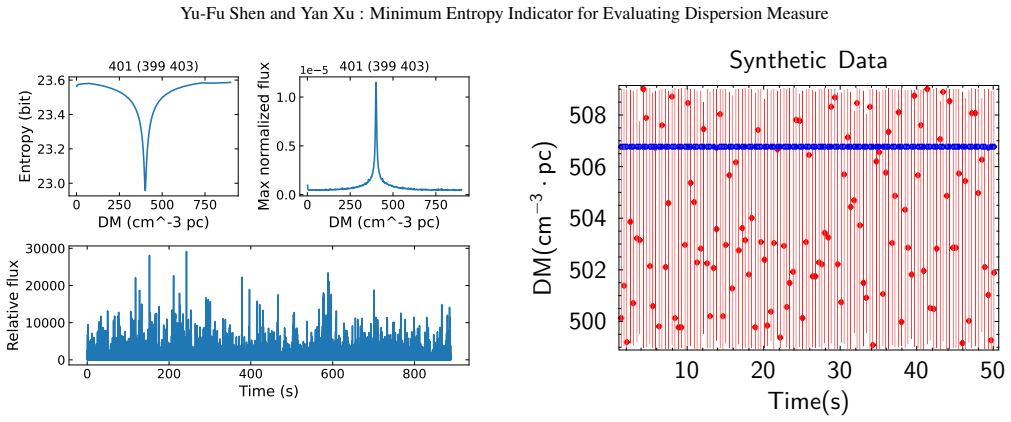
The central claim is that within a fixed time window, the flux distribution of a dedispersed pulse profile with minimum Shannon entropy is the distribution closest to the true profile, and the dispersion measure that produces it is the optimal DM. Concretely, for each trial DM the data are shifted by the frequency-dependent delay of Equation (1), binned in time, normalized to a probability distribution, and scored by $H=-\sum_i p_i\log_2 p_i$. The DM that minimizes $H$ is taken as the measured DM, with an error range read off from the entropy-versus-DM curve using a 3-$\sigma$ smoothed-residual rule. The validation on 48 FAST pulsars compares these entropy DMs against the latest references: 45 are within 0.5%, and the 3 remaining pulsars match older references, which the paper interprets as consistency with published DM values once reference-systematic differences are allowed.
Load-bearing premise
The method computes entropy only from data points that survive a 3-sigma cut and a three-segment interference-removal routine, on the assumption that the true pulse stays intact through both; if part of a real pulse lies below the threshold or gets clipped as interference, the entropy minimum can shift to the wrong dispersion measure.
Editorial extensions
If this is right
- Dispersion measurement becomes a template-free search: the DM that concentrates the pulse profile into the fewest flux bins is selected without assuming any pulse shape, sidestepping the fitting bias the paper identifies.
- Because the entropy scan is computed separately on each pulse, per-pulse DMs and error bars follow naturally, allowing studies of DM variability without first building a high-S/N template.
- The method is computationally cheap enough to supply initial DM estimates and pre-input parameters for more detailed single-pulse analysis, as demonstrated by the coarse-to-fine search in Section 2.2.
- On the 48-pulsar FAST sample, a correct minimum-entropy rule predicts that entropy DMs will continue to agree with independently measured DMs, with residual outliers tracing reference-systematic differences rather than method failure.
Reading between the lines
- Editorial inference: the minimum-entropy score is essentially a sharpness or concentration measure, so it should behave much like structure-maximization dedispersion used in fast radio burst work; a direct comparison of min-entropy DM with structure-maximized DM on FRB data would be a natural test the paper does not run.
- Editorial inference: since only 3-sigma-surviving samples enter the entropy, the indicator measures the bright core of the pulse, not its low-level wings; if scattering broadens a profile or a genuine component sits below threshold, the entropy minimum may drift, and a soft-threshold variant is the obvious check.
- Editorial inference: the three outliers matching older references hint that published DMs carry their own processing systematics, so catalog agreement is a weak ground truth; a stronger validation would use simulated pulses with exactly known DM and scattering to map where the min-entropy estimator breaks down.
Editorial analysis
A structured set of objections, weighed in public.
Referee Report
Summary. The paper proposes a template-free, entropy-based dispersion measure (DM) estimator: for a given trial DM, the dedispersed time series is binned into a flux profile, its Shannon entropy is computed, and the DM that minimizes this entropy is taken as the optimal DM. The authors argue that the minimum-entropy profile is closest to the true pulse profile and thus yields the correct DM. They apply the method to 48 pulsars observed with FAST, reporting that all but three entropy DMs differ from catalog reference DMs by less than 0.5%, and that the three outliers agree with older references. A synthetic-data test and an example code are included.
Significance. If the empirical agreement is robust, the paper offers a computationally cheap, template-free DM indicator that could complement existing fitting and profile-discrimination methods, particularly for studying single-pulse profiles and FRBs. The validation is against independent catalog DMs (not fitted to them), and the paper ships example code and a synthetic-data sanity check, which are genuine strengths. However, the central claim currently depends on several ad hoc preprocessing steps whose influence has not been quantified, so the significance is conditional on a sensitivity analysis.
major comments (3)
- [§2.1 and Appendix A] The preprocessing is load-bearing: the entropy is computed only on data points surviving the 3-sigma cutoff (`allH['snr']>1+3*sig` in the code), and the three-segment interference-removal procedure is described only in prose, with the code leaving a placeholder ('add your function here'). Every entropy value is therefore evaluated on a truncated, threshold-selected subset of the flux distribution, not on the full pulse profile. If real pulses contain low-amplitude wings, scattering tails, or other components below the threshold, those samples are silently discarded and the minimum-entropy DM could shift. The paper provides no sensitivity analysis varying the threshold (e.g., 1, 2, 5 sigma, or no cut), the interference-removal logic, the phase offset, or the smoothing window. Without such a test, the agreement in Table 1 is not yet shown to be a property of the entropy indicator itself rather than of the preprocessing choices. Please add a sensitivity study, or at minimum report the fraction of data points retained by the 3-sigma cutoff per pulsar and demonstrate that the derived DM is stable under reasonable variations of these parameters.
- [§2.4 and Table 1] The headline result is that 45 of 48 entropy DMs agree with reference DMs within 0.5%, but the comparison does not use the stated error bars. Several entropy DMs have uncertainties larger than the 0.5% band (e.g., J1404+1159 with err 2.8 on DM 15.857), and the reference DMs are quoted without their own uncertainties. In addition, the 'weighted average' of per-pulse DMs is not defined: the weights, the number of pulses used, and how outliers are combined are all unspecified. Please provide the per-pulse measurements, the weighting scheme, and the uncertainties, or clearly state that the 0.5% comparison is against the catalog central values only, so the reader can judge whether the differences are statistically significant.
- [§1 and Abstract] The conceptual premise that 'the flux distribution with the minimum entropy (maximum amount of information) is the closest to the real distribution' is asserted rather than derived, and the paper itself concedes in the Abstract and §3 that the criterion cannot be proven optimal. This is acceptable as a heuristic motivation, but the title and the introductory wording claim a direct relationship to the 'true profile.' Because the empirical validation in §2.4 is only against catalog DMs, not against independent measurements of the true pulse profile, I recommend rewording the claims to say that the minimum-entropy DM is a useful estimator that recovers reference DMs for the 48 FAST pulsars studied, and to present the 'closest to the real profile' statement as a motivation rather than a conclusion of the paper.
minor comments (6)
- [Section 3 heading] The heading 'Disscusions and Conclusions' contains a typo and should read 'Discussion and Conclusions.'
- [Figure 2] The caption says 'Using pulsar J1901+0331 as an example,' but the panel title and the surrounding text refer to J1922+1733 with DM=234.0; please correct this mismatch.
- [§2.2] The error-estimation strategy does not specify the width of the smoothing window; the code uses binsize = (max(dms)-min(dms))/20, but this choice is not justified and can change the reported error range.
- [Table 1] For each pulsar, the 'References' column lists two references without indicating which one supplies the quoted reference DM; please split this into two columns or add a note explaining the provenance of each DM value.
- [§2.1] The '3 sigma' threshold is not defined precisely: it should be stated whether sigma is the standard deviation of the full slice, the median-normalized noise estimate used in the code, or another quantity.
- [§1] The sentence 'their are also some pulsars known as millisecond pulsars' contains a grammatical error ('their' should be 'there').
Circularity Check
No significant circularity: min-entropy DMs are validated against independent catalog values, not fitted to them.
full rationale
The paper's derivation chain is: define Shannon entropy over binned pulse flux, scan trial DMs, select the DM that minimizes entropy, and compare the resulting DMs with published catalog values. No parameter is fitted to the reference DMs, and the comparison is made against externally compiled catalogs (e.g., Manchester et al. 2005; Wang et al. 2023), not against values used to construct the indicator. The statement in Section 1 that the minimum-entropy flux distribution is 'closest to the real distribution and corresponds to the optimal DM' is an explicit premise or assumption, not a conclusion derived from the entropy definition; the paper itself repeatedly disclaims optimality ('it cannot be proven to be the optimal criterion'). An unproven premise is a correctness or validation concern, not circularity. The 3-sigma clipping and interference-removal preprocessing in Section 2.1 are fixed choices that could bias the entropy minimum, but they do not make the prediction equivalent to an input or fit to the reference DMs. There is no load-bearing self-citation chain, no imported uniqueness theorem, and no fitted parameter renamed as a prediction. Therefore the central claim is self-contained against external benchmarks and receives a score of 0.
Assumptions & free parameters
free parameters (4)
- 3-sigma flux threshold =
3 (multiple of sigma)
- phase offset =
0.1 x binsize
- error smoothing window =
(maxDM - minDM) / 20
- DM search grid step h =
user-defined (e.g., 2 for coarse, 0.001 for fine)
assumptions (4)
- domain assumption Entropy minimization selects the dedispersion whose flux distribution is closest to the true pulse profile (minimum entropy corresponds to maximum information).
- domain assumption After dedispersion with the correct DM, the intrinsic pulse profile is the most concentrated (lowest entropy) among all trial DMs.
- standard math Radio frequency dispersion follows the cold plasma dispersion relation with v^-2 scaling (Eq. 1).
- ad hoc to paper The data preprocessing (3-sigma retention and interference removal in three segments) preserves the true pulse signal intact.
Cite this review
Pith. "Pith review of Minimum Entropy Indicator for Evaluating Dispersion Measure." pith.science (2026). https://pith.science/paper/VQ6HYRWL
@misc{pith2026241116023,
  author       = {Pith},
  title        = {Pith review of: Minimum Entropy Indicator for Evaluating Dispersion Measure},
  year         = {2026},
  howpublished = {\url{https://pith.science/paper/VQ6HYRWL}},
  note         = {Machine review of arXiv:2411.16023}
}
read the original abstract
Advanced radio telescopes such as the Five-hundred-meter Aperture Spherical radio Telescope (FAST) can provide high-sensitivity and high-time-resolution data of a large number of radio sources, offering an excellent opportunity for studying radio pulse profiles. However, studying pulse profiles requires the analysis of dispersion measurement (DM). The fitting method tends to make the profile conform to the model, so the fitting method is not suitable for pulse profile research. Indicators are needed to determine the profile closest to the real one, which is the profile discrimination method. This work is based on the definition of Shannon's information entropy, and believes that the pulse profile when the entropy is minimized is the closest to the true profile. This indicator is simple to calculate and can provide help for pulse profile research. This work uses real data from 48 pulsars. By calculating the information entropy of the pulsar profiles under different DMs, the DM corresponding to the minimum entropy is found, thus verifying the validity of the minimum entropy indicator. In terms of the analysis results for the 48 pulsars, the differences with the references are less than 0.5\% for all except 3 stars, and the results for these 3 stars are consistent with older references. The minimum entropy indicator can effectively obtain the DMs of radio pulse signals with low computational complexity, but it cannot be proven to be the optimal criterion. It is suggested to use multiple indicators separately when studying pulse profiles. It can be expected that the optimal indicator can provide information on the radiation mechanism of radio sources.
Figures


Reference graph
Works this paper leans on
-
[1]
Lorimer, D. R., Bailes, M., McLaughlin, M. A., et al. 2007, Science, 318,
work page 2007
-
[4]
doi:10.1007/s00159-019-0116-6 Backer, D. C., Kulkarni, S. R., Heiles, C., et al. 1982, Nature, 300,
-
[9]
doi:10.1071/PH790009 Drake, F. D. & Craft, H. D. 1968, Nature, 220,
doi:10.1071/ph790009 1968
-
[12]
doi:10.3847 /1538- 4357/abe62f Donner, J. Y ., Verbiest, J. P. W., Tiburzi, C., et al. 2019, A&A, 624, A22. doi:10.1051/0004-6361/201834059 Tiburzi, C., Verbiest, J. P. W., Shaifullah, G. M., et al. 2019, MNRAS, 487,
-
[23]
doi:10.3847/1538-4365/ad19da Cordes, J. M., Freire, P. C. C., Lorimer, D. R., et al. 2006, ApJ, 637,
-
[29]
doi:10.3847/1538-4357/835/1/29 Thornton, D., Stappers, B., Bailes, M., et al. 2013, Science, 341,
-
[34]
doi:10.3847/1538-4357/aaf6ef Hankins, T. H. 1971, ApJ, 169,
-
[39]
doi:10.1038/physci244084a0 Nice, D. J., Fruchter, A. S., & Taylor, J. H. 1995, ApJ, 449,
Show all 52 references
-
[43]
J., Shrauner, J
doi:10.1038/320043a0 Camilo, F., Nice, D. J., Shrauner, J. A., et al. 1996, ApJ, 469,
1996 doi
-
[44]
doi:10.1111/j.1365-2966.2006.10887.x Hulse, R. A. & Taylor, J. H. 1975, ApJ, 201, L55. doi:10.1086/181941 Hobbs, G., Lyne, A. G., Kramer, M., et al. 2004, MNRAS, 353,
2006
-
[45]
doi:10.1038/s41586-020-2828-1 Petroff, E., Hessels, J. W. T., & Lorimer, D. R. 2019, A&A Rev., 27,
2019 doi
-
[47]
H., Segelstein, D
Stokes, G. H., Segelstein, D. J., Taylor, J. H., et al. 1986, ApJ, 311,
1986
-
[50]
V ., Kondratiev, V
doi:10.1088/0004-637X/772/1/50 Bilous, A. V ., Kondratiev, V . I., Kramer, M., et al. 2016, A&A, 591, A134. doi:10.1051/0004-6361/201527702 McEwen, A. E., Spiewak, R., Swiggum, J. K., et al. 2020, ApJ, 892,
2016 doi
-
[53]
doi:10.1126/science.1236789 Cordes, J. M. & Chatterjee, S. 2019, ARA&A, 57,
2019 doi
-
[64]
2020, The Innovation, 1, 100053
doi:10.1088/1674-4527/20/5/64 Qian, L., Yao, R., Sun, J., et al. 2020, The Innovation, 1, 100053. doi:10.1016/j.xinn.2020.100053 Han, J. L., Wang, C., Wang, P. F., et al. 2021, Research in Astronomy and Astro- physics, 21,
2020
-
[67]
I., Vaughan, A
doi:10.1088/0004-637X/791/1/67 Large, M. I., Vaughan, A. E., & Wielebinski, R. 1968, Nature, 220,
1968 doi
-
[76]
This issue can be avoided by distributing each data point into multiple \ bins based on certain principles
doi:10.3847/1538-4357/ab75e2 Article number, page 6 Yu-Fu Shen and Yan Xu : Minimum Entropy Indicator for Evaluating Dispersion Measure Appendix A: An example code import numpy as np import astropy.io.fits as fits import pandas as pd import matplotlib.pyplot as plt import os i...
- [84]
-
[107]
2022, Science China Physics, Mechanics, and Astronomy, 65, 129702
doi:10.1088/1674-4527/21/5/107 Hong, T., Han, J., Hou, L., et al. 2022, Science China Physics, Mechanics, and Astronomy, 65, 129702. doi:10.1007/s11433-022-2040-8 Hou, L., Han, J., Hong, T., et al. 2022, Science China Physics, Mechanics, and Astronomy, 65, 129703. doi:10.1007/...
2022
-
[123]
B., Edwards, R
doi:10.1086/169393 Hobbs, G. B., Edwards, R. T., & Manchester, R. N. 2006, MNRAS, 369,
2006 doi
-
[129]
2019, Science China Physics, Mechanics, and Astronomy, 62, 959502
doi:10.1007/s11433-006-0129-9 Jiang, P., Yue, Y ., Gan, H., et al. 2019, Science China Physics, Mechanics, and Astronomy, 62, 959502. doi:10.1007/s11433-018-9376-1 Jiang, P., Tang, N.-Y ., Hou, L.-G., et al. 2020, Research in Astronomy and As- trophysics, 20,
2019 doi
-
[156]
S., Cordes, J
doi:10.1086/176041 Deneva, J. S., Cordes, J. M., McLaughlin, M. A., et al. 2009, ApJ, 703,
2009 doi
-
[167]
R., Salter, C
doi:10.1038/225167a0 Bonsignori-Facondi, S. R., Salter, C. J., & Sutton, J. M. 1973, A&A, 27, 67 Manchester, R. N., Hobbs, G. B., Teoh, A., et al. 2005, AJ, 129,
1973 doi
-
[220]
S., McLaughlin, M., Olszanski, T
doi:10.1134/S1063772916020128 Deneva, J. S., McLaughlin, M., Olszanski, T. E. E., et al. 2024, ApJS, 271,
2024 doi
-
[229]
J., Pilkington, J
doi:10.1038/240229a0 Hewish, A., Bell, S. J., Pilkington, J. D. H., et al. 1968, Nature, 217,
1968 doi
-
[231]
T., & Stappers, B
doi:10.1038/220231a0 Weltevrede, P., Edwards, R. T., & Stappers, B. W. 2006, A&A, 445,
2006 doi
-
[243]
W., & Edwards, R
doi:10.1051/0004-6361:20053088 Weltevrede, P., Stappers, B. W., & Edwards, R. T. 2007, A&A, 469,
2007 doi
-
[301]
aa_example Dewey, R
doi:10.1093/mnras/149.4.301 Article number, page 5 A&A proofs: manuscript no. aa_example Dewey, R. J., Taylor, J. H., Weisberg, J. M., et al. 1985, ApJ, 294, L25. doi:10.1086/184502 Vaughan, A. E. & Large, M. I. 1970, Nature, 225,
1985 doi
-
[347]
S., Ransom, S
doi:10.1093/mnras/stt1023 Stovall, K., Lynch, R. S., Ransom, S. M., et al. 2014, ApJ, 791,
2014 doi
-
[358]
H., Taylor, J
doi:10.1046/j.1365-8711.2001.04637.x Stokes, G. H., Taylor, J. H., Welsberg, J. M., et al. 1985, Nature, 317,
2001
-
[394]
F., Anumarlapudi, A., et al
doi:10.1093/mnras/stz1278 Agazie, G., Alam, M. F., Anumarlapudi, A., et al. 2023, ApJ, 951, L9. doi:10.3847/2041-8213/acda9a Manchester, R. N., Hobbs, G., Bailes, M., et al. 2013, PASA, 30, e017. doi:10.1017/pasa.2012.017 Oswald, L. S., Karastergiou, A., Posselt, B., et al. 20...
2023 doi
-
[409]
T., Bailes, M., van Straten, W., et al
doi:10.1093/mnras/185.2.409 Edwards, R. T., Bailes, M., van Straten, W., et al. 2001, MNRAS, 326,
2001 doi
-
[417]
2020, Nature, 587,
doi:10.1146 /annurev- astro-091918-104501 Zhang, B. 2020, Nature, 587,
2020
-
[446]
F., Han, J
doi:10.1086/498335 Wang, P. F., Han, J. L., Xu, J., et al. 2023, Research in Astronomy and Astro- physics, 23, 104002. doi:10.1088/1674-4527/acea1f Chandler, A. M. 2003, Ph.D. Thesis, 761 Manchester, R. N., Lyne, A. G., Taylor, J. H., et al. 1978, MNRAS, 185,
2023 doi
-
[487]
doi:10.1086/151164 Cordes, J. M. 1979, Australian Journal of Physics, 32,
1979 doi
-
[561]
doi:10.1146/annurev.aa.28.090190.003021 Foster, R. S. & Cordes, J. M. 1990, ApJ, 364,
1990
-
[607]
I., et al
doi:10.1051/0004-6361:20066855 Basu, R., Mitra, D., Melikidze, G. I., et al. 2019, MNRAS, 482,
2019 doi
-
[615]
P., Wise, M
doi:10.1038/300615a0 van Haarlem, M. P., Wise, M. W., Gunst, A. W., et al. 2013, A&A, 556, A2. doi:10.1051/0004-6361/201220873 Rickett, B. J. 1990, ARA&A, 28,
2013 doi
-
[694]
doi:10.1086/164808 Clifton, T. R. & Lyne, A. G. 1986, Nature, 320,
1986 doi
-
[709]
R., Camilo, F., & McLaughlin, M
doi:10.1038/217709a0 Lorimer, D. R., Camilo, F., & McLaughlin, M. A. 2013, MNRAS, 434,
2013 doi
-
[753]
doi:10.1038/220753a0 Davies, J. G. & Large, M. I. 1970, MNRAS, 149,
1970 doi
- [777]
-
[787]
H., et al
doi:10.1038/317787a0 Hobbs, G., Faulkner, A., Stairs, I. H., et al. 2004, MNRAS, 352,
2004 doi
-
[819]
G., Large, M
doi:10.1086/177829 Davies, J. G., Large, M. I., & Pickwick, A. C. 1970, Nature, 227,
1970 doi
-
[1115]
doi:10.1093/mnras/stab980 Pennucci, T. T. 2019, ApJ, 871,
2019 doi
-
[1123]
doi:10.1038/2271123a0 Hulse, R. A. & Taylor, J. H. 1974, ApJ, 191, L59. doi:10.1086/181548 Lyne, A. G. & Hamilton, P. A. 1981, Unpublished work Davies, J. G., Lyne, A. G., & Seiradakis, J. H. 1973, Nature Physical Science, 244,
1974 doi
-
[1299]
R., Faulkner, A
doi:10.1046/j.1365-8711.2003.06637.x Lorimer, D. R., Faulkner, A. J., Lyne, A. G., et al. 2006, MNRAS, 372,
2003
-
[1311]
K., & Balasubramanian, V
doi:10.1111/j.1365-2966.2004.08157.x Swarup, G., Mohanty, D. K., & Balasubramanian, V . 1971, IAU Circ., 2356 Davies, J. G., Lyne, A. G., & Seiradakis, J. H. 1972, Nature, 240,
2004
-
[1947]
doi:10.1093/mnras/stab2692 Hessels, J. W. T., Spitler, L. G., Seymour, A. D., et al. 2019, ApJ, 876, L23. doi:10.3847/2041-8213/ab13ae Nan, R. 2006, Science in China: Physics, Mechanics and Astronomy, 49,
2019 doi
-
[1993]
J., Altiere, E., Bogdanov, S., et al
doi:10.1086/428488 Nice, D. J., Altiere, E., Bogdanov, S., et al. 2013, ApJ, 772,
2013 doi
-
[2259]
doi:10.1088/0004-637X/703/2/2259 Mohanty, D. K. & Balasubramanian, V . 1975, MNRAS, 171, 17P. doi:10.1093/mnras/171.1.17P Kramer, M., Bell, J. F., Manchester, R. N., et al. 2003, MNRAS, 342,
1975 doi
-
[3757]
2019, Astrophysics Source Code Li- brary
doi:10.1093/mnras/sty2846 Seymour, A., Michilli, D., & Pleunis, Z. 2019, Astrophysics Source Code Li- brary. ascl:1910.004 Lin, H.-H., Main, R., Pen, U.-L., et al. 2022, arXiv:2208.13677. doi:10.48550/arXiv.2208.13677 Lewandowska, N., Demorest, P. B., McLaughlin, M. A., et al....
Reviewed August 12, 2026 · model on record in the stance chip above.
Discussion (0). Continue with ORCID to comment.