REVIEW 5 major objections 5 minor 1 cited by
Measurement of the Resolution of the Timepix4 Detector for 100 keV and 200 keV Electrons for Transmission Electron Microscopy
T0 review · 5 major / 5 minor · reviewed 2026-08-12 · deepseek-v4-flash
Pith's one-line read The Timepix4 detector's arrival-time and charge data sharpen electron images up to 3.16x at Nyquist.
desk verdict Useful first Timepix4 electron MTF data with a credible clustering gain, but the 200 keV numbers are entirely fit-derived and the quoted errors omit the dominant model uncertainty. read the letter →
The pith
A machine-rendered reading of the paper's core claim, the machinery that carries it, and where it could break.
The reading
What carries the argument
The mechanism is ToT-weighted centroid clustering with temporal gating. Each electron event is recovered by sorting hits by Time of Arrival into 100 ns intervals, chosen to match the tens-of-nanosecond drift time of charge in the 300 µm sensor, and then grouping hits whose coordinates fall within a 7x7 pixel window. The cluster is replaced by its Time over Threshold (ToT) weighted centroid, that is, the charge-weighted center of the deposited ionization, and that single sub-pixel coordinate is assigned to one of four virtual pixels per physical pixel. One-by-n clusters, where no centroid can be computed along one axis, are assigned a random uniform position within the pixel for that coordinate. This machinery works because ToT gives a per-pixel measure of deposited charge and because the centroid, while not exactly the entry point for a long track, is systematically closer to it than the whole cluster is.
What would settle it
Collect a 200 keV knife-edge dataset with substantially more hits per pixel and differentiate the edge spread function directly, without any error-function fit; if the resulting MTF at Nyquist deviates materially from 0.0046, or the improvement factor from 3.16, the fitted values are artifacts of the assumed Gaussian line spread.
Extended reading notes
Core claim
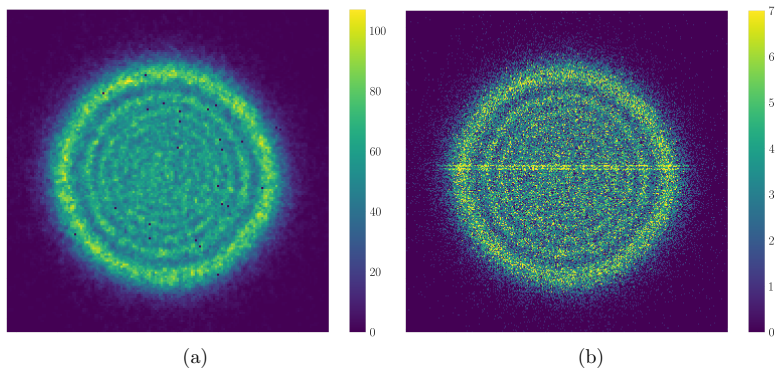
On its own terms, the paper establishes that a simple ToT-weighted centroid clustering algorithm, applied offline to Timepix4 event data, substantially improves the spatial resolution of electron images. For 100 keV electrons the MTF at Nyquist rises from 0.16 to 0.34, and for 200 keV it rises from 0.0046 to 0.014, corresponding to improvement factors of 2.12 and 3.16. The improvement is attributed to better estimation of the electron entry point: ToT weights the centroid toward the pixel or pixels where the ionization track deposits most charge, and rebinning into 2x2 virtual pixels samples the edge at a higher effective rate. The authors check that the centroid distribution across the four virtual pixels is even, ruling out an artifact from shrinking the sensitive area, and they show that the improvement is visible in test images as increased contrast and clarity. The raw 200 keV MTF is so low that the edge spread function could not be differentiated directly and was fitted with an error function, so the reported numbers for that energy rest on the fitted line spread being Gaussian.
Load-bearing premise
The 200 keV result depends on the assumption that the line spread function is Gaussian: with the limited statistics available, the edge profile had to be fitted with an error function because direct differentiation was impossible, and a non-Gaussian line spread, for example with long tails from backscattered electrons, would change the reported MTF and improvement factor.
Editorial extensions
If this is right
- At 100 keV the clustering lifts the MTF at Nyquist from 0.16 to 0.34, a 2.12-fold gain; at 200 keV it lifts it from 0.0046 to 0.014, a 3.16-fold gain.
- The same Timepix4 hardware, without sensor thinning or smaller pixels, can image electrons with better contrast and clarity, as shown in the clustered Fresnel-disk test images.
- Because these gains were achieved before timewalk correction or per-pixel energy calibration, further calibration work is expected to improve the centroid accuracy and push the MTF higher.
- The raw Timepix4 MTF curves are consistent with earlier Medipix2 and Medipix3 electron measurements, validating the setup and making the clustered improvement directly comparable to those detectors.
- The improvement is a partial correction of the blur created by extended electron trajectories inside the sensing layer, not a removal of the underlying physical spread of charge.
Reading between the lines
- The paper's logic implies that the same ToT-weighted centroid clustering should also improve the detective quantum efficiency at high spatial frequencies, a quantity not reported here, because it moves signal weight closer to the true entry position.
- The 2.12 and 3.16 improvement factors are tied to the threshold setting used in the experiment; a lower threshold would capture more of each ionization track and shift the centroid, so these numbers are thresholds-dependent rather than universal detector properties.
- The method should transfer to other Timepix4 applications where charged particles produce multi-pixel clusters, such as low-energy electron microscopy or ion imaging, because the required per-hit ToA and ToT data are detector features rather than TEM-specific.
- A natural extension, which the paper lists as future work, is to replace the fixed 2x2 subdivision with a machine-learned or Monte-Carlo-calibrated entry-point estimator; that could push the effective resolution beyond what a simple charge-weighted centroid achieves.
Editorial analysis
A structured set of objections, weighed in public.
Referee Report
Summary. The manuscript reports knife-edge MTF measurements of a 300 µm silicon Timepix4 detector for 100 keV and 200 keV electrons in a TEM. It compares a pseudo-particle-counting mode that uses only hit coordinates with a clustered mode that uses ToA and ToT information to compute ToT-weighted centroids, rebinning the data into 2×2 virtual pixels. The measured MTF at the physical-detector Nyquist frequency is 0.16 at 100 keV and 0.0046 at 200 keV in the raw mode, rising to 0.34 and 0.014 after clustering, corresponding to improvement factors of 2.12 and 3.16. The authors argue that temporal and amplitude information can partially correct for the blur caused by extended electron trajectories in the sensor.
Significance. If the results are robust, the paper is a useful contribution to TEM detector characterization: it demonstrates that Timepix4 per-hit timing and energy information can recover spatial resolution beyond the pixel pitch, and it provides a quantitative comparison with earlier Medipix detectors. The 100 keV internal check between fitted and unfitted ESF analysis, the explicit discussion of cluster-shape biases, and the honest identification of the 200 keV fitting difficulty are credits. However, the 200 keV headline numbers rest entirely on an error-function fit with no cross-check, the quoted uncertainties exclude model and algorithm-parameter dependence, and the comparison frequency for the clustered data is not defined unambiguously. With additional validation the paper would be a solid instrument characterization; at present the central 200 keV claim needs revision.
major comments (5)
- [Section 4, Eq. (3), Table 1] The 200 keV entries in Table 1 (raw MTF 0.0046, clustered MTF 0.014, improvement factor 3.16) are derived entirely from fitting the ESF with the error function of Eq. (3), because the text states that for 200 keV 'obtaining the MTF curve without a fit becomes impossible'. An erf fit imposes a Gaussian LSF, so the MTF at Nyquist is controlled by the fitted width sigma and cannot reflect non-Gaussian tails from backscattered or large-angle electrons, which the authors' own CASINO simulation in Fig. 2 indicates are present. The quoted uncertainties in Table 1 (±0.000069, ±0.00015, ±0.018) reflect only the sampling-region spread and do not include this model dependence. I request reporting of the fit parameters and residuals, a Monte-Carlo or simulated-data validation of the erf assumption at 200 keV, or an explicit statement that the 200 keV improvement factor is model-dependent rather than a measured value.
- [Section 4.2/4.3, Table 1, Fig. 10] The clustered data are re-binned into 2×2 virtual pixels of 27.5 µm, so the Nyquist frequency of the clustered image is twice the physical-detector Nyquist frequency. The improvement factors in Table 1 are evaluated at the physical-detector Nyquist frequency, as stated in the Fig. 10 caption, not at the Nyquist frequency of the clustered image. The abstract's phrase 'improved the MTF at Nyquist' is therefore ambiguous. Please define unambiguously which Nyquist frequency is meant in the abstract and Table 1, and justify the comparison at the physical Nyquist frequency if that is the intended figure of merit.
- [Section 4.2] The clustering analysis relies on several user-chosen parameters: 100 ns ToA grouping, the 7×7 spatial window, the 2×2 virtual-pixel subdivision, and the random uniform assignment for the unresolved coordinate of 1×n clusters. No sensitivity study is presented. Because the improvement factors are the central quantitative result, the authors should demonstrate that the factors are stable against reasonable variations of these parameters, or at least quantify how much of the improvement depends on each choice.
- [Section 4.3] The paper acknowledges that a ToT-weighted centroid can be displaced from the electron entry point when energy is deposited along the track, as is expected for 200 keV electrons. The text argues that the centroid still improves resolution, but no quantitative estimate of this displacement or its effect on the MTF is given. Since the 200 keV improvement factor is the largest claimed, a simulation-based estimate of the centroid bias, or at least a discussion of its expected effect on the measured MTF, would materially strengthen the paper.
- [Figure 11, Section 4.3] The clustered image in Fig. 11 shows a visible line at rows 255/256, attributed to a timestamp misalignment between the two readout halves. This offset could split clusters that straddle the seam and corrupt centroid positions. The paper does not state whether the MTF sampling regions included this seam or whether a correction was applied. Since the MTF values are obtained from sampling regions of 200–350 rows, the seam is relevant to all reported numbers; please clarify whether the seam was excluded or corrected, and if necessary re-analyze the data without it.
minor comments (5)
- [Section 4.3] In the sentence describing cluster spatial footprints, 'refer to the interaction volumes in Figure 3' should refer to Figure 2, which shows the Monte-Carlo interaction volumes.
- [Section 4.3, Figure 11 caption] The sentence 'leads to a visible in the final image line' is missing a noun; it should read 'leads to a visible artifact in the final image' or similar.
- [Eq. (2)] The oversampling formula would be clearer with parentheses and a definition of n_bins: the oversampling factor is approximately n_bins / cos θ, where n_bins is the number of ESF bins per pixel.
- [References] Reference [20] lists '0304–3991' where page or article numbers are expected; please check and complete the bibliographic data.
- [Data availability] No data or code availability statement is provided; for a measurement paper of this kind, making the analysis scripts or representative datasets available would aid reproducibility assessments.
Circularity Check
No significant circularity: the MTF values and clustering improvement factors are direct measurements from data, with no fitted parameter renamed as a prediction.
full rationale
This is an experimental measurement paper. The central claims are the raw MTF at Nyquist (0.16 at 100 keV, 0.0046 at 200 keV) and the improvement factors after ToT-weighted centroid clustering (2.12 and 3.16). These numbers are computed directly from knife-edge ESF data: the ESF is either differentiated (for 100 keV) or fitted with an error function (for 200 keV) and then Fourier-transformed to obtain the MTF. The error-function fit is a data-processing choice, not a fitted prediction: the fitted parameters A, B, mu, and sigma are obtained from the same ESF being measured, and no external MTF value is used as a target. The improvement factor is simply the ratio of the measured clustered and unclustered MTF values reported in Table 1, so it is not equivalent to an input by construction. The clustering algorithm does impose analysis choices (100 ns grouping, 7x7 window, 2x2 splitting), but these are not circular: they are justified from electron drift times and cluster-size distributions, and the resulting improvement is a measured outcome rather than an enforced equality. The comparison with previous Medipix2/Medipix3 measurements [18, 19, 20] is an external consistency check, not a load-bearing self-citation: those references are by other groups and are used only to corroborate the raw MTF scale. The main legitimate concern is model dependence of the 200 keV MTF on the error-function ESF fit, but that is a statistical/modeling risk, not circularity, because the fit is constrained by the measured edge data and no independent result is being reproduced from the fit assumption.
Assumptions & free parameters
free parameters (5)
- ESF fit parameters (A, B, mu, sigma) =
fit per dataset; sigma values not reported
- Virtual pixel subdivision factor =
2x2
- ToA grouping interval =
100 ns
- Cluster spatial window =
7x7 pixels
- Slant edge angle =
4 degrees
assumptions (5)
- domain assumption The ESF for both electron energies is well described by an error function (Gaussian LSF).
- domain assumption The ToT-weighted centroid of a hit cluster approximates the electron entry point.
- domain assumption Hits in a 100 ns window within a 7x7 window belong to a single electron.
- domain assumption Even occupancy of the four virtual pixels proves the improvement is due to entry-point estimation.
- domain assumption Fresnel diffraction and aluminum fluorescence at the knife edge are negligible below pixel size/threshold.
Cite this review
Pith. "Pith review of Measurement of the Resolution of the Timepix4 Detector for 100 keV and 200 keV Electrons for Transmission Electron Microscopy." pith.science (2026). https://pith.science/paper/C22QJFB3
@misc{pith2026241116258,
  author       = {Pith},
  title        = {Pith review of: Measurement of the Resolution of the Timepix4 Detector for 100 keV and 200 keV Electrons for Transmission Electron Microscopy},
  year         = {2026},
  howpublished = {\url{https://pith.science/paper/C22QJFB3}},
  note         = {Machine review of arXiv:2411.16258}
}
read the original abstract
We have evaluated the imaging capabilities of the Timepix4 hybrid silicon pixel detector for 100 keV and 200 keV electrons in a Transmission Electron Microscope (TEM). Using the knife-edge method, we have measured the Modulation Transfer Function (MTF) at both energies. Our results show a decrease in MTF response at Nyquist (spatial) frequency, dropping from approximately 0.16 at 100 keV to 0.0046 at 200 keV. However, by using the temporal structure of the detected events, including the arrival time and amplitude provided by the Timepix4, we enhanced the spatial discrimination of electron arrival. This approach improved the MTF at Nyquist by factors of 2.12 for 100 keV and 3.16 for 200 keV. These findings demonstrate that the blurring effects caused by extended electron trajectories within the sensing layer can be partially corrected in the image data.
Figures


Figures from the paper (8 more)


Forward citations
Cited by 1 Pith paper
-
Guided progressive reconstructive imaging: a new quantization-based framework for low-dose, high-throughput and real-time analytical ptychography
Ptychographic phase reconstruction can be decomposed into a sum of precomputed single-electron contributions, enabling linear-complexity, event-wise direct phase retrieval.
Reference graph
Works this paper leans on
-
[1]
R. Ballabriga, M. Campbell, X. Llopart,An introduction to the Medipix family ASICs,Radiation Measurements136(2020) 106271
work page 2020
-
[2]
X. Llopart, J. Alozy, R. Ballabriga, M. Campbell et al.,Timepix4, a large area pixel detector readout chip which can be tiled on 4 sides pro- viding sub-200 ps timestamp binning,JINST17(2021) C01044
work page 2021
-
[3]
A. Mac Raighne, G.V. Fernandez, D. Maneuski et al.,Medipix2 as a highly flexible scanning/imaging detector for transmission electron mi- croscopy,JINST6(2011) C01047
work page 2011
-
[4]
X. Pei, L. Zhou, C. Huang et al.,Cryogenic electron ptychographic single particle analysis with wide bandwidth information transfer,Nat. Comms. 14(2023) 3027
work page 2023
-
[5]
D.N. Johnstone, F.C.N. Firth, C.P. Grey et al.,Direct Imaging of Corre- lated Nanodomains in a Metal-Organic Framework,J. Am. Chem. Soc. 142(2020) pp 13081-13089
work page 2020
-
[6]
I. Sikharulidze, R. van Gastel, S. Schramm et al.,Low energy electron microscopy imaging using Medipix2 detector,Nucl. Instrum. Methods Phys. Res. A633(2011) S239–S242
work page 2011
-
[7]
G.W. Paterson, R.J. Lamb, R. Ballabriga et al.,Sub-100 nanosecond temporally resolved imaging with the Medipix3 direct electron detector, Ultramicroscopy210(2020) 112917. 20
work page 2020
-
[8]
A. Sopczak,Luminosity Measurements at the LHC at CERN Using Medipix, Timepix and Timepix3 Devices,Physics3(2021) 579–654
work page 2021
Show all 25 references
-
[9]
Quantum Detectors Ltd.,R103, RAL, Harwell, Oxford, OX11 0QX
-
[10]
Drouin, A.R
D. Drouin, A.R. Couture, D. Joly et al.,CASINO V2.42—A Fast and Easy-to-use Modeling Tool for Scanning Electron Microscopy and Mi- croanalysis Users,Scanning29(2007) 92–101
2007
-
[11]
International Organization for Standardization,Photography — Elec- tronic still picture imaging — Resolution and spatial frequency responses ISO 12233:2023(2023)
2023
-
[12]
Ponchut,Characterization of X-ray area detectors for synchrotron beamlines,Journal of Synchrotron Radiation13(2005) 195–203
C. Ponchut,Characterization of X-ray area detectors for synchrotron beamlines,Journal of Synchrotron Radiation13(2005) 195–203
2005
-
[13]
Rivetti, N
S. Rivetti, N. Lanconelli, M. Bertolini et al.,Characterization of a clin- ical unit for digital radiography based on irradiation side sampling tech- nology,Medical Physics40(2013) 101902
2013
-
[14]
Birnsteinova, D.E
S. Birnsteinova, D.E. Ferreira de Lima, E. Sobolev et al.,Online dy- namic flat-field correction for MHz microscopy data at European XFEL, Journal of Synchrotron Radiation30(2023) 1030–1037
2023
-
[15]
G. Barr, R. Devenish, R. Walczak, T. Weidberg,Particle Physics in the LHC Era, Oxford University Press (2016)
2016
-
[16]
Battaglia, D
M. Battaglia, D. Contarato, P. Denes et al.,Characterisation of a CMOS active pixel sensor for use in the TEAM microscope,Nucl. Instrum. Methods Phys. Res. A622(2010) 669–677
2010
-
[17]
Deptuch, A
G. Deptuch, A. Besson, P. Rehak et al.,Direct electron imaging in elec- tron microscopy with monolithic active pixel sensors,Ultramicroscopy 107(2007) 674-–684
2007
-
[18]
McMullan, D.M
G. McMullan, D.M. Cattermole, S. Chen et al.,Electron imaging with Medipix2 hybrid pixel detector,Ultramicroscopy107(2007) 401–413
2007
-
[19]
J.A. Mir, R. Clough, R. MacInnes et al.,Characterisation of the Medipix3 detector for 60 and 80 keV electrons,Ultramicroscopy182 (2017) 44–53. 21
2017
-
[20]
Paton, M.C
K.A. Paton, M.C. Veale, X. Mu et al.,Quantifying the performance of a hybrid pixel detector with GaAs:Cr sensor for transmission electron microscopy,Ultramicroscopy227(2021) 0304–3991
2021
-
[21]
Tsigaridas, M.v
S. Tsigaridas, M.v. Beuzekom, H.v.d. Graaf et al.,Timewalk correction for the Timepix3 chip obtained with real particle data,Nucl. Instrum. Methods Phys. Res. A930(2019) 185–190
2019
-
[22]
Khalil, E
M. Khalil, E. Dreier, J. Kehres, J. Jakubek, U. Olsen,Subpixel resolution in CdTe Timepix3 pixel detectors,Journal of Synchrotron Radiation25 (2018)
2018
-
[23]
Jakubek, A
J. Jakubek, A. Cejnarova, T. Holy et al,Pixel detectors for imaging with heavy charged particles,Nucl. Instrum. Methods Phys. Res. A591 (2008) 155–158
2008
-
[24]
Spannagel et al.,Allpix Squared: A modular simulation framework for silicon detectors,Nucl
S. Spannagel et al.,Allpix Squared: A modular simulation framework for silicon detectors,Nucl. Instrum. Methods Phys. Res. A901(2018) 164–172
2018
-
[25]
van Schayck, Y
J.P. van Schayck, Y. Zhang, K. Knoops et al.,Integration of an Event- driven Timepix3 Hybrid Pixel Detector into a Cryo-EM Workflow,Mi- croscopy and Microanalysis29(2023) 352–363. 22
2023
Reviewed August 12, 2026 · model on record in the stance chip above.
Discussion (0). Continue with ORCID to comment.