REVIEW 3 major objections 5 minor 33 references
The nonlinear elastic deformation of liquid inclusions embedded in elastomers
T0 review · 3 major / 5 minor · reviewed 2026-08-12 · deepseek-v4-flash
Pith's one-line read Experiments and simulations together show that liquid inclusions in a stretched elastomer deform highly non-uniformly and can develop creases at their poles.
desk verdict A genuinely out-of-sample validation of the Lopez-Pamies liquid-inclusion framework, with new local-deformation data and a reversible pole crease; the 'highly accurate' claim is qualified by an unaddressed finite-thickness effect for the largest inclusions. read the letter →
The pith
A machine-rendered reading of the paper's core claim, the machinery that carries it, and where it could break.
The reading
What carries the argument
The argument rests on a coupled Lagrangian equilibrium framework in which the elastomer is an incompressible non-Gaussian hyperelastic solid, the liquid inclusion is an incompressible elastic fluid with residual hydrostatic stress, and the interface is a hyperelastic surface with constant surface tension. For each experiment the domain is taken as a cube of side $40A$ with affine displacement boundary conditions imposing the measured macroscopic stretch $\lambda$, and the equilibrium PDEs are solved with a finite-element scheme. The local response is characterized through the hoop stretch $\lambda_\Theta$ along the interface and the deviation measure $\Delta\lambda_\Theta$ that compares the actual hoop stretch with that of a uniformly deforming ellipsoid; the crease is detected by the loss of symmetry at the pole in the finite-element solution.
What would settle it
Perform uniaxial tension tests on specimens with identical inclusion radius and spacing but different thicknesses $B$, down to a few times $A$; if the measured inclusion axes, hoop stretch distribution, or crease threshold change measurably with $B$, the infinite-domain assumption that carries the simulations would be falsified.
Extended reading notes
Core claim
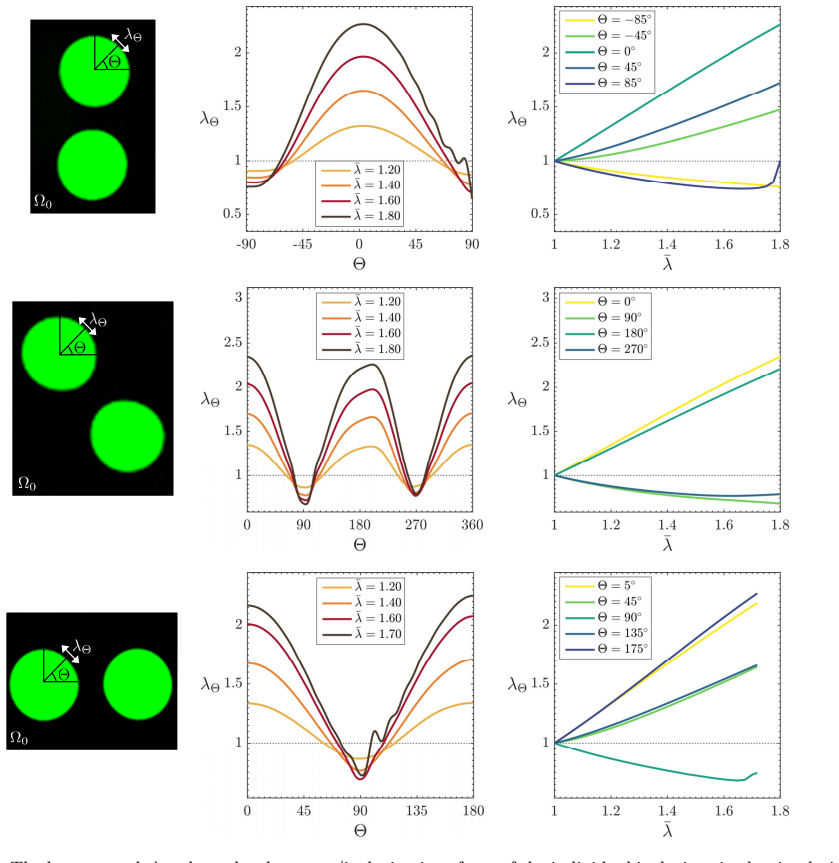
The paper claims that the simulations provide a highly accurate description of the deformation of the inclusions in all specimens tested, for isolated inclusions and for pairs oriented at 0, 45, and 90 degrees to the load. The deformation of liquid inclusions is significantly non-uniform, with hoop stretches tensile at the equator and compressive near the poles; the compressive hoop stretch can become large enough to nucleate a crease at the pole, which the simulation reproduces at a macroscopic stretch close to the experimentally observed value. The deformation is independent of inclusion size because the elasto-capillary numbers are small, and the presence of a neighboring inclusion modifies the deformation strongly and in an orientation-dependent way, including mutual shielding for pairs aligned with the load.
Load-bearing premise
The load-bearing premise is that the boundaries of the actual thin specimens are effectively infinitely far from the inclusions, so a cube of side $40A$ with affine boundary conditions reproduces the experiment; for the largest inclusions the simulation cube is much thicker than the real 1 mm specimen, so finite-thickness effects are assumed negligible.
Editorial extensions
If this is right
- The verified framework can be used to generate full-field local deformation data for a wide range of inclusion arrangements and loading histories without new experiments.
- The simulation results can feed homogenization-based effective stored-energy functions for suspensions of liquid inclusions, including the dilute-limit correction function $H(\mathbf{F})$ presented in the paper.
- Crease nucleation at inclusion poles gives a local criterion for failure or patterning in liquid-filled elastomers: the critical macroscopic stretch and the associated critical hoop stretch identify a threshold that can be compared across geometries.
- Orientation-dependent interaction between inclusions means that local strain concentrations can be designed by arranging inclusions in specific patterns relative to the loading direction.
Reading between the lines
- If the critical condition is indeed the local compressive hoop stretch at the pole, the same framework should predict crease onset for other inclusion shapes, spacings, and multiaxial loads; the paper does not test this generality.
- The observed elastic crease that disappears on unloading suggests a reversible surface-pattern mechanism, potentially useful for switchable optical or wetting properties of liquid-filled elastomers; this is an extension beyond the paper.
- For specimens whose thickness is comparable to the inclusion size, the infinite-domain approximation that carries the simulations will break down, and a finite-thickness simulation with traction-free faces would be a natural test of how much the local fields change.
- Extending the same experimental protocol to the elasto-capillarity-dominated regime of smaller inclusions should reveal whether the crease threshold shifts with surface tension; the paper leaves this as an obvious next step.
Editorial analysis
A structured set of objections, weighed in public.
Referee Report
Summary. The paper combines experiments and full-field simulations to study the finite elastic deformation of initially spherical glycerol inclusions in a PDMS elastomer under uniaxial tension. The experimental part uses fluorescent confocal microscopy to measure the deformed midplane shapes of isolated inclusions of three initial radii (A = 35, 72, 264 µm) and of pairs of inclusions at three orientations (0°, 45°, 90°). The simulations employ the framework of Ghosh and Lopez-Pamies (2022) with a two-term I1-based hyperelastic model for the PDMS matrix, incompressible fluid inclusions, and constant interface surface tension, solved on a cubic domain of side 40A with a modified FE scheme. The authors report good agreement for the evolution of the major and minor semi-axes, size independence in the negligible-elastocapillarity regime, a strongly non-uniform local deformation with large compressive hoop stretches near the poles, and the nucleation of reversible creases. They also connect the validated framework to a dilute homogenization result.
Significance. The study is a valuable quantitative test of a nonlinear theoretical framework for liquid inclusions in elastomers. Its strengths include genuine out-of-sample validation: the elastomer constants (Table 1) are fitted only to unfilled-PDMS uniaxial data and are never refitted to inclusion shapes, and the surface tension is explicitly shown to have no effect in this elasto-capillary regime. The direct observation of reversible creases at inclusion poles, with a critical stretch reproduced in simulation at a nearby value, is a novel and falsifiable result. If the finite-thickness concern below is resolved, the paper would provide a solid basis for using such simulations in homogenization models of liquid-filled elastomers.
major comments (3)
- [Section 3, Eqs. (8)-(11)] The replacement of the physical specimen by a cube of side 40A is not validated for the largest inclusions. For A = 264 µm, the cube side is 10.56 mm, while the actual specimen thickness is only 1 mm; if the inclusion is centered through the thickness, its surface is about 236 µm (0.89A) from the traction-free faces, whereas in the simulation the nearest traction-free surfaces are 20A away. The sentence "numerical experiments show that the boundaries of the specimens can be considered to be infinitely far away from the inclusions" checks the computational domain size, not the actual specimen geometry. For an incompressible inclusion near a free surface, image corrections scale roughly as (A/H)^3, and with H/A ≈ 1.9 that correction is of order 0.15, so the effect is not obviously negligible. I request either a simulation of the actual 30 mm × 4 mm × 1 mm slab with traction-free faces for A = 264 µm, or a report of the through-thickness inclusion position together with a convergence study demonstrating that free-surface effects are below the experimental resolution. Without this, the "highly accurate" claim in Section 5 is not fully supported.
- [Section 4.4, Fig. 11] The crease nucleation in the simulation is attributed to "errors inherent to the use of a FE discretization" acting as imperfections. Because the trigger is numerical noise, the predicted critical stretch (λ ≈ 1.5) and critical hoop stretch (λΘ = 0.71) are potentially mesh-dependent. The comparison with the experimental value (λ ≈ 1.6) and with the half-space threshold (λc = 0.65) is therefore not a quantitative validation unless mesh convergence is established. Please add a mesh-refinement study (e.g., two or more systematically refined discretizations) and show that the crease nucleation stretch and location do not change appreciably.
- [Section 4.3, Figs. 8 and 13] The central validation claim is stated as "highly accurate description of the deformation of the inclusions in all the specimens that were tested," but the comparison in Figs. 8 and 13 is only visual and no error bars or quantitative error measures are reported. Because the abstract and conclusions make a strong quantitative claim, please report the number of repeated tests and the maximum/average relative error in a/A and b/A, or otherwise provide a statistical measure of agreement.
minor comments (5)
- [Fig. 7 and Fig. 12] The figure labels and captions use "mm" where "µm" is intended (e.g., "A = 72 mm", "A = 87 mm", "D = 62 mm"). Please correct these units and verify the scale-bar lengths for each panel.
- [Eq. (16) and Section 4.3] The hoop stretch λΘ is defined only in the midplane e1-e2 plane. Since the inclusion is three-dimensional, there is also an out-of-plane hoop direction; please clarify that the reported λΘ is the midplane hoop stretch and explain why this is the relevant measure for the observed creases.
- [Section 4.4] The crease observation is reported for a single specimen (A = 72 µm). Please state how many specimens were examined for creasing and whether the critical stretch was reproducible, or temper the claim accordingly.
- [References] In the reference for Poulain et al. (2017), the author list reads "Lopez-Pamies, Ravi-Chandar" without given initials; it should be "O. Lopez-Pamies, K. Ravi-Chandar" or similar.
- [Section 4.2] The residual stress ri is estimated from Laplace's law as ri = -2γ/A, but the sign convention for pressure in the fluid is not defined before Eq. (14). A brief statement of the sign convention would improve clarity.
Circularity Check
No significant circularity: the inclusion-deformation predictions are out-of-sample tests against independent measurements, and the self-cited framework is being validated rather than assumed.
full rationale
The paper's central claim—that the simulations provide a highly accurate description of inclusion deformation—is an external comparison, not a reduction to its inputs. The elastomer constants in Table 1 are fitted to unfilled PDMS uniaxial data (Fig. 6) and are never refitted to inclusion shapes; the surface tension is estimated from prior literature and then shown numerically to be negligible in the tested regime. The measured major and minor semi-axis evolutions (Figs. 8 and 13) are therefore genuine out-of-sample predictions. The governing equations and finite-element scheme are taken from the authors' prior work (Ghosh and Lopez-Pamies, 2022), but this is a normal citation of a modeling framework whose correctness is being tested by the experiments, not a self-citation that supplies the conclusion. The Section 3 replacement of each specimen by a 40A cube with affine boundary conditions is an approximation justified by convergence checks; whether it faithfully represents the finite 1 mm specimen thickness is a correctness and robustness concern, not a circularity. Likewise, the non-uniformity measure in Eqs. (17)–(18) is a diagnostic defined from the simulated hoop stretch, and the analytical-versus-FE comparison in Fig. 15 is an internal consistency check, neither of which carries the paper's main predictive claim. No reported result reduces by construction to a fitted parameter or to a self-citation chain.
Assumptions & free parameters
free parameters (3)
- Elastomer hyperelastic constants µ1, α1, µ2, α2 =
33.5 kPa, 0.3648, 12 kPa, 2.1897
- Interface surface tension γ =
0.014 N/m
- Residual hydrostatic stress in inclusions ri =
ri = -2γ/A in [-0.8, -0.1] kPa for A in [35, 264] µm
assumptions (4)
- domain assumption PDMS is an incompressible isotropic hyperelastic solid with stored energy (1); glycerol is an incompressible elastic fluid with no shear resistance (2)
- domain assumption Interfaces carry constant surface tension γ (Eq. 3) and elasto-capillary effects are negligible at eCa below 0.0044
- ad hoc to paper Finite specimens can be modeled as an infinite domain: affine displacement boundary conditions on a cube of side 40A (Eqs. 8, 11)
- ad hoc to paper Crease nucleation in the FE simulation is triggered by mesh-discretization errors acting as imperfections, without intentional defects, and the resulting critical stretch is reliable
Cite this review
Pith. "Pith review of The nonlinear elastic deformation of liquid inclusions embedded in elastomers." pith.science (2026). https://pith.science/paper/3B7ZGZ5U
@misc{pith2026241116363,
  author       = {Pith},
  title        = {Pith review of: The nonlinear elastic deformation of liquid inclusions embedded in elastomers},
  year         = {2026},
  howpublished = {\url{https://pith.science/paper/3B7ZGZ5U}},
  note         = {Machine review of arXiv:2411.16363}
}
abstract
Elastomers filled with liquid inclusions -- as opposed to conventional solid fillers -- are a recent trend in the soft matter community because of their unique range of mechanical and physical properties. Such properties stem, in part, from the very large deformations that the underlying liquid inclusions are capable of undergoing. With the objective of advancing the understanding of the mechanics of this emerging class of materials, this paper presents a combined experimental/theoretical study of the nonlinear elastic deformation of initially spherical liquid inclusions embedded in elastomers that are subjected to quasistatic mechanical loads. The focus is on two fundamental problems, both within the limit regime when elasto-capillarity effects are negligible: ($i$) the problem of an isolated inclusion and ($ii$) that of a pair of closely interacting inclusions. Experimentally, specimens made of a polydimethylsiloxane (PDMS) elastomer filled with either isolated or pairs of initially spherical liquid glycerol inclusions are subjected to uniaxial tension. For the specimens with pairs of inclusions, three orientations of the two inclusions with respect to the direction of the applied macroscopic tensile load are considered, $0^\circ$, $45^\circ$, and $90^\circ$. The liquid glycerol is stained with a fluorescent dye that permits to measure the local deformation of the inclusions \emph{in situ} via confocal laser scanning fluorescent microscopy. Theoretically, a recently developed framework -- wherein the elastomer is considered to be a nonlinear elastic solid, the liquid comprising the inclusions is considered to be a nonlinear elastic fluid, and the interfaces separating the elastomer from the liquid inclusions can feature their own nonlinear elastic behavior (e.g., surface tension) -- is utilized to carry out full-field simulations of the experiments.
Figures


Figures from the paper (12 more)



Reference graph
Works this paper leans on
-
[1]
Solid capillarity: when and how does surface tension deform soft solids? Soft Matter 12, 2993–2996
Andreotti, B., B¨ aumchen, O., Boulogne, F., Daniels, K.E., Dufresne, E.R., Perrin, H., Salez, T., Snoeijer, J.H., Style, R.W., 2016. Solid capillarity: when and how does surface tension deform soft solids? Soft Matter 12, 2993–2996
work page 2016
-
[2]
High thermal conductivity in soft elastomers with elongated liquid metal inclusions
Bartlett, M.D., Kazem, N., Powell-Palm, M.J., Huang, X., Sun, W., Malen, J.A., Majidi, C., 2017. High thermal conductivity in soft elastomers with elongated liquid metal inclusions. Proceedings of the National Academy of Sciences 114, 2143–2148
work page 2017
-
[3]
The determination of the bulk stress in a suspension of spherical particles to order c2
Batchelor, G.D., Green, J.T., 1972. The determination of the bulk stress in a suspension of spherical particles to order c2. J. Fluid Mech. 56, 401–427
work page 1972
-
[4]
Elastocapillarity: When surface tension deforms elastic solids
Bico, J., Reyssat, E., Roman, B., 2018. Elastocapillarity: When surface tension deforms elastic solids. Annual Review of Fluid Mechanics 50, 629–659
work page 2018
-
[5]
Chen, H.S., Acrivos, A., 1978. The solution of the equations of linear elasticity for an infinite region containing two spherical inclusions. International Journal of Solids and Structures 14, 331–348
work page 1978
-
[6]
Soft nucleation of an elastic crease
Ciarletta, P., Truskinovsky, L., 2019. Soft nucleation of an elastic crease. Phys. Rev. Lett. 122, 248001. deBotton, G., Shmuel, G., 2010. A new variational estimate for the effective response of hyperelastic composites. J. Mech. Phys. Solids 58, 466–483. 18
work page 2019
-
[7]
Ruga mechanics of creasing: from instantaneous to setback creases
Diab, M., Zhang, T., Zhao, R., Gao, H., Kim, K., 2013. Ruga mechanics of creasing: from instantaneous to setback creases. Proc. R. Soc. A 469, 20120753. D ´ ıaz, J.C., Francfort, G.A., Lopez-Pamies, O., Mora, M.G., 2024. Liquid filled elastomers: From lineariza- tion to elastic enhancement. Archive for Rational Mechanics and Analysis. In press
work page 2013
-
[8]
On Einstein’s effective viscosity formula
Duerinckx, M., Gloria, A., 2023. On Einstein’s effective viscosity formula. European Mathematical Society
work page 2023
Show all 33 references
-
[9]
Eine neue bestimmung der molek¨ uldimensionen
Einstein, A., 1906. Eine neue bestimmung der molek¨ uldimensionen. [A new determination of molecular dimensions]. Ann. Phys. 324, 289–306
1906
-
[10]
Berichtigung zu meiner arbeit: Eine neue bestimmung der molek¨ uldimensionen
Einstein, A., 1911. Berichtigung zu meiner arbeit: Eine neue bestimmung der molek¨ uldimensionen. [Cor- rection: A new determination of molecular dimensions]. Ann. Phys. 339, 591–592
1911
-
[11]
The determination of the elastic field of an ellipsoidal inclusion and related problems
Eshelby, J.D., 1957. The determination of the elastic field of an ellipsoidal inclusion and related problems. Proc. R. Soc. London A 241, 376–396
1957
-
[12]
Surface instabilities in compressed or bent rubber blocks
Gent, A.N., Cho, I.S., 1999. Surface instabilities in compressed or bent rubber blocks. Rubber Chemistry and Technology 72, 253–262
1999
-
[13]
Elastomers filled with liquid inclusions: Theory, numerical implemen- tation, and some basic results
Ghosh, K., Lopez-Pamies, O., 2022. Elastomers filled with liquid inclusions: Theory, numerical implemen- tation, and some basic results. J. Mech. Phys. Solids 166, 104930
2022
-
[14]
Unfolding the sulcus
Hohlfeld, E., Mahadevan, L., 2011. Unfolding the sulcus. Phys. Rev. Lett. 106, 105702
2011
-
[15]
Formation of creases on the surfaces of elastomers and gels
Hong, W., Zhao, X., Suo, Z., 2009. Formation of creases on the surfaces of elastomers and gels. Applied Physics Letters 95, 111901
2009
-
[16]
Thermomechanics of solids with lower-dimensional energetics: On the importance of surface, interface, and curve structures at the nanoscale
Javili, A., McBride, A., Steinmann, P., 2013. Thermomechanics of solids with lower-dimensional energetics: On the importance of surface, interface, and curve structures at the nanoscale. A unifying review. Appl. Mech. Rev. 65, 010802. Lef` evre, V., Danas, K., Lopez-Pamies, O....
2013
-
[17]
The nonlinear elastic response of filled elastomers: Experiments vs
Leonard, M., Wang, N., Lopez-Pamies, O., Nakamura, T., 2020. The nonlinear elastic response of filled elastomers: Experiments vs. theory for the basic case of particulate fillers of micrometer size. Journal of the Mechanics and Physics of Solids 135, 103781. 19
2020
-
[18]
A new I1-based hyperelastic model for rubber elastic materials
Lopez-Pamies, O., 2010. A new I1-based hyperelastic model for rubber elastic materials. Comptes Rendus Mecanique 338, 3–11
2010
-
[19]
Elastic dielectric composites: Theory and application to particle-filled ideal di- electrics
Lopez-Pamies, O., 2014. Elastic dielectric composites: Theory and application to particle-filled ideal di- electrics. J. Mech. Phys. Solids 64, 61–82
2014
-
[20]
Nucleation of creases and folds in hyperelastic solids is not a local bifurcation
Pandurangi, S.S., Akerson, A., Elliott, R.S., Healey, T.J., Triantafyllidis, N., 2022. Nucleation of creases and folds in hyperelastic solids is not a local bifurcation. Journal of the Mechanics and Physics of Solids 160, 104749. Ponte Casta˜ neda, P., 1991. The effective mech...
2022
-
[21]
Damage in elastomers: Nucleation and growth of cavities, micro-cracks, and macro-cracks
Poulain, X., Lef` evre, V., Lopez-Pamies, Ravi-Chandar, K., 2017. Damage in elastomers: Nucleation and growth of cavities, micro-cracks, and macro-cracks. International Journal of Fracture 205, 1–21
2017
-
[22]
Limiting law of the reinforcement of rubber
Smallwood, H., 1944. Limiting law of the reinforcement of rubber. J. Appl. Phys. 15, 758–766
1944
-
[23]
Dynamics of drop deformation and breakup in viscous fluids
Stone, H.A., 1994. Dynamics of drop deformation and breakup in viscous fluids. Annu. Rev. Fluid Mech. 26, 65–102
1994
-
[24]
Overall potentials and extremal surfaces of power law or ideally plastic composites
Suquet, P., 1993. Overall potentials and extremal surfaces of power law or ideally plastic composites. J. Mech. Phys. Solids 41, 981–1002
1993
-
[25]
Variational principles for inhomogeneous nonlinear media
Talbot, D.R.S., Willis, J.R., 1985. Variational principles for inhomogeneous nonlinear media. IMA J. Appl. Math. 35, 39–54
1985
-
[26]
Some simple explicit bounds for the overall behaviour of nonlinear composites
Talbot, D.R.S., Willis, J.R., 1992. Some simple explicit bounds for the overall behaviour of nonlinear composites. Int. J. Solids Struct. 29, 1981–1987
1992
-
[27]
Upper and lower bounds for the overall properties of a nonlinear composite dielectric
Talbot, D.R.S., Willis, J.R., 1994. Upper and lower bounds for the overall properties of a nonlinear composite dielectric. I. Random microgeometry. Proc. R. Soc. Lond. A 447, 365–384
1994
-
[28]
The viscosity of a fluid containing small drops of another fluid
Taylor, G.I., 1932. The viscosity of a fluid containing small drops of another fluid. Proc. R. Soc. Lond. Ser. A 138, 41–48
1932
-
[29]
Introduction to Rational Elasticity
Wang, C.C., Truesdell, C., 1973. Introduction to Rational Elasticity. Noordhoff International, Leyden
1973
-
[30]
Bursting drops in solid dielectrics caused by high voltages
Wang, Q., Suo, Z., Zhao, X., 2012. Bursting drops in solid dielectrics caused by high voltages. Nature Communications 3, 1157
2012
-
[31]
Wrinkling of a compressed hyperelastic half-space with localized surface imperfec- tions
Wang, X., Fu, Y., 2020. Wrinkling of a compressed hyperelastic half-space with localized surface imperfec- tions. International Journal of Non-Linear Mechanics 126, 103576. 20
2020
-
[32]
On methods for bounding the overall properties of nonlinear composites
Willis, J.R., 1991. On methods for bounding the overall properties of nonlinear composites. J. Mech. Phys. Solids 39, 73–86
1991
-
[33]
Liquid metal-filled magnetorheological elastomer with positive piezoconductivity
Yun, G., Tang, S.Y., Sun, S., Yuan, D., Zhao, Q., Deng, L., Yan, S., Du, H., Dickey, M.D., Li, W., 2019. Liquid metal-filled magnetorheological elastomer with positive piezoconductivity. Nature Communications 10, 1300. 21
2019
Reviewed August 12, 2026 · model on record in the stance chip above.
Discussion (0). Continue with ORCID to comment.