REVIEW 3 major objections 6 minor 10 references
Minimal Acquisition Time Polarized Neutron Imaging of Current Induced Magnetic Fields in Superconducting Multifilamentary YBCO Tape
T0 review · 3 major / 6 minor · reviewed 2026-08-12 · deepseek-v4-flash
Pith's one-line read This paper demonstrates that a single low-acquisition-time polarization measurement can characterize internal magnetic fields and currents in a superconducting tape.
desk verdict A solid proof-of-principle for single-projection polarized neutron imaging of superconducting tapes; the damage maps are convincing, but the headline 5.4 A/filament screening current is a fitted number whose uncertainty is not under control. read the letter →
The pith
A machine-rendered reading of the paper's core claim, the machinery that carries it, and where it could break.
The reading
What carries the argument
The argument runs on the Larmor precession relation $\theta = \gamma t B$, which for a neutron of wavelength $\lambda$ becomes a linear wavelength dependence of the polarization angle with slope proportional to $\int B\,ds$. The measurement pipeline is: record spin-up and spin-down radiographs at a pulsed source, form $P=(\uparrow-\downarrow)/(\uparrow+\downarrow)$, normalize by the open beam, bin by wavelength, fit $\theta = a\lambda$, and extract the integrated field from the slope. For the current estimate, the authors assume a critical-state model of current flow in the superconductor, represent each filament's screening current as expanding rooftop-shaped square loops, compute the resulting magnetic field, and forward-simulate an idealized polarized neutron experiment with a Gaussian blur matched to the measured 0.96 mm blur. Matching the simulated maximum XY-polarization to the measured value (0.56) gives the $5.4\,\mathrm{A}$ per-filament estimate.
What would settle it
Measure a pristine multifilamentary YBCO tape with a known critical current using single-projection time-of-flight polarized neutron imaging, then compare the simulated screening-current estimate with the critical current obtained from transport or magnetization measurements; alternatively, perform a full 3D polarization tomography on the same damaged sample and check whether the integrated fields and inferred currents agree with the single-projection values.
Extended reading notes
Core claim
The central claim is that single-projection polarized neutron radiography of one spin component, combined with wavelength-resolved time-of-flight analysis, is sufficient to locate internal damage and quantify magnetic fields inside a superconductor carrying both a trapped field and a transport current. In the measured YBCO tape, the transport-current field and the trapped field produce opposite polarization signals, making them separable in a single radiograph. Fitting the wavelength dependence of the polarization angle gives integrated field strengths: $-2.11\,\mu\mathrm{T}\cdot\mathrm{m}$ for the trapped field and $1.26\,\mu\mathrm{T}\cdot\mathrm{m}$ for the transport current, after background correction. Simulating the trapped field with rooftop current loops in a critical-state model and matching the peak polarization to the measured value yields an estimated $5.4\,\mathrm{A}$ screening current per filament, far below the nominal $50\,\mathrm{A}$ capacity, which the authors interpret as evidence that damage has degraded the whole tape, not just the visibly reduced regions.
Load-bearing premise
The 5.4 A per-filament estimate rests on the assumption that the simplified forward model—idealized rooftop current loops, Gaussian blur, no beam divergence, and background subtraction as the only systematic correction—reproduces the true screening-current geometry closely enough; the paper's own check using a 1 A transport current produced simulated integrated fields about 30% lower than measured.
Editorial extensions
If this is right
- Internal damage in a superconducting tape can be located from a single radiograph, because the technique probes internal magnetic fields rather than surface structure.
- Time-of-flight analysis of a single polarization component provides quantitative integrated field strengths with a short acquisition time, without full tomography.
- Screening-current magnitudes cannot be read directly from polarization images; they require a forward model of the current distribution, as the paper demonstrates.
- The estimated $5.4\,\mathrm{A}$ per filament, compared with the nominal $50\,\mathrm{A}$, implies that the damage seen in the image affects the current-carrying capability of the entire tape, not just the most visibly degraded areas.
Reading between the lines
- With a calibration measurement on a pristine sample of known critical current, this single-projection method could develop into a routine quality-control tool for coated-conductor tapes, catching internal damage that surface inspection misses.
- The paper's own validation run, where a simulated 1 A transport current gave integrated fields about 30% lower than measured, suggests that refining the forward model to include beam divergence and local critical-current variation would convert that discrepancy into a quantitative uncertainty budget.
- The same minimal-acquisition approach could be extended to other current-carrying systems, such as superconducting cables or operating magnets, where full 3D polarization tomography is impractical.
Editorial analysis
A structured set of objections, weighed in public.
Referee Report
Summary. The manuscript reports a polarized neutron imaging (PNI) study of a multifilamentary YBCO tape that contains a trapped magnetic field and carries a 1 A transport current. Using a single polarization component and time-of-flight analysis, the authors identify regions of internal damage from the trapped-field image, extract integrated magnetic field values for three regions of interest, and estimate the per-filament screening current by simulating the experiment with a Bean/rooftop model and tuning the current until the simulated peak polarization matches the measured value, yielding 5.4 A per filament.
Significance. The qualitative result—that single-projection PNI can reveal internal damage in a superconducting tape—is convincing and useful, and the authors are transparent about the assumptions in their forward model and background correction. If the quantitative estimate were robust, the paper would demonstrate a fast screening capability for current-carrying superconductors. However, the headline value of 5.4 A per filament is the result of a one-parameter fit to a single scalar data point, and the model's own validation run shows a roughly 30% discrepancy in integrated field. These issues do not invalidate the qualitative contribution but they do mean the central quantitative claim is not yet supported with the needed uncertainty analysis.
major comments (3)
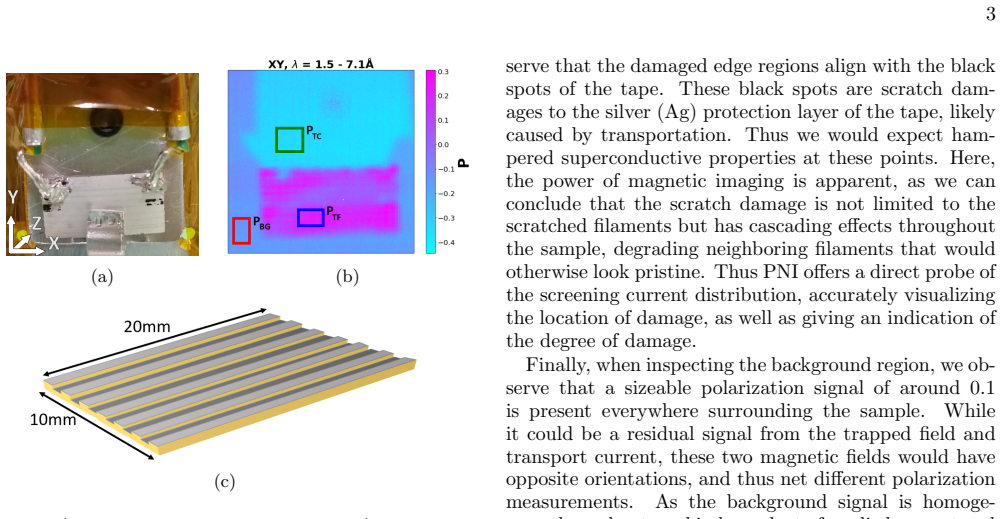
- [III.C] The 5.4 A per-filament screening current is obtained by tuning the simulated current until the simulated maximum XY polarization equals the measured maximum of 0.56. This is a one-parameter fit to a single scalar value. Because the trapped-field image (Fig. 1b) is visibly inhomogeneous, a single uniform current per filament is an effective model parameter rather than a uniquely determined integrated screening current. No sensitivity analysis or uncertainty estimate is provided for 5.4 A, and the spatial inhomogeneity means the fitted value could be consistent with a wide range of true local current distributions. The paper should report a range of plausible currents under different model assumptions and clearly state whether 5.4 A is an upper bound, a mean, or an effective value.
- [IV] The validation run for a 1 A transport current produced simulated integrated field strengths about 30% lower than the measured values. Since the same forward model (Gaussian blur, no beam divergence, ideal geometry) is used for the trapped-field simulation, this ~30% discrepancy is a direct indication of model bias that should be propagated into the uncertainty of the inferred 5.4 A value. The authors acknowledge the discrepancy in the discussion but do not correct for it or include it in the uncertainty of the headline estimate. At minimum, the conclusion should state that the true screening current is uncertain by a factor comparable to the validation discrepancy, and the analysis should be repeated with a bias-corrected forward model.
- [III.B] The background correction subtracts the background polarization bin-by-bin. However, the precession angle from the combined sample and background fields is the sum of the individual precession angles, while the polarization is a sinusoidal function of that angle (Eqs. (2)-(4)). Subtracting polarization values is therefore not equivalent to removing the background field contribution, even approximately, unless the angles are small and the field directions are known. With a background polarization of about 0.1, this approximation introduces a systematic error in the extracted integrated fields that is not quantified. The authors should either perform the correction at the level of precession angles after accounting for the background field direction, or justify the linearization with a numerical estimate of its effect.
minor comments (6)
- [V] In the Conclusion, the phrase 'an approximate value of of 5.4 A' contains a duplicated 'of'; remove the repetition.
- [III.A] The notation for the regions of interest is inconsistent: the figure caption uses PTC, PTF, PBG, while the text uses 'PT C', 'PT F', 'PBG'. Unify the subscript formatting.
- [III.B] The sign convention of the extracted integrated field values in Table I deserves clarification: the transport-current region gives a negative value and the trapped-field region a positive value, but the text describes the two signals as having opposite orientations relative to the polarization axis. A short statement connecting the sign of the slope to the sign of Bz along the neutron path would prevent confusion.
- [I] In Eq. (5), the index i on θi is not defined. Since the equation is used for the XY polarization component later, define i as the incoming polarization direction or remove the subscript.
- [II] The text states that spin up/down open-beam measurements for the YY polarization were acquired for 2700 s each, while the sample measurements are for XY polarization. The relationship between this calibration and the sample polarization component should be stated more explicitly.
- [III.C] Figure 4 shows the simulated and measured trapped-field images, but the color scale or normalization is not described. Without this information, the claimed 'structural agreement' is difficult for the reader to assess quantitatively.
Circularity Check
The 5.4 A/filament screening-current estimate is a fit parameter tuned to reproduce the measured maximum polarization, not an independent prediction.
-
fitted input called prediction
[Section III.C, 'Simulation of current distribution', paragraph beginning 'Tuning the simulated current strength...']
"Tuning the simulated current strength until the simulated polarization agrees with the background corrected measurements of the exclusively trapped magnetic field, we can retrieve an estimate for the current strength generating the trapped field during the experiment. ... using a total loop current of 5.4 A pr filament, we retrieved a maximum XY-polarization of 0.56, which was equal to the largest experimental value measured."
The headline quantitative result, 5.4 A per filament, is the free parameter of the forward model, adjusted until the simulated maximum XY polarization equals the measured maximum of 0.56. It is therefore not derived from a first-principles prediction or measured independently; it is a best-fit input chosen to reproduce the single most salient data point. The paper's own wording confirms this: 'Tuning the simulated current strength until ... agrees' and 'equal to the largest experimental value measured.' No separate prediction, no sensitivity range, and no per-filament degrees of freedom are given despite visible spatial inhomogeneity.
full rationale
The paper's ToF-based integrated field values (Table I) are legitimate direct measurements derived from the physical relation theta = a*lambda, and the qualitative damage identification is an independent visual observation. However, the central quantitative claim of 5.4 A/filament screening current is obtained by tuning the simulation's current until the simulated maximum polarization matches the measured maximum. This is pattern 2 (fitted input called prediction): the parameter is fitted to the data and then presented as the result. The forward model adds physical content, so the circularity is partial rather than total, but the headline estimate reduces to a one-number best fit with no independent verification and with acknowledged ~30% model underestimation in the analogous transport-current check. Self-citations to [4] and [5] for sample geometry and critical current are external characterizations and are not load-bearing in a circular way. Overall score 6 reflects partial circularity: a central 'prediction' reduces by construction to a fitted parameter.
Assumptions & free parameters
free parameters (2)
- Per-filament screening current I_fil =
5.4 A
- Gaussian blur sigma =
3.4 pixels (0.96 mm)
assumptions (5)
- domain assumption Bean critical-state model with full field penetration at 1 T
- domain assumption Rooftop model represents screening currents as expanding square loops
- domain assumption Forward model neglects beam fluctuations and divergence, approximated by a Gaussian blur
- ad hoc to paper The homogeneous background polarization is the only systematic error and can be subtracted bin-by-bin
- standard math Weak-field linear precession relation and single-component polarization analysis (Eq. 5)
Cite this review
Pith. "Pith review of Minimal Acquisition Time Polarized Neutron Imaging of Current Induced Magnetic Fields in Superconducting Multifilamentary YBCO Tape." pith.science (2026). https://pith.science/paper/24OCBT3H
@misc{pith2026241116473,
  author       = {Pith},
  title        = {Pith review of: Minimal Acquisition Time Polarized Neutron Imaging of Current Induced Magnetic Fields in Superconducting Multifilamentary YBCO Tape},
  year         = {2026},
  howpublished = {\url{https://pith.science/paper/24OCBT3H}},
  note         = {Machine review of arXiv:2411.16473}
}
read the original abstract
In this paper we showcase the strengths of polarized neutron imaging as a magnetic imaging technique through a case study on field-cooled multifilamentary YBCO tape carrying a transport current while containing a trapped magnetic field. The measurements were done at J-PARC's RADEN beamline, measuring a radiograph of a single polarization component, to showcase the analysis potential with minimal acquisition time. Regions of internal damage are easily and accurately identified as the technique probes the internal magnetic field of the sample, thereby avoiding surface-smearing effects. Quantitative measurements of the integrated field strength in various regions are acquired using time-of-flight information. Finally, we estimate the strength of the screening currents in the superconductor during the experiment by simulating an experiment with a model sample and comparing it to the experimental data. With this, we show that polarized neutron imaging is not only a useful tool for investigating magnetic structures but also for investigating samples carrying currents.
Figures


Reference graph
Works this paper leans on
-
[1]
N. Kardjilov, I. Manke, M. Strobl, A. Hilger, W. Treimer, M. Meissner, T. Krist, and J. Banhart, Three- dimensional imaging of magnetic fields with polarized neutrons, Nature Physics 4, 10.1038/nphys912 (2008)
-
[2]
M. Sales, M. Strobl, T. Shinohara, A. Tremsin, L. T. Kuhn, W. R. B. Lionheart, N. M. Desai, A. B. Dahl, and S. Schmidt, Three dimensional polarimetric neu- tron tomography of magnetic fields, Scientific Reports 8, 10.1038/s41598-018-20461-7 (2018)
-
[3]
M. Busi, E. Polatidis, S. Samothrakitis, P. K¨ ohnen, F. Malamud, C. Haase, and M. Strobl, 3d characteri- zation of magnetic phases through neutron polarization contrast tomography, Additive Manufacturing Letters 6, 10.1016/j.addlet.2023.100155 (2023)
arXiv 2023
-
[4]
A. C. Wulff, A. B. Abrahamsen, and A. R. Insinga, Mul- tifilamentary coated conductors for ultra-high magnetic field applications, Superconductor Science and Technol- ogy 34, 10.1088/1361-6668/abee2b (2021)
-
[5]
A. Insinga, M. Solovyov, A. Usoskin, A. Rutt, U. Betz, J. H. Lundeman, A. B. Abrahamsen, J. C. Grivel, F. Gomory, and A. C. Wulff, Lift- factor analysis of multifilamentary coated conductor produced using two level undercut-profile substrates, IEEE Transactions on Applied Superconductivity 29, 10.1109/TASC.2019.2896463 (2019)
-
[6]
T. Shinohara, K. Hiroi, Y. Su, T. Kai, T. Nakatani, K. Oikawa, M. Segawa, H. Hayashida, J. D. Parker, Y. Matsumoto, S. Zhang, and Y. Kiyanagi, Polarization analysis for magnetic field imaging at raden in j-parc/mlf, Journal of Physics: Conference Series 862, 10.1088/1742- 6596/862/1/012025 (2017)
doi:10.1088/1742- 2017
-
[7]
A. S. Tremsin, J. B. McPhate, J. v. Vallerga, O. H. W. Siegmund, J. S. Hull, W. B. Feller, and E. Lehmann, De- tection efficiency, spatial and timing resolution of thermal and cold neutron counting mcp detectors, Nuclear In- struments and Methods in Physics Research, Section A: Accelerators, Spectrometers, Detectors and Associated Equipment 604, 10.1016/j...
-
[8]
C. P. Bean, Magnetization of high-field superconductors, Reviews of Modern Physics 36 (1964)
work page 1964
Show all 10 references
-
[9]
E. H. Brandt, Electric field in superconductors with rectangular cross section, Physical Review B 52, 10.1103/PhysRevB.52.15442 (1995)
1995 doi
-
[10]
Ortner and L
M. Ortner and L. G. Coliado Bandeira, Magpylib: A free python package for magnetic field computation, Soft- wareX 11, 10.1016/j.softx.2020.100466 (2020)
2020
Reviewed August 12, 2026 · model on record in the stance chip above.
Discussion (0). Continue with ORCID to comment.