REVIEW 5 major objections 8 minor 34 references
Modelling to Generate Continuous Alternatives: Enabling Real-Time Feasible Portfolio Generation in Convex Planning Models
T0 review · 5 major / 8 minor · reviewed 2026-08-12 · deepseek-v4-flash
Pith's one-line read The paper shows that previously computed MGA results can be turned into a continuous, live-explorable space of feasible portfolios by interpolating over the convex hull of the iterates.
desk verdict A sound convex-combination post-processing method for MGA, but several claims about coverage and budget interpolation outrun the evidence. read the letter →
The pith
A machine-rendered reading of the paper's core claim, the machinery that carries it, and where it could break.
The reading
What carries the argument
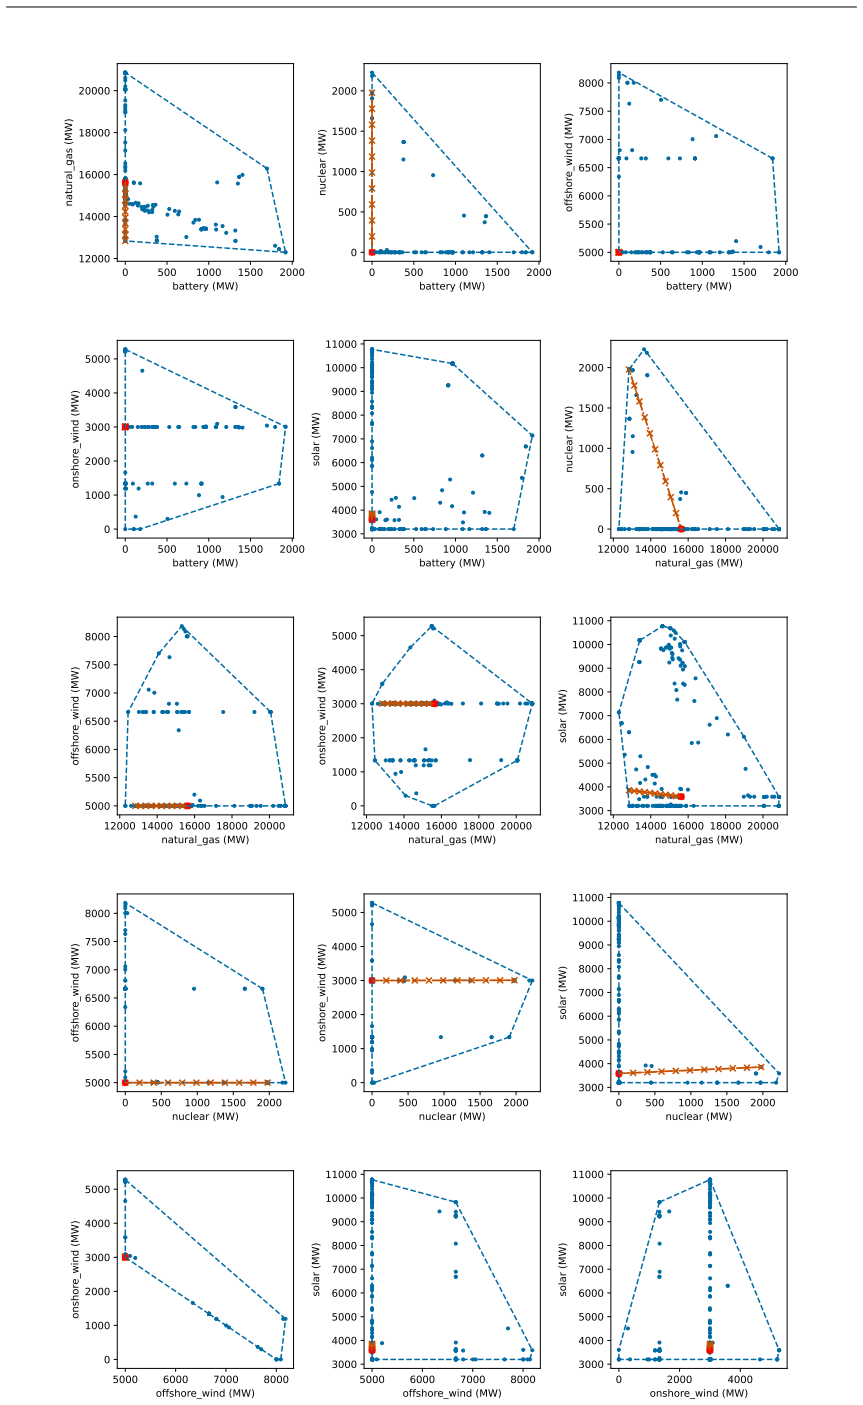
The central object is the convex hull exploration problem (Eq. 6), a small linear or convex program over the MGA-iterate weights $\lambda$ that produces a point $z_k = \lambda^T Z$ inside the hull, subject to user-added inequalities $Az_k \le b$. Its companion identity is Eq. 7, the scalar-product property $c^T(\sum_i \lambda_i x_i) = \sum_i \lambda_i (c^T x_i)$, which lets affine capacity metrics be evaluated exactly by the same weights. Dimensionality reduction first projects each MGA solution onto selected capacity decisions and linear metrics, shrinking a model with $O(N \times T)$ operational variables to one with $O(N)$ entries, which is what makes interactive solve times possible.
What would settle it
Take a convex capacity-planning LP, run MGA once with a deliberately small or one-sided set of iterates that provably miss a known portion of the near-optimal region, then use MGCA to generate portfolios and Pareto frontiers there; if the omitted portfolios never appear or the frontiers stop short of known feasible extremes, the method is shown to be limited by the seed set. Alternatively, export the 50 interpolated portfolios to the full economic-dispatch model and tally errors: if substantially more than a small fraction of operational-metric interpolations exceed the reported 10 percent gap, the accuracy claim as stated fails.
Extended reading notes
Core claim
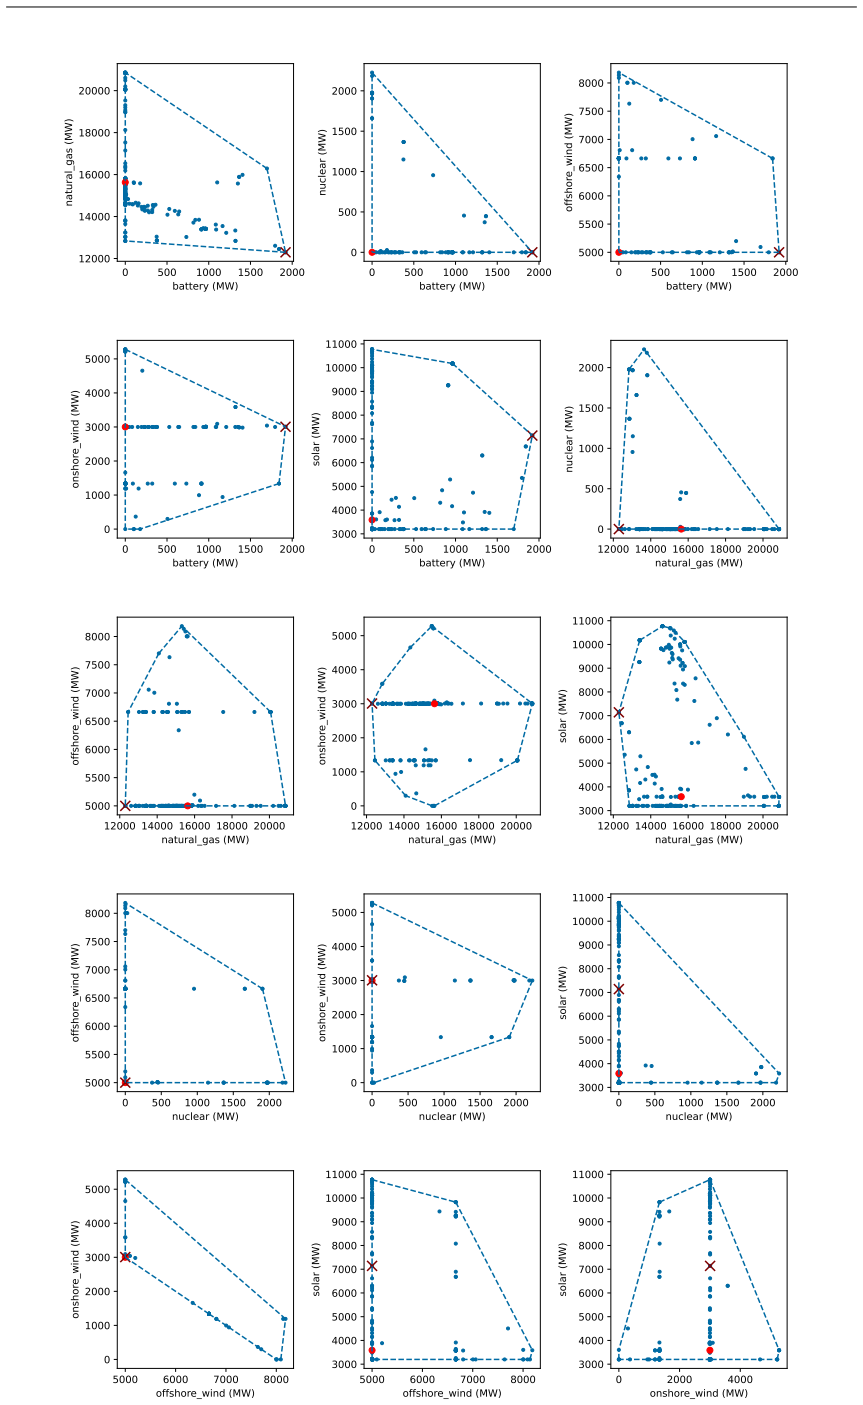
MGCA's central claim is that the near-optimal feasible region of a convex capacity-planning model, once approximated by MGA iterates, can be treated as the convex hull of those iterates in a reduced capacity-and-metric subspace. Inside that hull, any convex combination of stored vertices is a feasible, within-budget portfolio, so a user can generate new plans anywhere in the space by solving a small optimization problem over the weights, with user-specified objectives and constraints, rather than re-running the large model. Affine functions of capacity decisions, including many outcome metrics, are then exactly recoverable from the weights, while generation-based operational metrics are interpolated to feasible values that a full economic dispatch would improve or match; the paper reports interpolated metric values generally within 10 percent of the optimal value. The method also supports synthesizing tighter-budget results, approximating Pareto frontiers between metrics, and exporting chosen capacity portfolios back to the full capacity-expansion model to obtain least-cost operational details.
Load-bearing premise
The load-bearing premise is that the set of MGA iterates collected as vertices spans the near-optimal feasible region well enough that its convex hull stands in for the true region; if large parts of the region are missed, every generated portfolio, budget interpolant, and Pareto frontier is confined to an inner approximation.
Editorial extensions
If this is right
- Stakeholders can explore near-optimal energy plans interactively, imposing constraints such as a cap on gas capacity or a farmland-preservation objective and seeing the feasible remainder in under a second.
- Budget analysis at multiple cost slacks can be produced from one MGA run by interpolating each iterate toward the least-cost point, instead of re-running the planning model at each budget.
- Pareto-frontier-style trade-off curves between any pair of outcome metrics can be approximated in post-processing with an epsilon-constraint method over the hull.
- Any generated portfolio can be exported and re-solved with the full capacity-expansion model at fixed capacities, so operational metrics reflect least-cost dispatch rather than the interpolation estimate.
- Because the exploration problem has only a few hundred variables, nonlinear convex objectives can be used in the live search.
Reading between the lines
- In our reading, the same convex-hull machinery transfers to any linear program with a large near-optimal set, such as water-resource or supply-chain planning, where stakeholders also need to see alternatives rather than a single optimum.
- If the interpolation accuracy holds at scale, interactive decision-support dashboards could let opposing stakeholders co-design compromises directly, replacing the current workflow of pre-computing and hand-picking discrete MGA results.
- A natural stress test would be to seed MGCA with deliberately adversarial or sparse MGA iterates and measure how much of the true near-optimal region is missed; the paper's guarantees are conditional on the seed set spanning the space.
- The 10 percent accuracy figure is a demonstration on one test case, not a proven bound, so users would need case-specific validation before relying on interpolated operational metrics for regulatory decisions.
Editorial analysis
A structured set of objections, weighed in public.
Referee Report
Summary. The paper proposes 'Modelling to Generate Continuous Alternatives' (MGCA), a post-processing method for linear-programming capacity expansion models. After an MGA exploration has produced a finite set of near-optimal capacity solutions, MGCA projects those solutions onto a subspace of capacity decisions and outcome metrics, then treats the resulting points as vertices of a convex hull. The method (i) generates new portfolios as convex combinations of these vertices, (ii) solves a small optimization problem (Eq. 6) over this hull so that users can impose objectives and additional constraints, (iii) computes affine capacity metrics exactly and operational metrics by convex interpolation, and (iv) exports chosen portfolios back to the full CEM for least-cost dispatch. The demonstrations on a three-zone GenX ISONE case show sub-second solve times for the reduced problems, including budget interpolation, constrained exploration, Pareto-front approximation, and re-dispatch of 50 interpolated portfolios. The paper also reports that interpolated operational metrics are generally within about 5-10% of the full-CEM re-solve values for the tested points.
Significance. If the claims are properly qualified, MGCA is a useful and practical methods contribution. The central convexity argument is correct for LP planning models: convex combinations of feasible, within-budget iterates are feasible and within budget, and affine capacity metrics are exactly interpolated. The dimensionality reduction to capacity decisions and metrics is simple but effective, and the reported speedups (sub-second post-processing versus hundreds of seconds per MGA iterate) are credible and potentially valuable for interactive stakeholder tools. The paper uses an open-source model (GenX) and openly describes the demonstration case, which supports reproducibility. The main weaknesses are overstatements about the convex hull of computed iterates representing the near-optimal feasible region, the claim in Section 3.3 that pairwise budget interpolation represents the lower-budget convex hull, and the limited scope of the accuracy test that underlies the abstract's 'within 10%' claim. These issues are fixable in revision and do not invalidate the core method.
major comments (5)
- [Section 2.2 and 2.3] The paper does not consistently state that all MGCA outputs live in conv(Z), the convex hull of the computed MGA iterates, and that conv(Z) is generally an inner approximation of the full near-optimal feasible region. Section 2.2 says the projected points 'can then be used as vertices for the convex hull of the near-optimal feasible region of the planning problem,' but this is only true if the MGA iterates actually span that region. Equation (6) optimizes over conv(Z), so if the user's true optimum lies outside this hull, the returned point is the best hull point, not the best near-optimal portfolio. The paper does acknowledge this later in Section 3.5 ('likely to not include the true optimal solution') and recommends bracketing runs in Section 3.2, but the abstract and introduction would mislead readers who do not reach those sections. Please add an explicit statement in the abstract and in Section 2 that the method operates on the convex hull of computed iterates and that coverage of the near-optimal region is an input assumption that must be verified.
- [Section 3.3, Figures 5-6] The budget-interpolation demonstration is overstated. The procedure of combining each MGA iterate with the least-cost solution at weight 0.6 produces only the union of line segments between the least-cost point and each iterate, a homothetic subset of the 10% hull. This does not, in general, 'represent the convex hull of the feasible region within this tighter constraint,' because other constraints besides the cost budget shape the lower-budget slice of conv(Z). A point with cost at 6% slack can lie outside the union of these segments. To explore the full 6% budget slice, one should solve Eq. (6) with the additional cost constraint; the pairwise interpolation should be described as a rapid approximation or a partial sample, not as the convex hull of the lower-budget feasible region.
- [Section 3.6 and Abstract] The headline accuracy claim is not supported by the experiment as described. The n=50 interpolates in Section 3.2 are random convex combinations of only 4 exterior points, i.e., points in a 3-simplex inside the 14-dimensional reduced space. Section 3.6 compares the metric values of these interpolates against the full-CEM re-solve of the same portfolios, which measures interpolation error for those specific points but does not compare against the true optimum of any user objective, nor does it test the hull's coverage of the near-optimal region. The abstract's phrase 'within 10% of the optimal value' should be replaced with a more precise statement, for example 'within 10% of the full-CEM re-solve value for the tested interpolated portfolios,' and the text should note that the test is confined to a small simplex and cannot bound errors elsewhere in the hull.
- [Section 2.3, Eq. (6)] Equation (6) contains undefined notation: the term 'lambda^T Z X' uses 'X' without definition, and the preceding text says 'z = lambda^T Z' while earlier Z is defined as a subspace. The model size stated ('2m variables and 3n+d+1 constraints') also does not match the displayed problem, which has n+m variables and n+1+d+m+n constraints (depending on how variable bounds are counted). Please correct the equation, define all symbols, and fix the complexity statement so readers can rely on the claimed dimensionality reduction.
- [Section 2.4] The statement that an interpolated operational metric is 'a feasible value within the convex hull of those found through the full model with economic dispatch' is imprecise. A convex combination of scalar metric values is not itself a feasible decision in the original model; it is simply an interpolation of the vertex values. The paper already notes that operational metrics 'will not match economic dispatch' and that 'no guarantee of lower overall system metric values is possible,' which is the correct caveat. The wording about feasibility of the interpolated metric should be revised to avoid implying that the interpolated scalar is a feasible outcome of the optimization model.
minor comments (8)
- [Section 2.1] Typo: 'constraint coefficient matricies' should be 'matrices'.
- [Section 3.2] Typo: 'analagous' should be 'analogous'.
- [Section 3.1] Please state explicitly the dimension of the reduced space used in the demonstration (12 technology capacity aggregates plus 2 system metrics = 14) and clarify that the convex hull and all interpolations are performed in this full 14-dimensional space, while Figures 2-7 show only pairwise 2D projections.
- [Section 3.3] The text says the budget interpolation 'of all solutions computed in 0.35 seconds'; for reproducibility, please clarify how many solutions were interpolated and whether this includes the time to generate Figure 5 and Figure 6.
- [Section 3.6, Figures 10-11] The vertical axes are labeled 'Percent Difference' and 'Difference in Zonal Percent Share'; please state clearly whether the latter is in percentage points, and report the n=50 sample size in the figure captions.
- [Section 2.3] The claim that the exploration problem 'will, by definition, always find an exterior solution' is acceptable for a linear objective over a polytope if 'exterior' means a vertex, but the wording is confusing because vertices of conv(Z) are the original MGA iterates only if the iterates are not redundant; please clarify the intended meaning.
- [Section 3.5] The sentence 'This Pareto frontier is may not be identical' contains a grammatical error; please rephrase as 'This Pareto frontier may not be identical to a similar Pareto frontier calculated on the original space.'
- [General] The paper relies on the companion paper Lau, Patankar, and Jenkins (2024) for the quality of the MGA exploration; please cite a published version if one exists, or add a note that the companion is under review, since the coverage assumptions in the main paper depend on it.
Circularity Check
No significant circularity: MGCA's outputs are convex combinations of externally supplied MGA iterates, and the claimed metric properties follow from convexity and are validated against full CEM re-solves.
full rationale
The derivation chain is: (i) a set of MGA iterates Z is generated externally and projected; (ii) the exploration problem (Eq. 6) restricts z to conv(Z), so every output is by construction a convex combination; (iii) Eq. 7 is the linearity identity for affine capacity metrics, not a fitted prediction; (iv) operational-metric estimates are explicitly acknowledged as interpolations, and Section 3.6 compares them against full GenX re-solves, an external benchmark. The budget-interpolation example constructs 6%-cost points by choosing weights so the affine cost equals the target; the individual cost values are therefore exact by construction, but the paper's broader claim to represent the lower-budget hull is a coverage/approximation limitation, not a circular reduction. Self-citations to Lau, Patankar and Jenkins [11] describe how to obtain diverse MGA inputs and are not used to prove the convexity results; the central mathematical content is independent of that citation. No fitted parameter is renamed as a prediction, no uniqueness theorem is imported, and the paper explicitly discloses that the Pareto frontier and hull are constrained by the computed iterates and may not contain the true optimum. Thus no circular step is present.
Assumptions & free parameters
free parameters (3)
- MGA budget slack epsilon =
10% (0.10)
- Number of MGA iterates =
200
- Metric aggregation scheme =
12 technology capacities (summed across zones) plus system cost and emissions
assumptions (4)
- domain assumption The capacity expansion and dispatch model (1) is a linear program, so its feasible set is convex.
- domain assumption The set of MGA iterates adequately explores the near-optimal feasible region, so their convex hull approximates it well.
- domain assumption Metrics of interest are linear (affine) functions of capacity and operational decisions.
- standard math The economic dispatch value function is convex, so interpolated operational cost overestimates the true least-cost value.
Cite this review
Pith. "Pith review of Modelling to Generate Continuous Alternatives: Enabling Real-Time Feasible Portfolio Generation in Convex Planning Models." pith.science (2026). https://pith.science/paper/WQ5FP4IO
@misc{pith2026241116887,
  author       = {Pith},
  title        = {Pith review of: Modelling to Generate Continuous Alternatives: Enabling Real-Time Feasible Portfolio Generation in Convex Planning Models},
  year         = {2026},
  howpublished = {\url{https://pith.science/paper/WQ5FP4IO}},
  note         = {Machine review of arXiv:2411.16887}
}
read the original abstract
Decarbonization provides new opportunities to plan energy systems for improved health, resilience, equity, and environmental outcomes, but challenges in siting and social acceptance of transition goals and targets threaten progress. Modelling to Generate Alternatives (MGA) provides an optimization method for capturing many near-cost-optimal system configurations, and can provide insights into the tradeoffs between objectives and flexibility available in the system. However, MGA is currently limited in interactive applicability to these problems due to a lack of methods for allowing users to explore near-optimal feasible spaces. In this work we describe Modelling to Generate Continuous Alternatives (MGCA), a novel post-processing algorithm for convex planning problems which enables users to rapidly generate new interior solutions, incorporate new constraints, and solve within the space with convex objectives. MGCA begins with a dimensionality reduction to capacity decisions and metric values. We then take advantage of convex combinations to generate interior points by allowing user weight specification and encoding convex combinations in an optimization problem with user-defined additional constraints and objective. Dimensionality reduction enables this problem to solve in tenths of a second, suitable for analysis in interactive settings. We discuss the interpolation of capacity and operational metric values, finding capacity metrics can be perfectly interpolated while operational metrics remain within the feasible range of the points used to create them. We demonstrate interpolated solutions can be exported and re-solved with an economic dispatch model to provide operational metric values consistent with least-cost decision-making and show interpolated metric values are generally within 10% of the optimal value.
Figures


Figures from the paper (9 more)





Reference graph
Works this paper leans on
-
[1]
Impacts of power sector model features on opti- mal capacity expansion: A comparative study
Jonas van Ouwerkerk et al. “Impacts of power sector model features on opti- mal capacity expansion: A comparative study”. In:Renewable and Sustainable Energy Reviews 157 (Apr. 2022), p. 112004.issn: 1364-0321. doi: 10.1016/ j.rser.2021.112004 . url: https://www.sciencedirect.com/science/ article/pii/S1364032121012673 (visited on 06/10/2024)
arXiv 2022
-
[2]
Jesse D. Jenkins and Nestor Sepulveda. “Enhanced decision support for a changing electricity landscape: the GenX configurable electricity resource ca- pacity expansion model.” Working Paper. 2017.url: https://dspace.mit. edu/handle/1721.1/130589
work page 2017
-
[3]
Using modeling to generate alternatives (MGA) to expand our thinking on energy futures
Joseph F. DeCarolis. “Using modeling to generate alternatives (MGA) to expand our thinking on energy futures”. In: Energy Economics 33.2 (Mar. 2011), pp. 145–152. issn: 0140-9883. doi: 10 . 1016 / j . eneco . 2010 . 05
work page 2011
-
[4]
url: https : / / www . sciencedirect . com / science / article / pii / S0140988310000721
-
[5]
Does cost optimization approximate the real-world en- ergy transition?
Evelina Trutnevyte. “Does cost optimization approximate the real-world en- ergy transition?” In: Energy 106 (July 2016), pp. 182–193.issn: 0360-5442. doi: 10.1016/j.energy.2016.03.038. url: https://www.sciencedirect. com/science/article/pii/S0360544216302821 (visited on 09/08/2023)
-
[6]
Jan-Philipp Sasse and Evelina Trutnevyte. “Distributional trade-offs between regionally equitable and cost-efficient allocation of renewable electricity gen- eration”. In:Applied Energy 254 (Nov. 2019), p. 113724.issn: 0306-2619.doi: 10.1016/j.apenergy.2019.113724 . url: https://www.sciencedirect. com/science/article/pii/S0306261919314114 (visited on 09/08/2023)
arXiv 2019
-
[7]
Tim T. Pedersen et al. “Using Modeling All Alternatives to explore 55% de- carbonization scenarios of the European electricity sector”. In:iScience 26.5 (May 2023), p. 106677. issn: 2589-0042. doi: 10 . 1016 / j . isci . 2023 . 106677. url: https://www.sciencedirect.com/science/article/pii/ S258900422300754X (visited on 09/08/2023)
work page 2023
-
[8]
The sensitivity of power system expansion models
Bruno U. Schyska et al. “The sensitivity of power system expansion models”. In: Joule 5.10 (Oct. 2021), pp. 2606–2624. issn: 2542-4351. doi: 10.1016/ j.joule.2021.07.017 . url: https://www.sciencedirect.com/science/ article/pii/S254243512100355X (visited on 06/17/2024)
work page 2021
Show all 34 references
-
[9]
A review of approaches to uncertainty assessment in energy system optimization models
Xiufeng Yue et al. “A review of approaches to uncertainty assessment in energy system optimization models”. In: Energy Strategy Reviews 21 (Aug. 2018), pp. 204–217. issn: 2211-467X. doi: 10 . 1016 / j . esr . 2018 . 06
2018
-
[10]
sciencedirect
url: https : / / www . sciencedirect . com / science / article / pii / S2211467X18300543 (visited on 06/17/2024)
2024
-
[11]
A review of multi-objective optimization: Methods and its applications
Nyoman Gunantara. “A review of multi-objective optimization: Methods and its applications”. In:Cogent Engineering 5.1 (Jan. 2018). Ed. by Qingsong Ai. Publisher:CogentOA_eprint:https://doi.org/10.1080/23311916.2018.1502242, p. 1502242. issn: null. doi: 10.1080/23311916.2018.15...
2018
-
[12]
Context-Specific Energy Strategies: Coupling En- ergy System Visions with Feasible Implementation Scenarios
Evelina Trutnevyte et al. “Context-Specific Energy Strategies: Coupling En- ergy System Visions with Feasible Implementation Scenarios”. en. In:Environ- mental Science & Technology 46.17 (Sept. 2012), pp. 9240–9248.issn: 0013- 936X, 1520-5851. doi: 10.1021/es301249p. url: http...
2012 doi
-
[13]
Michael Lau, Neha Patankar, and Jesse D. Jenkins. Measuring Exploration: Review and Systematic Evaluation of Modelling to Generate Alternatives Meth- ods in Macro-Energy Systems Planning Models . arXiv:2405.17342 [cs, eess, math]. Apr. 2024. doi: 10.5281/zenodo.11088681 . url:...
2024 arXiv
-
[14]
Modeling all alternative solutions for highly renewable energy systems
Tim T. Pedersen et al. “Modeling all alternative solutions for highly renewable energy systems”. en. In:Energy 234 (Nov. 2021), p. 121294.issn: 0360-5442. doi: 10.1016/j.energy.2021.121294. url: https://www.sciencedirect. com/science/article/pii/S0360544221015425 (visited on 1...
2021
-
[15]
Theoptimumisnotenough:Anear-optimalsolutionparadigm for energy systems synthesis
PhilipVolletal.“Theoptimumisnotenough:Anear-optimalsolutionparadigm for energy systems synthesis”. In:Energy 82 (Mar. 2015), pp. 446–456.issn: 0360-5442. doi: 10 . 1016 / j . energy . 2015 . 01 . 055. url: https : / / www . sciencedirect.com/science/article/pii/S03605442150007...
2015
-
[16]
Ensuring diversity of national energy scenarios: Bottom-up energy system model with Modeling to Generate Alternatives
Philip B. Berntsen and Evelina Trutnevyte. “Ensuring diversity of national energy scenarios: Bottom-up energy system model with Modeling to Generate Alternatives”. In: Energy 126 (May 2017), pp. 886–898.issn: 0360-5442. doi: 10.1016/j.energy.2017.03.043. url: https://www.scien...
2017 doi
-
[17]
The near-optimal feasible space of a re- newable power system model
Fabian Neumann and Tom Brown. “The near-optimal feasible space of a re- newable power system model”. en. In:Electric Power Systems Research 190 (Jan. 2021), p. 106690. issn: 0378-7796. doi: 10 . 1016 / j . epsr . 2020 . 106690. url: https://www.sciencedirect.com/science/articl...
2021
-
[18]
Balanc- ing GHG mitigation and land-use conflicts: Alternative Northern European energy system scenarios
Yi-kuang Chen, Jon Gustav Kirkerud, and Torjus Folsland Bolkesjø. “Balanc- ing GHG mitigation and land-use conflicts: Alternative Northern European energy system scenarios”. en. In:Applied Energy 310 (Mar. 2022), p. 118557. issn: 03062619. doi: 10 . 1016 / j . apenergy . 2022 ...
2022
-
[19]
Assessing stakeholder preferences on low-carbon energy transitions
Cristina Pizarro-Irizar et al. “Assessing stakeholder preferences on low-carbon energy transitions”. In: Energy Sources, Part B: Economics, Planning, and Policy 15.10-12(Dec.2020).Publisher:Taylor&Francis_eprint:https://doi.org/10.1080/15567249.2020.1812767, pp. 455–491. issn:...
2020
-
[20]
Modelling to generate alternatives: A technique toexploreuncertaintyinenergy-environment-economymodels
James Price and Ilkka Keppo. “Modelling to generate alternatives: A technique toexploreuncertaintyinenergy-environment-economymodels”.en.In: Applied Energy 195 (June 2017), pp. 356–369. issn: 0306-2619. doi: 10 . 1016 / j . apenergy.2017.03.065. url: https://www.sciencedirect....
2017
-
[21]
Diversity of op- tions to eliminate fossil fuels and reach carbon neutrality across the entire European energy system
Bryn Pickering, Francesco Lombardi, and Stefan Pfenninger. “Diversity of op- tions to eliminate fossil fuels and reach carbon neutrality across the entire European energy system”. In: Joule 6.6 (June 2022), pp. 1253–1276. issn: 2542-4351. doi: 10 . 1016 / j . joule . 2022 . 05...
2022
-
[22]
Decision Support Framework for Developing Regional Energy Strategies
Douglas L. Bessette, Joseph Arvai, and Victoria Campbell-Arvai. “Decision Support Framework for Developing Regional Energy Strategies”. In:Environ- mental Science & Technology 48.3 (Feb. 2014). Publisher: American Chemical Society, pp. 1401–1408. issn: 0013-936X. doi: 10 . 102...
2014 doi
-
[23]
Informed Public Choices for Low-Carbon Electricity Portfolios Using a Computer Decision Tool
Lauren A. (Fleishman) Mayer, Wändi Bruine de Bruin, and M. Granger Mor- gan. “Informed Public Choices for Low-Carbon Electricity Portfolios Using a Computer Decision Tool”. In:Environmental Science & Technology 48.7 (Apr. 2014). Publisher: American Chemical Society, pp. 3640–3...
2014 doi
-
[24]
Perspectives of Informed Citizen Panel on Low-Carbon Electricity Portfolios in Switzer- land and Longer-Term Evaluation of Informational Materials
Sandra P. Volken, Georgios Xexakis, and Evelina Trutnevyte. “Perspectives of Informed Citizen Panel on Low-Carbon Electricity Portfolios in Switzer- land and Longer-Term Evaluation of Informational Materials”. eng. In:En- vironmental Science & Technology 52.20 (Oct. 2018), pp....
2018 doi
-
[25]
Are interactive web-tools for envi- ronmental scenario visualization worth the effort? An experimental study on the Swiss electricity supply scenarios 2035
Georgios Xexakis and Evelina Trutnevyte. “Are interactive web-tools for envi- ronmental scenario visualization worth the effort? An experimental study on the Swiss electricity supply scenarios 2035”. In:Environmental Modelling & Software 119 (Sept. 2019), pp. 124–134.issn: 136...
2019 doi
-
[26]
The quickhull algorithm for convex hulls
C. Bradford Barber, David P. Dobkin, and Hannu Huhdanpaa. “The quickhull algorithm for convex hulls”. In:ACM Transactions on Mathematical Software 22.4(Dec.1996),pp.469–483. issn:0098-3500. doi: 10.1145/235815.235821. url: https : / / dl . acm . org / doi / 10 . 1145 / 235815 ...
1996
-
[27]
Policy Decision Support for Renewables Deploy- ment through Spatially Explicit Practically Optimal Alternatives
Francesco Lombardi et al. “Policy Decision Support for Renewables Deploy- ment through Spatially Explicit Practically Optimal Alternatives”. en. In: Joule 4.10 (Oct. 2020), pp. 2185–2207. issn: 2542-4351. doi: 10 . 1016 / j . joule . 2020 . 08 . 002. url: https : / / www . sci...
2020
-
[28]
Regional impacts of electricity system transition in Central Europe until 2035
Jan-Philipp Sasse and Evelina Trutnevyte. “Regional impacts of electricity system transition in Central Europe until 2035”. en. In:Nature Communica- tions 11.1 (Oct. 2020). Publisher: Nature Publishing Group, p. 4972.issn: 2041-1723. doi: 10.1038/s41467-020-18812-y. url: https...
2020 doi
-
[29]
Tsitsiklis.Introduction to linear optimization
Dimitris Bertsimas and John N. Tsitsiklis.Introduction to linear optimization. Athena Scientific series in optimization and neural computation. Belmont, Mass: Athena Scientific, 1997.isbn: 978-1-886529-19-9
1997
-
[30]
Vector analysis and an introduction to tensor analy- sis.2nded.Schaum’soutlineseries.OCLC:ocn244060713.NewYork:McGraw- Hill, 2009
Seymour Lipschutz et al. Vector analysis and an introduction to tensor analy- sis.2nded.Schaum’soutlineseries.OCLC:ocn244060713.NewYork:McGraw- Hill, 2009. isbn: 978-0-07-161545-7
2009
-
[31]
Jesse Jenkins et al. GenX. Aug. 2023.doi: 10.5281/zenodo.6229425. url: https://github.com/GenXProject/GenX
2023 doi
-
[32]
Gurobi Optimizer Reference Manual
Gurobi Optimization, LLC. Gurobi Optimizer Reference Manual . 2024. url: %22https://www.gurobi.com
2024
-
[33]
Basics of linear programming
Eiji Oki. “Basics of linear programming”. en. In: Book Title: Linear Program- ming and Algorithms for Communication Networks Edition: 0. CRC Press, Aug. 2012, pp. 19–38. isbn: 978-0-429-16516-0. doi: 10 . 1201 / b12733 - 4. url: https://www.taylorfrancis.com/books/978146655264...
2012
-
[34]
New epsilon-constraint methods for multi-objective integer linear program- ming: A Pareto front representation approach
Mariana Mesquita-Cunha, José Rui Figueira, and Ana Paula Barbosa-Póvoa. “New epsilon-constraint methods for multi-objective integer linear program- ming: A Pareto front representation approach”. In:European Journal of Op- erational Research 306.1 (Apr. 2023), pp. 286–307.issn:...
2023
Reviewed August 12, 2026 · model on record in the stance chip above.
Discussion (0). Continue with ORCID to comment.