REVIEW 3 major objections 4 minor 2 cited by
Thorium in Kilonova Spectra: Exploring the Heaviest Detectable Element
T0 review · 3 major / 4 minor · reviewed 2026-08-12 · deepseek-v4-flash
Pith's one-line read Thorium is the likely heaviest element whose signature can appear in kilonova spectra, showing up as a broad absorption trough near 18,000 Å under actinide-boosted conditions.
desk verdict Careful forward-modeling paper that turns a hint into a testable Th III prediction worth refereeing, but the factor-of-3 uncertainty in the input gf-values makes the quantitative threshold softer than the abstract claims. read the letter →
The pith
A machine-rendered reading of the paper's core claim, the machinery that carries it, and where it could break.
The reading
What carries the argument
The central machinery is a hybrid atomic line list for ions beyond the third r-process peak, anchored by experimentally calibrated data for Ra II and Ac III and by a set of near-infrared Th III transition probabilities estimated from measured relative intensities. The Th III estimates assume a single Boltzmann excitation temperature of $T=6000$ K, fixed by least-squares comparison between measured and calculated intensities of known optical lines. Under LTE, Saha–Boltzmann population statistics feed Sobolev optical depths for each bound-bound transition, and a Monte Carlo radiative transfer code converts those opacities into synthetic spectra. The decisive property is the temperature window: doubly ionized thorium exists over a narrower temperature range than doubly ionized cerium, so the near-infrared trough appears only while the photosphere stays near 5000–7000 K, which sets both the early observing epoch and the strict upper limit on the lanthanide fraction.
What would settle it
Measure the oscillator strengths of the Th III lines near 18,000 Å in the laboratory. If the true values are more than a factor of three smaller than the estimates used here, the required thorium fraction would exceed the actinide-boost range and the predicted trough would not appear, while a high signal-to-noise, space-based spectrum of a suitable kilonova at 1–2.5 days that shows no trough at 18,000 Å despite an inferred actinide-boost composition would also rule the prediction out.
Extended reading notes
Core claim
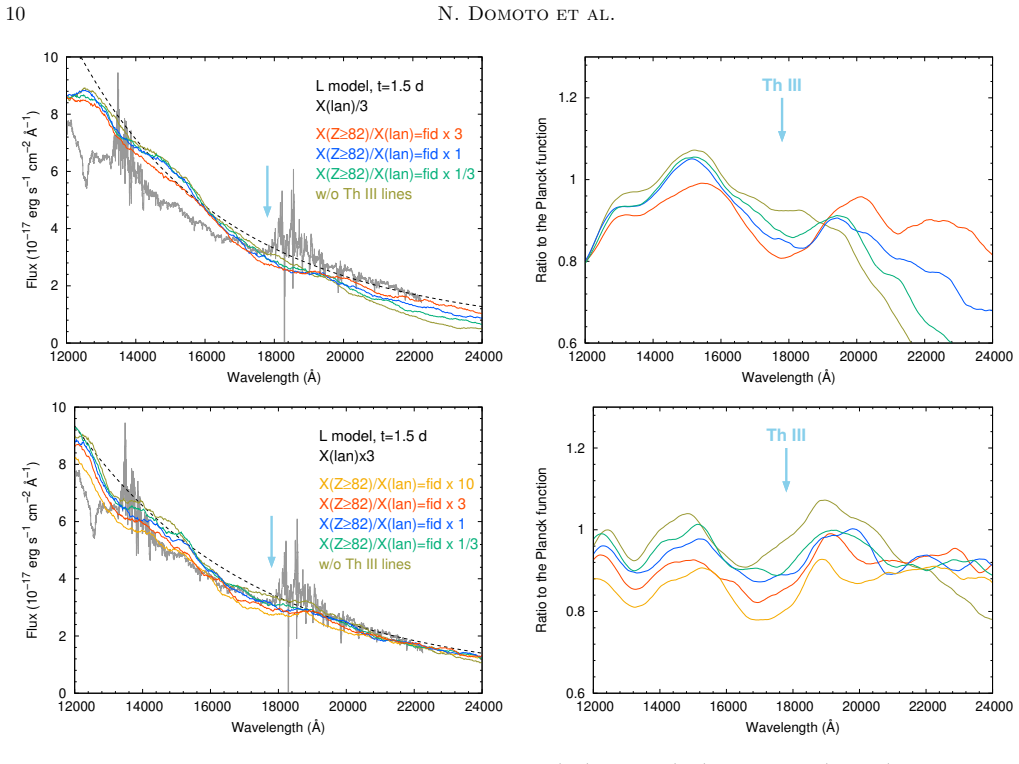
On the paper's own terms, the discovery is that Th III is the most promising actinide for kilonova spectroscopy because its dense low-lying $5f$-shell energy levels place many allowed transitions at 10,000–25,000 Å with relatively large estimated oscillator strengths. In the authors' radiative transfer models these lines blend into a broad absorption feature near 18,000 Å. The feature appears when the line-forming region has a lanthanide mass fraction $X_{\rm lan}\lesssim 6\times10^{-4}$ and an actinide-to-lanthanide ratio at least as large as the solar r-process ratio, and it fades as the ejecta cools below the temperature window where Th III survives. The authors therefore conclude that detecting this feature would be unambiguous evidence of actinide nucleosynthesis in neutron star mergers, and that the most likely hosts are mergers of unequal-mass neutron stars or black hole-neutron star binaries.
Load-bearing premise
The detection threshold rests on near-infrared transition strengths for Th III that have never been directly measured; they are recovered from laboratory relative intensities by assuming a single excitation temperature, and the calibration scatter is about a factor of three.
Editorial extensions
If this is right
- A space-based or high-altitude spectrum of a neutron star merger at 1–2.5 days, showing a broad absorption trough near 18,000 Å, would be direct spectroscopic evidence that actinides are synthesized in the event.
- The feature is short-lived in the models: it is present from about one day after the merger and fades by about 3.5 days, so early near-infrared follow-up is essential.
- The detectability criterion doubles as a composition diagnostic: the line-forming region must be dominated by relatively light r-process elements, with only a small admixture of very neutron-rich material that raises the actinide-to-lanthanide ratio.
- Unequal-mass neutron star mergers and black hole–neutron star binaries, which numerical nucleosynthesis models associate with high actinide-to-lanthanide ratios, are the most promising observational targets.
- A non-detection does not mean actinides are absent: if the lanthanide fraction is too high or the ratio is only solar-like, the thorium feature stays hidden even when thorium itself is abundant.
Reading between the lines
- Because the required thorium mass fraction scales linearly with the estimated transition strengths, laboratory measurements of the Th III near-infrared lines would shrink the main uncertainty and sharpen the detectability criterion.
- Non-LTE effects, which the paper notes can keep some heavy elements in doubly ionized states for weeks, may extend the visible phase of the thorium feature well past the 3.5-day limit found under LTE, making late-time spectra worth examining as well.
- The same line-list calibration recipe could be applied to protactinium and heavier actinides once experimental data exist, potentially revealing additional near-infrared actinide features beyond the thorium trough.
- Archival space-based near-infrared spectra of GW170817/AT2017gfo, if they cover the 1.8 micron region with sufficient quality, could provide an immediate test of the prediction, although the paper itself does not attempt that identification.
Editorial analysis
A structured set of objections, weighed in public.
Referee Report
Summary. The paper investigates whether elements beyond the third r-process peak can be identified in kilonova photospheric spectra. The authors construct and update line lists for Ra II, Ac III, and Th III, combine them with their existing hybrid line list, compute Sobolev optical depths under LTE, and run Monte Carlo radiative transfer for two abundance models (Light and Solar). They conclude that Th III is the most promising candidate, producing broad absorption near 18000 Å when the lanthanide mass fraction X(lan) is ≲ 6×10^-4 and the actinide-to-lanthanide ratio is at least the solar r-process value. They argue such conditions are plausible in mergers of unequal-mass neutron stars or black hole-neutron star binaries, and recommend space- or high-altitude observations in the telluric-affected NIR region.
Significance. If the central claim holds, the paper provides a concrete, falsifiable spectroscopic prediction for actinide production in neutron star mergers, with a specific wavelength, epoch window (roughly 1 to 2.5 days), and abundance condition. The forward modeling is transparent and systematic: the authors compute Sobolev optical depths for candidate heavy species, identify why Th III is special (dense low-lying levels, favorable ionization balance), and present with/without-Th III spectral comparisons that isolate the predicted feature. They also make the estimated Th III line list available in Appendix A. The main weakness is the atomic-data basis: the NIR Th III gf-values are not measured but recovered from relative intensities via a single Boltzmann temperature, and the Ce III gf-values near 20000 Å are theoretical. These uncertainties propagate linearly into the abundance condition that is the paper's principal quantitative result, so the criterion should be presented with an explicit uncertainty range.
major comments (3)
- [Section 2.1, Eq. (1), and Figure 1] The central detection criterion is not yet robust as stated because the Th III NIR gf-values are calibrated from a single least-squares Boltzmann temperature T=6000 K applied to optical lines, while Figure 1 shows a factor-of-three scatter between measured and calculated intensities and the NIR lines reach upper-level energies up to roughly 28000 cm^-1, outside the calibration range. The authors acknowledge in Section 4 that the required Th mass fraction scales linearly with the gf-values, but they do not propagate the factor-of-three uncertainty into the X(lan) threshold or the actinide-to-lanthanide ratio. A factor-of-three overestimate of the true NIR gf-values would raise the required Th abundance by the same factor and push the criterion to the boundary of the factor-of-three actinide-boost range invoked in Section 3.2. I request a sensitivity calculation with the Th III NIR gf-values scaled by 1/3 and 3, and a restatement of the detection threshold as an allowed range rather than a single value.
- [Sections 3.2 and 4] The visibility of the Th feature is set against the Ce III opacity near 20000 Å, and the gf-values of these Ce III lines are theoretical and uncalibrated except for the strongest lines near 16000 Å, as the authors state in Section 4. Because the threshold X(lan) is effectively the value at which the Ce III background drops below the Th III opacity, an uncertainty in the Ce III gf-values translates directly into an uncertainty in the threshold. The paper should include a sensitivity study with the Ce III gf-values varied by a factor of 2–3 and should state whether the conclusion survives those variations.
- [Section 4] The observational claim that JWST/NIRSpec or high-altitude telescopes 'will give sufficient signal to noise ratio' to detect the Th feature is asserted without a quantitative estimate. Given that the feature sits in a region of strong telluric absorption and the synthetic fluxes in Figures 10 and 11 are only shown for an AT2017gfo-like event, a simple S/N estimate for a GW170817-like event at ~200 Mpc with a proposed instrument configuration would make the detectability statement much stronger. This is not the central modeling result, but it is part of the paper's stated practical conclusion.
minor comments (4)
- [Abstract and Section 3.2] The phrase 'solar r-process ratio' should be defined more carefully: the L model's Th-to-lanthanide ratio is about a factor of two higher than the present solar r-residual ratio because of 232Th decay over ~13 Gyr, so the criterion is not directly comparing to the present solar photospheric ratio.
- [Section 2.1] The cross-reference 'Table 2.1' should be 'Table 2', and the footnote referring to 'gl-values' appears to mean 'gf-values' or should be rewritten for clarity.
- [Throughout] There are several typographical errors: 'kilonvoae' in the Introduction, 'Soboelv' in Section 2.3, 'λ /greaterorsimilar20000' in Section 3.2, and 'faction' in Section 4. These should be corrected.
- [Figure 1] The axes 'Calculated intensity' and 'Relative intensity (NIST)' would be clearer with explicit labels and a note that intensities are in arbitrary units; the red/blue circle legend should also be explained more fully in the caption.
Circularity Check
No significant circularity: the Th III feature is a forward prediction from laboratory-calibrated atomic data, not fitted to any kilonova spectrum.
full rationale
The paper's central claim is a forward radiative-transfer prediction. The Th III NIR gf-values are estimated from laboratory relative intensities (Engleman 2003; NIST ASD) via Eq. (1) with T=6000 K obtained by least-squares against optical lines with known gf-values (Biémont et al. 2002); no kilonova absorption is used to set these values. The detection criterion (X(lan) lesssim 6e-4 and actinide/lanthanide ratio at least the solar r-process value) is derived by varying the L-model abundances and reading off when a feature appears at about 18000 angstroms. The authors explicitly do not claim detection: "we do not attempt to identify Th III in the spectra of AT2017gfo." The main caveat, that the required Th mass fraction scales linearly with the uncertain gf-values, is a data-uncertainty limitation, not an input-output equivalence. Self-citations to Domoto et al. (2022) supply the hybrid line list and the L abundance model, but the conclusion does not reduce to those citations; any error in the atomic data would weaken the prediction, not make it tautologically true.
Assumptions & free parameters
free parameters (5)
- Th III NIR gf-values =
log gf from -3.099 to +1.153 (Table 2)
- Excitation temperature T_exc for Th III intensity calibration =
6000 K
- Heavy-element scaling factor in L abundance model =
3% of r-process residuals for A=100-205
- Lanthanide mass fraction X(lan) =
5.8e-4 fiducial, varied by 1/3x to 3x
- Actinide-to-lanthanide ratio =
1x to 10x fiducial, with 3x motivated by actinide-boost stars
assumptions (6)
- domain assumption LTE holds for ionization and excitation in the line-forming region
- standard math Sobolev approximation is valid for homologously expanding ejecta
- domain assumption Experimental Th III level populations follow a Boltzmann distribution at a single excitation temperature
- domain assumption Elements with Z=82-88 and Z>90 (except Ac III and Th III) contribute negligibly to NIR opacity
- domain assumption The L model abundance pattern represents the line-forming region rather than the whole ejecta
- domain assumption Homogeneous abundance distribution within ejecta layers
Cite this review
Pith. "Pith review of Thorium in Kilonova Spectra: Exploring the Heaviest Detectable Element." pith.science (2026). https://pith.science/paper/IZZE5HTL
@misc{pith2026241116998,
  author       = {Pith},
  title        = {Pith review of: Thorium in Kilonova Spectra: Exploring the Heaviest Detectable Element},
  year         = {2026},
  howpublished = {\url{https://pith.science/paper/IZZE5HTL}},
  note         = {Machine review of arXiv:2411.16998}
}
abstract
Kilonova spectra provide us with the direct information of r-process nucleosynthesis in neutron star mergers. In this paper, we study the signatures of elements beyond the third r-process peak expected to be produced in neutron-rich ejecta in the photospheric spectra of kilonova. Ra II, Ac III, and Th III are our candidates because they have a small number of valence electrons and low-lying energy levels, which tend to result in strong absorption features. We systematically calculate the strength of bound-bound transitions of these candidates by constructing the line list based on the available atomic database. We find that Th III is the most promising species showing strong transitions at the NIR wavelengths. By performing radiative transfer simulations, we find that Th III produces broad absorption features at ~18000 A in the spectra when the mass ratio of actinides to lanthanides is larger than the solar r-process ratio and the mass fraction of lanthanides is $\lesssim 6\times10^{-4}$. Our models demonstrate that the Th feature may be detectable if the bulk of the ejecta in the line-forming region is dominated by relatively light r-process elements with the mixture of a small fraction of very neutron-rich material. Such conditions may be realized in the mergers of unequal-mass neutron stars or black hole-neutron star binaries. To detect the Th absorption features, the observations from the space (such as JWST) or high-altitude sites are important as the wavelength region of the Th features is overlapped with that affected by the strong telluric absorption.
Figures


Figures from the paper (8 more)



Forward citations
Cited by 2 Pith papers
-
nmma: An extended Bayesian framework for Nuclear Multimessenger Astronomy in the Era of Next-Generation Detectors
nmma now jointly samples nuclear EoS parameters with GW and EM data via TOV emulators and Fiesta surrogates, delivering 20–60× speedups and future H0–nuclear constraints.
-
Revisiting Near-Infrared Features of Kilonovae: The Importance of Gadolinium
Gd III produces strong near-infrared absorption, including a 14,336 Å line that contributes to the ~12,000 Å kilonova feature formerly attributed to La III, and is detectable in the chemically peculiar star HR 465.
Reference graph
Works this paper leans on
-
[1]
Abbott, B. P., Abbott, R., Abbott, T. D., et al. 2017a, PhRvL, 119, 161101, doi: 10.1103/PhysRevLett.119.161101 —. 2017b, ApJL, 848, L12, doi: 10.3847/2041-8213/aa91c9
-
[2]
Arcavi, I., Hosseinzadeh, G., Howell, D. A., et al. 2017, Nature, 551, 64, doi: 10.1038/nature24291
-
[3]
Barnes, J., Kasen, D., Wu, M.-R., & Mart ´ ınez-Pinedo, G. 2016, ApJ, 829, 110, doi: 10.3847/0004-637X/829/2/110 Bi´ emont, E., Palmeri, P., Quinet, P., Zhang, Z. G., &
-
[4]
2002, ApJ, 567, 1276, doi: 10.1086/338700 B¨ oker, T., Beck, T
Svanberg, S. 2002, ApJ, 567, 1276, doi: 10.1086/338700 B¨ oker, T., Beck, T. L., Birkmann, S. M., et al. 2023, PASP, 135, 038001, doi: 10.1088/1538-3873/acb846
doi:10.1086/338700 2002
-
[5]
Coulter, D. A., Foley, R. J., Kilpatrick, C. D., et al. 2017, Science, 358, 1556, doi: 10.1126/science.aap9811
-
[6]
Cowan, J. J., Sneden, C., Beers, T. C., et al. 2005, ApJ, 627, 238, doi: 10.1086/429952
doi:10.1086/429952 2005
-
[7]
2022, ApJ, 939, 8, doi: 10.3847/1538-4357/ac8c36
Domoto, N., Tanaka, M., Kato, D., et al. 2022, ApJ, 939, 8, doi: 10.3847/1538-4357/ac8c36
-
[8]
2021, ApJ, 913, 26, doi: 10.3847/1538-4357/abf358
Domoto, N., Tanaka, M., Wanajo, S., & Kawaguchi, K. 2021, ApJ, 913, 26, doi: 10.3847/1538-4357/abf358
Show all 78 references
-
[9]
2023, ApJ, 956, 113, doi: 10.3847/1538-4357/acf65a
Domoto, N., Lee, J.-J., Tanaka, M., et al. 2023, ApJ, 956, 113, doi: 10.3847/1538-4357/acf65a
2023 doi
-
[10]
Eichler, D., Livio, M., Piran, T., & Schramm, D. N. 1989, Nature, 340, 126, doi: 10.1038/340126a0
1989 doi
-
[11]
2003, JQSRT, 78, 1, doi: 10.1016/S0022-4073(02)00173-5
Engleman, R., J. 2003, JQSRT, 78, 1, doi: 10.1016/S0022-4073(02)00173-5
2003 doi
-
[12]
A., Cenko, S
Evans, P. A., Cenko, S. B., Kennea, J. A., et al. 2017, Science, 358, 1565, doi: 10.1126/science.aap9580 Fl¨ ors, A., Silva, R. F., Deprince, J., et al. 2023, MNRAS, 524, 3083, doi: 10.1093/mnras/stad2053
2017 doi
-
[13]
J., Fryer, C
Fontes, C. J., Fryer, C. L., Wollaeger, R. T., Mumpower, M. R., & Sprouse, T. M. 2023, MNRAS, 519, 2862, doi: 10.1093/mnras/stac2792
2023 doi
-
[14]
Freiburghaus, C., Rosswog, S., & Thielemann, F. K. 1999, ApJL, 525, L121, doi: 10.1086/312343
1999 doi
-
[15]
2023, ApJ, 942, 39, doi: 10.3847/1538-4357/ac9ce0
Fujibayashi, S., Kiuchi, K., Wanajo, S., et al. 2023, ApJ, 942, 39, doi: 10.3847/1538-4357/ac9ce0
2023 doi
-
[16]
2024, MNRAS, 530, 5220, doi: 10.1093/mnras/stae1196
Gaigalas, G., Rynkun, P., Domoto, N., et al. 2024, MNRAS, 530, 5220, doi: 10.1093/mnras/stae1196
2024 doi
-
[17]
Ballance, C. P. 2021, MNRAS, 506, 3560, doi: 10.1093/mnras/stab1861
2021 doi
-
[18]
2022, MNRAS, 515, 631, doi: 10.1093/mnras/stac1258
Goriely, S. 2022, MNRAS, 515, 631, doi: 10.1093/mnras/stac1258
2022 doi
-
[19]
2011, ApJL, 738, L32, doi: 10.1088/2041-8205/738/2/L32
Goriely, S., Bauswein, A., & Janka, H.-T. 2011, ApJL, 738, L32, doi: 10.1088/2041-8205/738/2/L32
2011 doi
-
[20]
M., Beers, T
Holmbeck, E. M., Beers, T. C., Roederer, I. U., et al. 2018, ApJL, 859, L24, doi: 10.3847/2041-8213/aac722
2018 doi
-
[21]
Honda, S., Aoki, W., Ishimaru, Y., Wanajo, S., & Ryan, S. G. 2006, ApJ, 643, 1180, doi: 10.1086/503195
2006 doi
-
[22]
2021, MNRAS, 506, 5863, doi: 10.1093/mnras/stab1975 Exploring Th features in Kilonova Spectra 17 —
Hotokezaka, K., Tanaka, M., Kato, D., & Gaigalas, G. 2021, MNRAS, 506, 5863, doi: 10.1093/mnras/stab1975 Exploring Th features in Kilonova Spectra 17 —. 2022, MNRAS, 515, L89, doi: 10.1093/mnrasl/slac071 —. 2023, MNRAS, 526, L155, doi: 10.1093/mnrasl/slad128
2021 doi
-
[23]
2022 , A&A, 661, A80, doi: 10.1051/0004-6361/202142663
Jakobsen, P., Ferruit, P., Alves de Oliveira, C., et al. 2022 , A&A, 661, A80, doi: 10.1051/0004-6361/202142663
2022 doi
-
[24]
R., & Barnes, J
Kasen, D., Badnell, N. R., & Barnes, J. 2013, ApJ, 774, 25, doi: 10.1088/0004-637X/774/1/25
2013 doi
-
[25]
2017, Nature, 551, 80, doi: 10.1038/nature24453
Ramirez-Ruiz, E. 2017, Nature, 551, 80, doi: 10.1038/nature24453
2017 doi
-
[26]
C., & Nugent, P
Kasen, D., Thomas, R. C., & Nugent, P. 2006, ApJ, 651, 366, doi: 10.1086/506190
2006 doi
-
[27]
M., Kasen, D., Lau, R
Kasliwal, M. M., Kasen, D., Lau, R. M., et al. 2022, MNRAS, 510, L7, doi: 10.1093/mnrasl/slz007
2022 doi
- [28]
-
[29]
2023, MNRAS, 525, 3384, doi: 10.1093/mnras/stad2430
Kawaguchi, K., Fujibayashi, S., Domoto, N., et al. 2023, MNRAS, 525, 3384, doi: 10.1093/mnras/stad2430
2023 doi
-
[30]
2018, ApJL, 865, L21, doi: 10.3847/2041-8213/aade02 —
Kawaguchi, K., Shibata, M., & Tanaka, M. 2018, ApJL, 865, L21, doi: 10.3847/2041-8213/aade02 —. 2020, ApJ, 889, 171, doi: 10.3847/1538-4357/ab61f6
2018 doi
-
[31]
2012, MNRAS, 426, 1940, doi: 10.1111/j.1365-2966.2012.21859.x
Korobkin, O., Rosswog, S., Arcones, A., & Winteler, C. 2012, MNRAS, 426, 1940, doi: 10.1111/j.1365-2966.2012.21859.x
2012
-
[32]
2022, Atoms, 10, 42, doi: 10.3390/atoms10020042
Kramida, A. 2022, Atoms, 10, 42, doi: 10.3390/atoms10020042
2022 doi
-
[33]
Ralchenko, Reader, J., & and NIST ASD Team
Kramida, A., Yu. Ralchenko, Reader, J., & and NIST ASD Team. 2023, NIST Atomic Spectra Database (ver. 5.11), [Online]. Available: https://physics.nist.gov/asd. National Institute of Standards and Technology,
2023
-
[34]
Kullmann, I., Goriely, S., Just, O., Bauswein, A., & Janka, H. T. 2023, MNRAS, 523, 2551, doi: 10.1093/mnras/stad1458
2023 doi
-
[35]
A., Stempels, H
Kupka, F., Piskunov, N., Ryabchikova, T. A., Stempels, H. C., & Weiss, W. W. 1999, A&AS, 138, 119, doi: 10.1051/aas:1999267
1999 doi
-
[36]
M., & Schramm, D
Lattimer, J. M., & Schramm, D. N. 1974, ApJL, 192, L145, doi: 10.1086/181612
1974 doi
-
[37]
1998, ApJL, 507, L59, doi: 10.1086/311680
Li, L.-X., & Paczy´ nski, B. 1998, ApJL, 507, L59, doi: 10.1086/311680
1998 doi
-
[38]
Lucy, L. B. 2003, A&A, 403, 261, doi: 10.1051/0004-6361:20030357
2003 doi
-
[39]
1957, Journal of Research of the National Bureau of Standards, 58, 297, doi: 10.6028/jres.058.037
Meggers, W., Fred, M., & Tomkins, F. 1957, Journal of Research of the National Bureau of Standards, 58, 297, doi: 10.6028/jres.058.037
1957 doi
-
[40]
D., Mart ´ ınez-Pinedo, G., Darbha, S., et al
Metzger, B. D., Mart ´ ınez-Pinedo, G., Darbha, S., et al. 2010, MNRAS, 406, 2650, doi: 10.1111/j.1365-2966.2010.16864.x
2010
-
[41]
A., & Engleman, R
Palmer, B. A., & Engleman, R. 1983, Atlas of the Thorium spectrum (Los Alamos National Laboratory)
1983
-
[42]
2017, ApJL, 850, L37, doi: 10.3847/2041-8213/aa9ab9
Perego, A., Radice, D., & Bernuzzi, S. 2017, ApJL, 850, L37, doi: 10.3847/2041-8213/aa9ab9
2017 doi
-
[43]
2022, ApJ, 925, 22, doi: 10.3847/1538-4357/ac3751
Perego, A., Vescovi, D., Fiore, A., et al. 2022, ApJ, 925, 22, doi: 10.3847/1538-4357/ac3751
2022 doi
-
[44]
2017, Nature, 551, 67, doi: 10.1038/nature24298
Pian, E., D’Avanzo, P., Benetti, S., et al. 2017, Nature, 551, 67, doi: 10.1038/nature24298
2017 doi
-
[45]
E., Kupka, F., Ryabchikova, T
Piskunov, N. E., Kupka, F., Ryabchikova, T. A., Weiss, W. W., & Jeffery, C. S. 1995, A&AS, 112, 525
1995
-
[46]
M., Almeida-Fernandes, F., Holmbeck, E
Placco, V. M., Almeida-Fernandes, F., Holmbeck, E. M., et al. 2023, ApJ, 959, 60, doi: 10.3847/1538-4357/ad077e
2023 doi
-
[47]
2023, MNRAS, 526, 5220, doi: 10.1093/mnras/stad3106
Pognan, Q., Grumer, J., Jerkstrand, A., & Wanajo, S. 2023, MNRAS, 526, 5220, doi: 10.1093/mnras/stad3106
2023 doi
-
[48]
2022a, MNRAS, 513, 5174, doi: 10.1093/mnras/stac1253 —
Pognan, Q., Jerkstrand, A., & Grumer, J. 2022a, MNRAS, 513, 5174, doi: 10.1093/mnras/stac1253 —. 2022b, MNRAS, 510, 3806, doi: 10.1093/mnras/stab3674
-
[49]
2020, MNRAS, 491, 1832, doi: 10.1093/mnras/stz3154
Prantzos, N., Abia, C., Cristallo, S., Limongi, M., & Chieffi, A. 2020, MNRAS, 491, 1832, doi: 10.1093/mnras/stz3154
2020 doi
-
[50]
M., Dzuba, V
Roberts, B. M., Dzuba, V. A., & Flambaum, V. V. 2013, PhRvA, 88, 012510, doi: 10.1103/PhysRevA.88.012510
2013 doi
-
[51]
F., Kasen, D., Lee, W
Roberts, L. F., Kasen, D., Lee, W. H., & Ramirez-Ruiz, E. 2011, ApJL, 736, L21, doi: 10.1088/2041-8205/736/1/L21
2011 doi
-
[52]
U., Lawler, J
Roederer, I. U., Lawler, J. E., Sobeck, J. S., et al. 2012, ApJS, 203, 27, doi: 10.1088/0067-0049/203/2/27
2012 doi
-
[53]
2018, A&A, 615, A132, doi: 10.1051/0004-6361/201732117
Rosswog, S., Sollerman, J., Feindt, U., et al. 2018, A&A, 615, A132, doi: 10.1051/0004-6361/201732117
2018 doi
-
[54]
L., et al
Ryabchikova, T., Piskunov, N., Kurucz, R. L., et al. 2015, PhyS, 90, 054005, doi: 10.1088/0031-8949/90/5/054005
2015 doi
-
[55]
I., Johnson, W
Safronova, U. I., Johnson, W. R., & Safronova, M. S. 2007, PhRvA, 76, 042504, doi: 10.1103/PhysRevA.76.042504
2007 doi
-
[56]
Timmermans, R. G. E. 2009, PhRvA, 79, 052512, doi: 10.1103/PhysRevA.79.052512
2009 doi
-
[57]
2017, PhRvD, 96, 123012, doi: 10.1103/PhysRevD.96.123012
Shibata, M., Fujibayashi, S., Hotokezaka, K., et al. 2017, PhRvD, 96, 123012, doi: 10.1103/PhysRevD.96.123012
2017 doi
-
[58]
F., Sampaio, J
Silva, R. F., Sampaio, J. M., Amaro, P., et al. 2022, Atoms, 10, 18, doi: 10.3390/atoms10010018 Siqueira Mello, C., Spite, M., Barbuy, B., et al. 2013, A&A, 550, A122, doi: 10.1051/0004-6361/201219949
2022 doi
-
[59]
J., Chen, T
Smartt, S. J., Chen, T. W., Jerkstrand, A., et al. 2017, Nature, 551, 75, doi: 10.1038/nature24303
2017 doi
-
[60]
2024, arXiv e-prints, arXiv:2407.12907, doi: 10.48550/arXiv.2407.12907
Sneppen, A., Damgaard, R., Watson, D., et al. 2024, arXiv e-prints, arXiv:2407.12907, doi: 10.48550/arXiv.2407.12907
2024 doi
-
[61]
2023, A&A, 675, A194, doi: 10.1051/0004-6361/202346421
Sneppen, A., & Watson, D. 2023, A&A, 675, A194, doi: 10.1051/0004-6361/202346421
2023 doi
-
[62]
Sobolev, V. V. 1960, Moving envelopes of stars (Harvard University Press), doi: 10.4159/harvard.9780674864658 18 N. Domoto et al
1960 doi
-
[63]
2013, ApJ, 775, 113, doi: 10.1088/0004-637X/775/2/113
Tanaka, M., & Hotokezaka, K. 2013, ApJ, 775, 113, doi: 10.1088/0004-637X/775/2/113
2013 doi
-
[64]
2014, ApJ, 780, 31, doi: 10.1088/0004-637X/780/1/31
Tanaka, M., Hotokezaka, K., Kyutoku, K., et al. 2014, ApJ, 780, 31, doi: 10.1088/0004-637X/780/1/31
2014 doi
-
[65]
2020, MNRAS, 496, 1369, doi: 10.1093/mnras/staa1576
Tanaka, M., Kato, D., Gaigalas, G., & Kawaguchi, K. 2020, MNRAS, 496, 1369, doi: 10.1093/mnras/staa1576
2020 doi
-
[66]
A., et al
Tanaka, M., Utsumi, Y., Mazzali, P. A., et al. 2017, PASJ, 69, 102, doi: 10.1093/pasj/psx121
2017 doi
-
[67]
2023, ApJ, 953, 17, doi: 10.3847/1538-4357/acdc95
Tanaka, M., Domoto, N., Aoki, W., et al. 2023, ApJ, 953, 17, doi: 10.3847/1538-4357/acdc95
2023 doi
- [68]
-
[69]
2017, PASJ, 69, 101, doi: 10.1093/pasj/psx118
Utsumi, Y., Tanaka, M., Tominaga, N., et al. 2017, PASJ, 69, 101, doi: 10.1093/pasj/psx118
2017 doi
-
[70]
J., Yang, S., et al
Valenti, S., Sand, D. J., Yang, S., et al. 2017, ApJL, 848, L24, doi: 10.3847/2041-8213/aa8edf
2017 doi
-
[71]
A., Cowperthwaite, P
Villar, V. A., Cowperthwaite, P. S., Berger, E., et al. 2018, ApJL, 862, L11, doi: 10.3847/2041-8213/aad281
2018 doi
-
[72]
2018, ApJ, 868, 65, doi: 10.3847/1538-4357/aae0f2
Wanajo, S. 2018, ApJ, 868, 65, doi: 10.3847/1538-4357/aae0f2
2018 doi
- [73]
-
[74]
2014, ApJL, 789, L39, doi: 10.1088/2041-8205/789/2/L39
Wanajo, S., Sekiguchi, Y., Nishimura, N., et al. 2014, ApJL, 789, L39, doi: 10.1088/2041-8205/789/2/L39
2014 doi
-
[75]
J., Selsing, J., et al
Watson, D., Hansen, C. J., Selsing, J., et al. 2019, Nature, 574, 497, doi: 10.1038/s41586-019-1676-3
2019 doi
-
[76]
Wu, M.-R., Barnes, J., Mart ´ ınez-Pinedo, G., & Metzger, B. D. 2019, PhRvL, 122, 062701, doi: 10.1103/PhysRevLett.122.062701
2019 doi
-
[77]
2010, in Society of Photo-Optical Instrumentation Engineers (SPIE) Conference Series, Vol
Yoshii, Y., Aoki, T., Doi, M., et al. 2010, in Society of Photo-Optical Instrumentation Engineers (SPIE) Conference Series, Vol. 7733, Ground-based and Airborne Telescopes III, ed. L. M. Stepp, R. Gilmozzi, & H. J. Hall, 773308, doi: 10.1117/12.856680
2010 doi
-
[78]
T., Vassh, N., et al
Zhu, Y., Wollaeger, R. T., Vassh, N., et al. 2018, ApJL, 863, L23, doi: 10.3847/2041-8213/aad5de
2018 doi
Reviewed August 12, 2026 · model on record in the stance chip above.
Discussion (0). Continue with ORCID to comment.